3823
Reproducibility of wall shear stress in abdominal aortic aneurysms estimated by 4D flow magnetic resonance imaging1Vascular Surgery, Amsterdam University Medical Centers, Amsterdam Cardiovascular Sciences, Vrije Universiteit Amsterdam, Amsterdam, Netherlands, 2Radiology & Nuclear Medicine, Amsterdam University Medical Centers, Amsterdam Cardiovascular Sciences, University of Amsterdam, Amsterdam, Netherlands
Synopsis
Keywords: Flow, Quantitative Imaging, abdominal aortic aneurysm
The aim of this study was to assess the reproducibility and inter- and intra-observer agreement for estimating wall shear stress (WSS) in abdominal aortic aneurysms (AAAs) based on 4D flow magnetic resonance imaging (MRI). Asymptomatic AAA patients were included and scanned twice with a one-week interval. Phase-contrast angiographies were acquired by voxel-wise multiplication of magnitude and phase data. Based on statistical analyses the reproducibility was good. An inverse correlation was found between WSS and lumen diameter. Both vorticity and intraluminal thrombus volume were associated with minimum WSS in AAA. 4D flow MRI is robust for estimating WSS in AAAs.Introduction
An abdominal aortic aneurysm (AAA) is a pathological dilation of the abdominal aorta. To prevent rupture of an AAA, and consequently bleeding into the abdomen, elective surgery can be performed. According to the ESVS guidelines, patients are eligible for surgical AAA repair when the maximal diameter exceeds 5.5cm for men and 5cm for women [1]. However, using a single measure to decide on a potentially harmful intervention may be inadequate [2]. Moreover, aortic diameter is a static measure that gives no information about dynamic processes within the AAA. Consequently, there is a growing interest in dynamic imaging parameters as novel predictors of AAA progression and rupture risk. Based on 4D flow magnetic resonance imaging (MRI), wall shear stress (WSS), the frictional tangential force of the blood flow on the vessel wall, can be estimated. Regions of low WSS in AAA have been associated with aneurysm growth and rupture [3,4]. In this study we tested the reproducibility, and inter- and intra-observer agreement of 4D flow MRI for estimating WSS in patients with an asymptomatic AAA. Furthermore, vorticity and correlations between flow velocity, WSS, lumen diameter and intraluminal thrombus (ILT) volume in the AAA were assessed.Methods
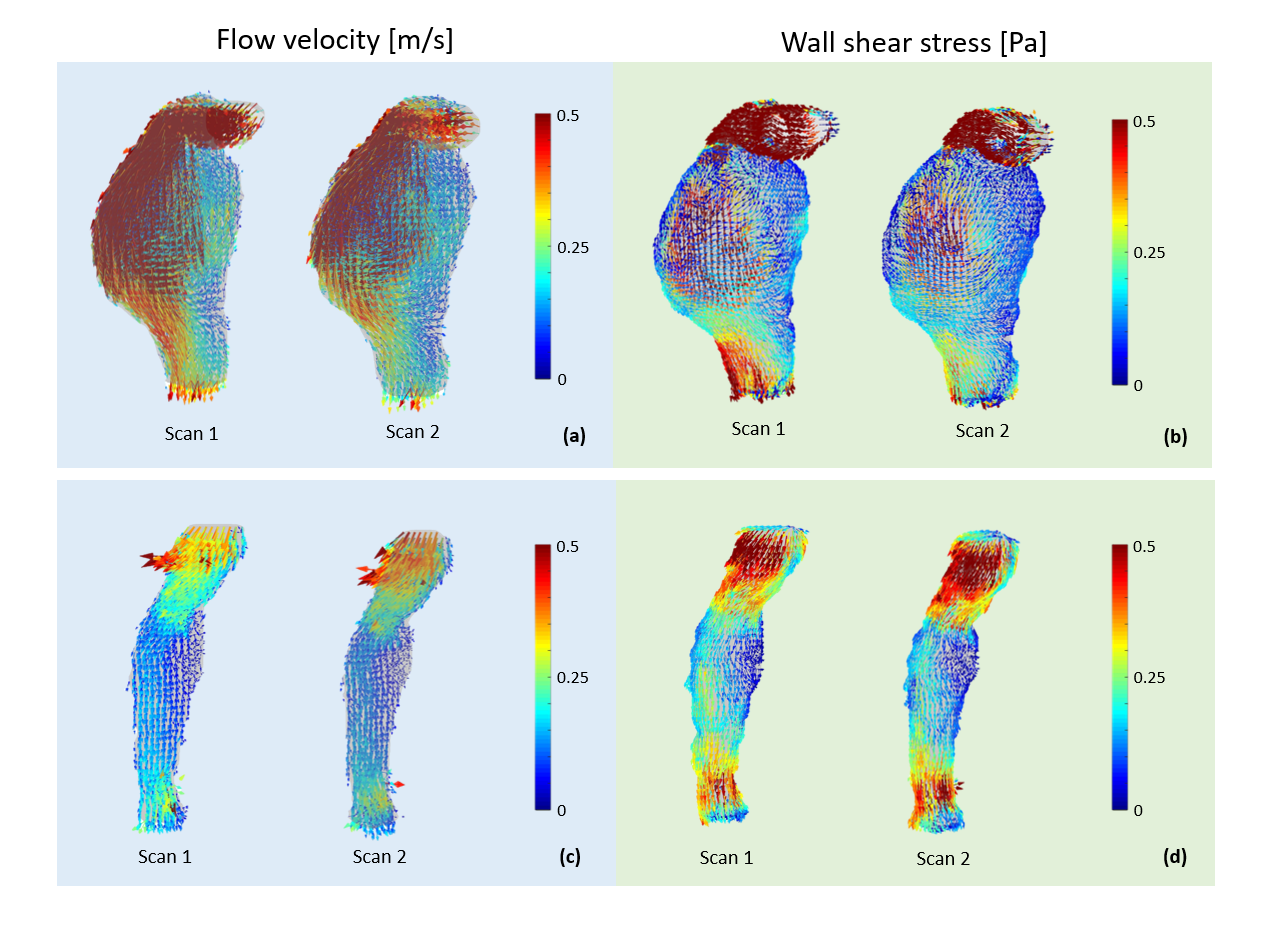
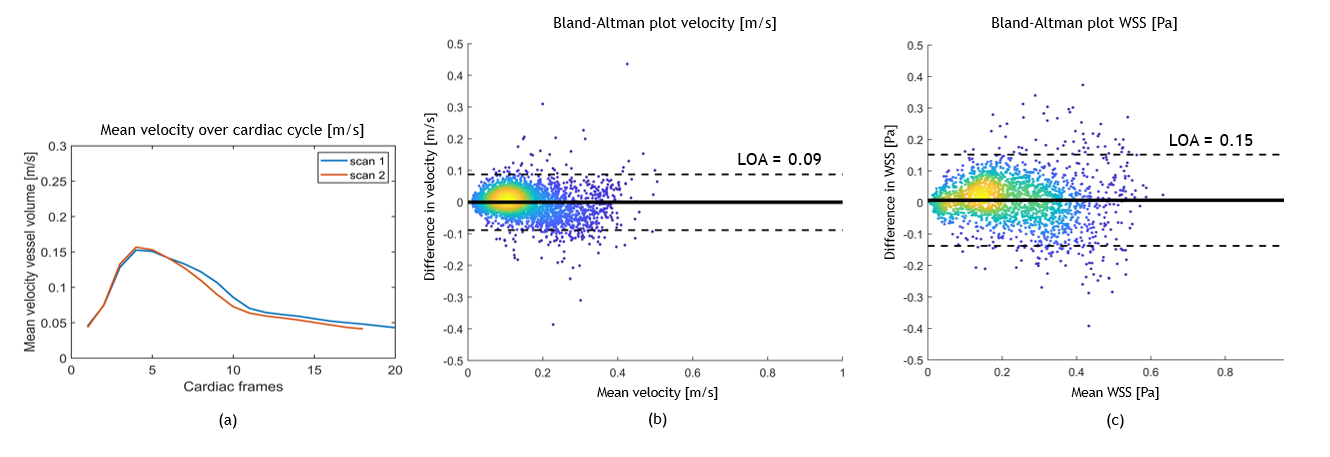
In this single-centre cross-sectional study patients with an asymptomatic AAA of at least 30 mm in diameter were recruited. Participants were planned for two consecutive abdominal free-breathing 4D flow MRI acquisitions with retrospective ECG-gating with a one week interval. 4D flow MRI parameters were: spatial resolution=(2.5mm)3, temporal resolution=±40ms TE/TR/FA=2.6ms/3.9ms/8°, VENC=0.52m/s, SENSE=2.5, resulting in a scan time of ±7min. A saturation slab was placed over the abdomen to minimize respiratory blurring. A scan was defined as feasible if it allowed for post-processing. Three dimensional phase-contrast angiographies were reconstructed by voxel-wise multiplication of acquired magnitude and phase data, averaged over all cardiac time frames. These images were used to semi-automatically segment the abdominal aorta lumen. Flow velocity and WSS were respectively measured and estimated on the aortic luminal or endoluminal thrombus surface at peak systole (Figure 1). Vorticity was scored by a radiologist based on a three-level grading scale. To assess the reproducibility the segmented volume of the second scan was registered to the first scan. Flow velocity and WSS values of the second scan were interpolated to the first scan, to allow voxel-by-voxel analyses. The average top and bottom 5% voxels were utilised to calculate maximum and minimal values within the aneurysm. Bland-Altman analyses, orthogonal regression with Pearson’s correlation coefficient and Dice-scores were used to assess reproducibility. ILT volume was semi-automatically segmented and quantified on 3D Dixon images (spatial resolution =0.9mm*0.9mm*3.5mm). For the correlations between flow velocity, WSS, lumen diameter and ILT volume in the AAA, Spearman’s correlation coefficients were utilised since these data were not normally distributed. Linear regression was used to evaluate the relation between WSS and vorticity.Results
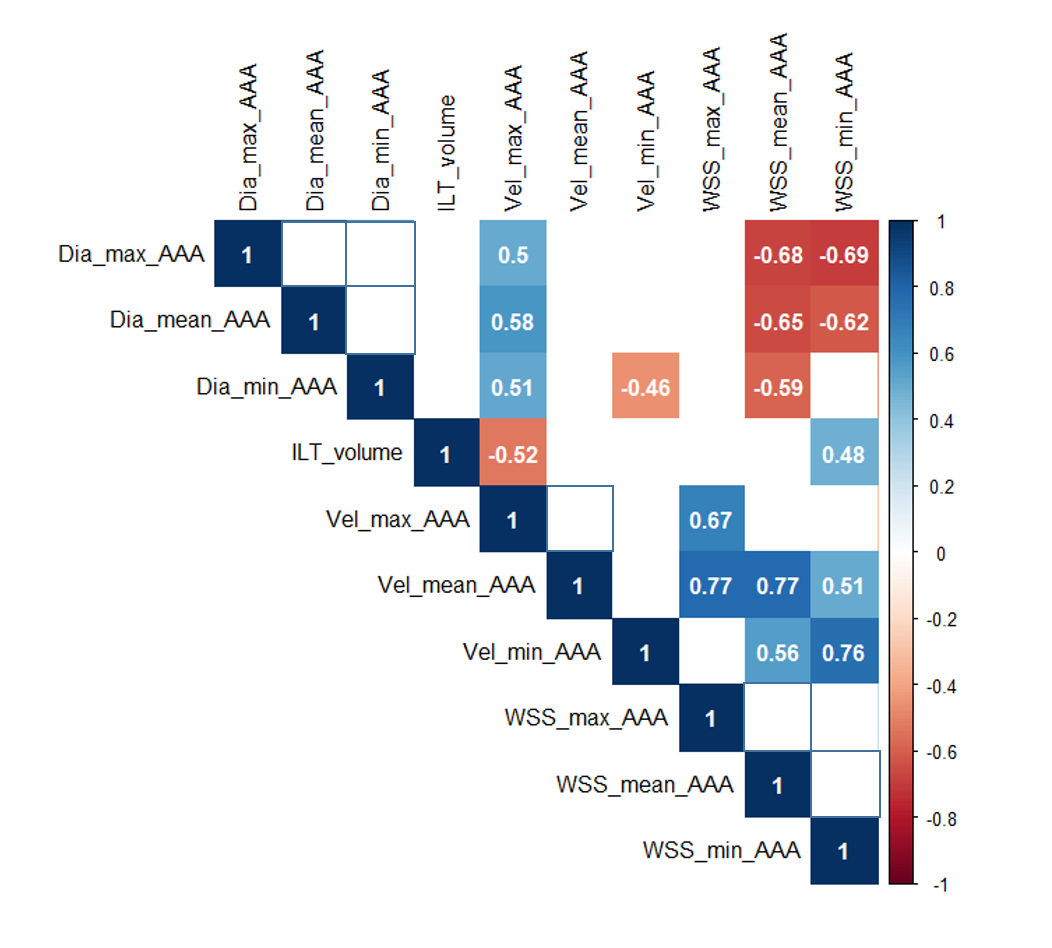
Forty-three out of 50 planned acquisitions were successful resulting in a feasibility of 86%. Nineteen patients (one female) underwent two successful acquisitions and were included in further analyses. Seven datasets were manually unaliased. Examples are given for pathline data of an aneurysm with a large (Figure 2) and small lumen diameter (Figure 3). In Figure 2, vortex flow is present. A visual representation of the reproducibility in the same patients, for both flow velocity and WSS, is given in Figure 4. The mean difference in flow velocity and WSS between the scans averaged over all patients was 0.00±0.03 m/s and 0.01±0.04 Pa, respectively. The mean limits of agreement were of 0.13 m/s and 0.23 Pa. In Figure 5, the reproducibility results of one patient are shown. The inter- and intra-observer agreement showed a Dice-sore and a Pearson’s correlation coefficient of respectively 0.93 and 0.82±0.10 and 0.94 and 0.87±0.10. A matrix shows correlations between flow velocity, WSS, lumen diameter and ILT volume in the AAAs (Figure 6). Minimum WSS within the AAA was inversely correlated with maximum lumen diameter (R=-0.69, p<0.01) and correlated with ILT volume (R=0.48, p=0.04). Next to that, ILT volume was inversely correlated with maximum flow velocity (R=-0.52, p=0.02). Furthermore, correlations were found between flow velocity, and WSS and lumen diameter, respectively. The highest vorticity score in systole was associated with minimum WSS in the AAA (p=0.01).Discussion
The correlation found in this study between diameter and WSS in dilated aortas was previously reported [5,6]. In this respect, AAA wall exposed to low WSS is considered to be at further risk for dilation and consequently rupture. The found correlations between flow velocity and lumen diameter can be seen in the context of vessel dilation in regions where blood flow impinges on the vessel wall [7]. ILT seems to occur in regions of low blood flow velocity and low WSS. Associations between vorticity and WSS were present in this study, as previously described [5,8]. A limitation of the current study was that only lumen diameter measurements were assessed although clinically the maximum diameter of the entire aneurysm including plaque is considered.Conclusion
4D flow MRI is robust for estimating WSS in AAA. An inverse correlation between maximum lumen diameter and minimal WSS in AAA was found. Low WSS relates to higher vorticity and higher thrombus volume.Acknowledgements
No acknowledgement found.References
[1] Wanhainen, A., Verzini, F., Van Herzeele, I., Allaire, E., Bown, M., Cohnert, T., Verhagen, H. (2019). Editor's Choice - European Society for Vascular Surgery (ESVS) 2019 Clinical Practice Guidelines on the Management of Abdominal Aorto-iliac Artery Aneurysms. Eur J Vasc Endovasc Surg, 57(1), 8-93. doi:10.1016/j.ejvs.2018.09.020
[2] Earnshaw, J. J. (2021). The Indication for Elective Repair of Abdominal Aortic Aneurysm Should Be Reviewed. European Journal of Vascular and Endovascular Surgery, 61(1), 7-8. doi:https://doi.org/10.1016/j.ejvs.2020.09.001
[3] Boyd, A. J., Kuhn, D. C., Lozowy, R. J., & Kulbisky, G. P. (2016). Low wall shear stress predominates at sites of abdominal aortic aneurysm rupture. J Vasc Surg, 63(6), 1613-1619. doi:10.1016/j.jvs.2015.01.040
[4] Trenti, C., Ziegler, M., Bjarnegård, N., Ebbers, T., Lindenberger, M., & Dyverfeldt, P. (2022). Wall shear stress and relative residence time as potential risk factors for abdominal aortic aneurysms in males: a 4D flow cardiovascular magnetic resonance case–control study. Journal of Cardiovascular Magnetic Resonance, 24(1). doi:10.1186/s12968-022-00848-2
[5] Bürk, J., Blanke, P., Stankovic, Z., Barker, A., Russe, M., Geiger, J., Markl, M. (2012). Evaluation of 3D blood flow patterns and wall shear stress in the normal and dilated thoracic aorta using flow-sensitive 4D CMR. J Cardiovasc Magn Reson, 14(1), 84. doi:10.1186/1532-429x-14-84
[6] Takehara, Y., Isoda, H., Takahashi, M., Unno, N., Shiiya, N., Ushio, T., Nozaki, A. (2020). Abnormal Flow Dynamics Result in Low Wall Shear Stress and High Oscillatory Shear Index in Abdominal Aortic Dilatation: Initial in vivo Assessment with 4D-flow MRI. Magn Reson Med Sci, 19(3), 235-246. doi:10.2463/mrms.mp.2019-0188
[7] Meng, H., Tutino, V. M., Xiang, J., & Siddiqui, A. (2014). High WSS or low WSS? Complex interactions of hemodynamics with intracranial aneurysm initiation, growth, and rupture: toward a unifying hypothesis. AJNR Am J Neuroradiol, 35(7), 1254-1262. doi:10.3174/ajnr.A3558
[8] Condemi, F., Campisi, S., Viallon, M., Croisille, P., & Avril, S. (2020). Relationship Between Ascending Thoracic Aortic Aneurysms Hemodynamics and Biomechanical Properties. IEEE Trans Biomed Eng, 67(4), 949-956. doi:10.1109/tbme.2019.2924955
Figures
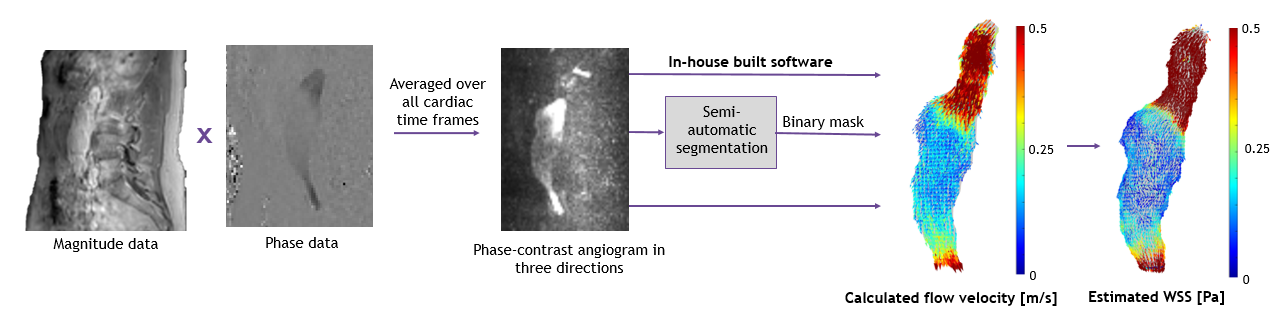

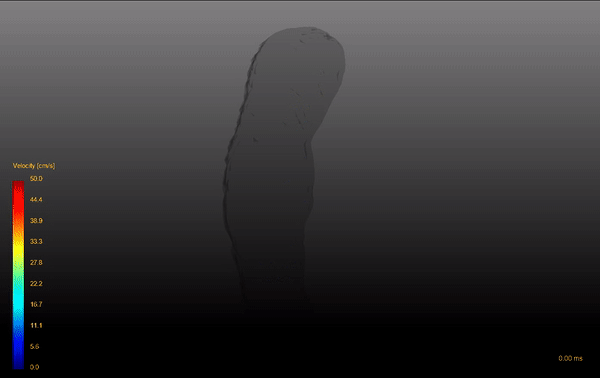
Figure 2: Four-dimensional blood flow velocity vector field in an abdominal aortic aneurysm with large lumen diameter over de cardiac cycle. Vortical flow is present within the aneurysm.