3820
3D phase contrast blood flow measurements in the coronary arteries1Friedrich-Alexander-University Erlangen-Nürnberg, Erlangen, Germany, 2Siemens Healthcare GmbH, Erlangen, Germany
Synopsis
Keywords: Flow, Cardiovascular
Phase contrast MRI enables flow measurement in the coronary arteries. Herewith we propose a 3D Flow sequence and present a novel 3D visualization and quantification tool. Whole heart 3D PC measurements were performed in more than 20 healthy volunteers. An isotropic resolution of 1.2x1.2x1.2mm3 was used, as well as an undersampling factor of 14 in combination with a compressed sensing reconstruction. Our postprocessing tool was used for the 3D visualization of blood flow information as well as quantification of flow velocities per slice perpendicular to the vessel centerline.
Introduction
Directly measuring the hemodynamic relevance of coronary artery stenoses non-invasively remains one of the holy grails in cardiac MRI. Phase contrast (PC) MRI can be used to non-invasively assess flow velocities in vascular structures1. Blood flow measurements in the coronary arteries are particularly challenging due to their tortuousness and small diameters, as well as cardiac and respiratory motion. Previous studies only considered 2D flow imaging or small subsections using 4D Flow and thus, yielded limited flow information or lacking robustness2,3,4,5.Visualization of the results is challenging due to the need for vessel segmentation or centerline extraction, which are typically based on magnitude images. Furthermore, due to the vessel structures, curved multiplanar reformation (CMPR) is often required for a 2D display of the full vessel. To our knowledge, tools providing these functionalities do not enable the reapplication of reformations or segmentations to the corresponding flow velocity volume. Furthermore, visualization tools cannot be used to calculate flow velocities from phase images, requiring pre-processing and therefore, adding complexity to the workflow.
The aim of this work was to develop a novel acquisition sequence and a post-processing tool to evaluate 3D blood flow in both the proximal right (RCA) and the left (LCA) coronary arteries in healthy volunteers.
Methods
Acquisition: 3D PC measurements (VENC=50 cm/s, undersampling factor = 14, (Δx)3 = (1.2mm)3) were performed in diastole on 29 healthy volunteers (16 females, 59.9±13.1 years) on a 1.5 T MRI system (MAGNETOM Sola, Siemens, Erlangen, Germany) using a research sequence. T2 preparation and fat saturation were used for contrast improvement. Motion effects were mitigated through ECG triggering and navigator-based respiratory gating. Optimum trigger delays were obtained from preceding single-slice cine measurements, ensuring minimum cardiac motion during acquisition. Inter-scan variability was analyzed by repeating the scan in 6 volunteers on a different day. For 30 out of 35 total scan slots, measurements were additionally repeated within the session.Post-Processing: Based on an in-house developed cardiac annotation research tool, we implemented a 3D viewer for blood flow in the coronary arteries, including the calculation of velocities from phase images, eliminating the need for CMPR and pre-processing. The tool was developed in Python based on the visualization toolkit (VTK) package6. Figure 1 shows the processing steps performed using our tool.
Centerline markers are manually placed on magnitude images along the vessels of interest for the computation of segmentation masks, which are then applied to the flow velocity volume.
Our tool also enables quantification of flow velocities. 2D slices of the segmented velocity volumes perpendicular to the centerline are computed. For each slice, the maximum velocity is calculated and plotted against the distance along the centerline.
Results
Data from 28 out of 35 scan sessions could be successfully processed while 7 datasets were excluded due to artefacts and insufficient image quality.An exemplary video of a full rotation of a 3D dataset is given in Figure 2.
Figure 3 shows coronary velocity maximum intensity projections (MIP) (a-d) and maximum flow velocities along the centerlines (e-f) in four exemplary volunteers. Along the LCA, flow velocity peaks shortly downstream the ostium and decreases distally. No general trend is observed for the RCA.
Figure 4 shows MIP images obtained from two scans of volunteers #3 (a,c) and #12 (b,d) and the respective flow velocities (e,f). The scans in (a) and (c) were performed on different days, while the scans in (b) and (d) were acquired within one session. In both cases, qualitative similarities are observed while quantitative differences remain evident.
Inter-scan variability is further evaluated in Figure 5, showing a Bland-Altman analysis of the peak velocities in the proximal arteries (up to 25mm along the centerline) for the LCA (a) and RCA (b). The mean deviations in peak velocities along the LCA and RCA between the first and second scan within the same slot are -0.32±3.71 cm/s and 0.47±2.09 cm/s respectively. Across all volunteers and scans, the mean peak velocities for the LCA and RCA are 15.0±2.9cm/s and 10.0±2.4cm/s. For all volunteers except #7 and #9, #25 and for the re-scan of #8, the peak velocity in the LCA exceeds that of the RCA for both scans.
Discussion
A comprehensive approach taken in the past to measure flow in the coronaries has been 4D Flow. The herewith presented approach of 3D Flow alleviates the main challenge of 4D Flow in the coronaries: their motion. We acquired a single timeframe in diastole where the coronaries are quiescent but also have maximum blood flow.This is, to our knowledge, the first analysis of 3D blood flow in the coronary arteries in over 20 volunteers.
The interplay between physiology (heart rate variation, pulsatile flow, stenoses, …) and scan parameters (trigger delay, acquisition window, sampling pattern, reordering) is expected to have substantial impact on flow quantification and will be studied in the future. Finally, an application in patients with known coronary artery stenosis is warranted.
Conclusion
This study demonstrates the feasibility of 3D flow measurements in the coronary arteries of healthy volunteers. Although technical hurdles remain, a non-invasive measurement of hemodynamic relevance of coronary artery stenoses in the proximal branches seems feasible in the future.Acknowledgements
No acknowledgement found.References
1) Pelc, Norbert J., et al. "Encoding strategies for three‐direction phase‐contrast MR imaging of flow." Journal of Magnetic Resonance Imaging 1.4 (1991): 405-413.
2) Edelman, Robert R., et al. "Flow velocity quantification in human coronary arteries with fast, breath‐hold MR angiography." Journal of Magnetic Resonance Imaging 3.5 (1993): 699-703.
3) Keegan, Jennifer, et al. "Comparison of spiral and FLASH phase velocity mapping, with and without breath‐holding, for the assessment of left and right coronary artery blood flow velocity." Journal of Magnetic Resonance Imaging: An Official Journal of the International Society for Magnetic Resonance in Medicine 19.1 (2004): 40-49.
4) Bedaux, Willemijn LF, et al. "Magnetic resonance imaging versus Doppler guide wire in the assessment of coronary flow reserve in patients with coronary artery disease." Coronary artery disease 13.7 (2002): 365-372.
5) Blanken, Carmen PS, et al. "Coronary Flow Assessment Using Accelerated 4D Flow MRI With Respiratory Motion Correction." Frontiers in Bioengineering and Biotechnology 9 (2021).
6) Schroeder, Will; Martin, Ken; Lorensen, Bill (2006), The Visualization Toolkit (4th ed.), Kitware, ISBN 978-1-930934-19-1Figures
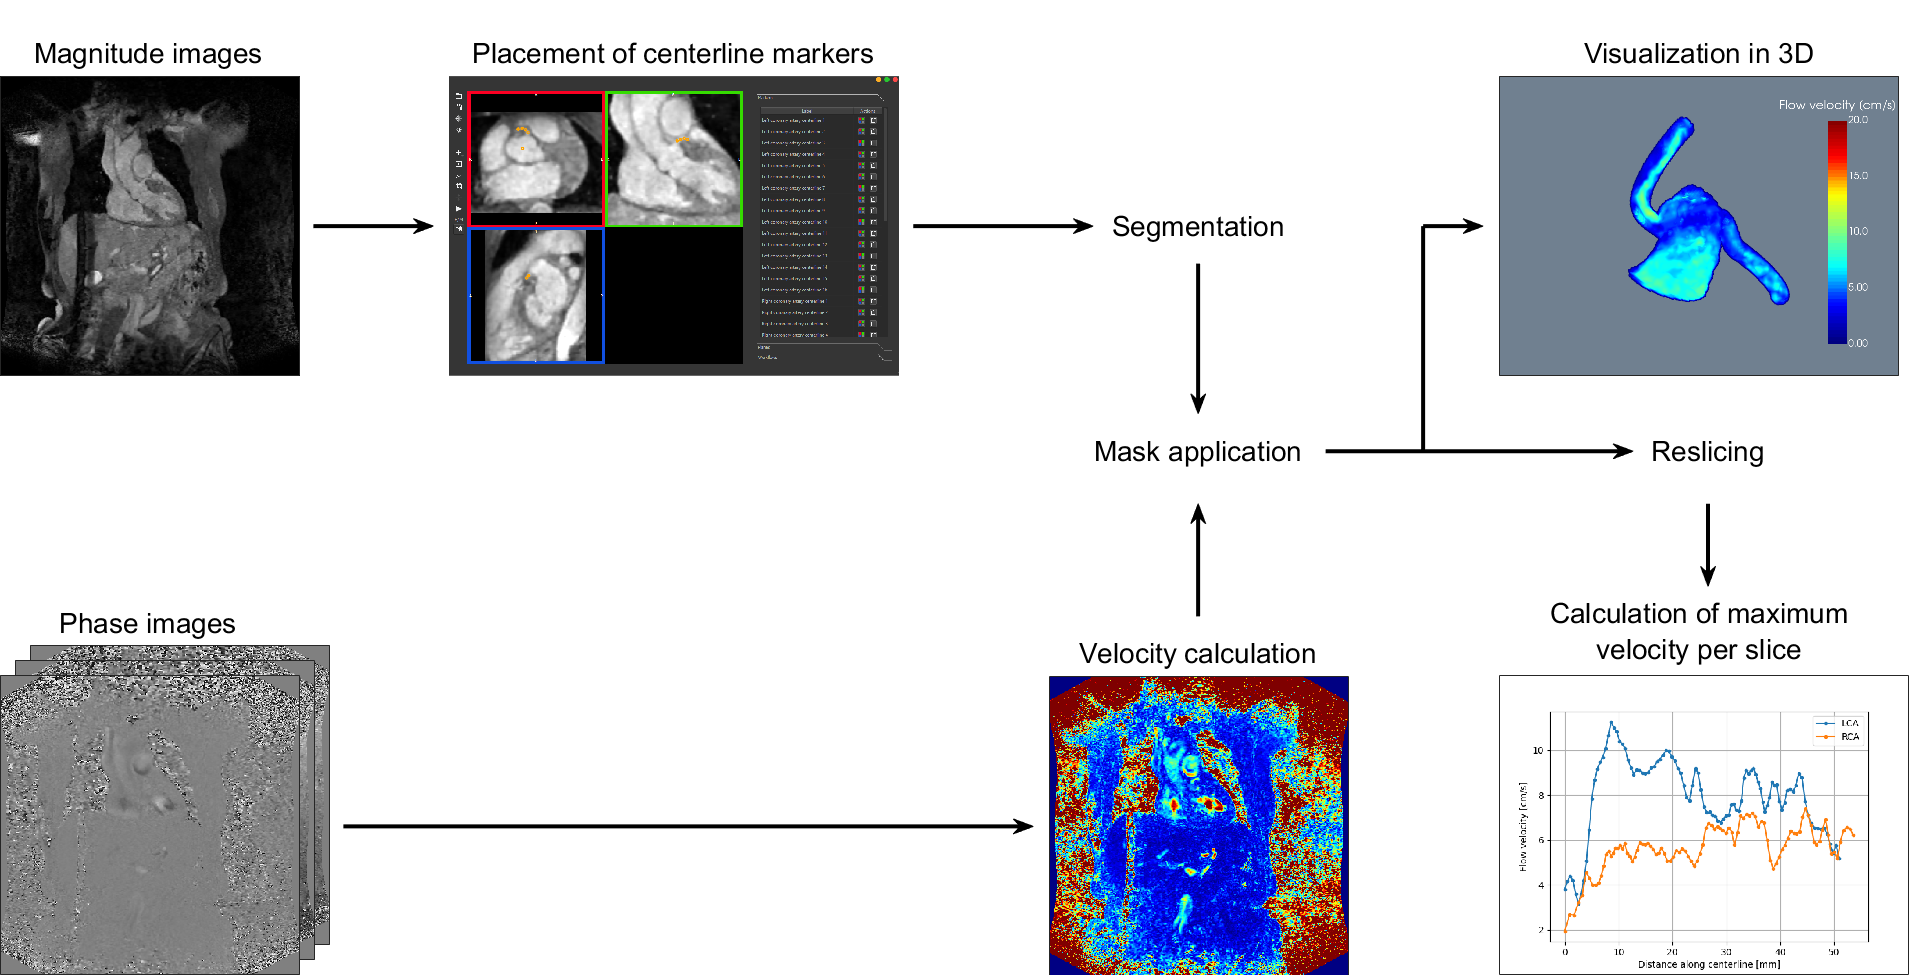
Figure 1
Workflow of the 3D visualization and quantification tool. Centerline markers are manually placed on the magnitude images, followed by segmentation. The segmentation masks are applied to velocity images, which are calculated from the phase images. A maximum intensity projection (MIP) of the result is shown in a 3D viewer. Furthermore, the segmented volume is resliced perpendicular to the centerlines and the maximum velocity values per slice are plotted against the distance along the centerline.
Figure 2
Exemplary demonstration of a 360° rotation of the 3D viewer.
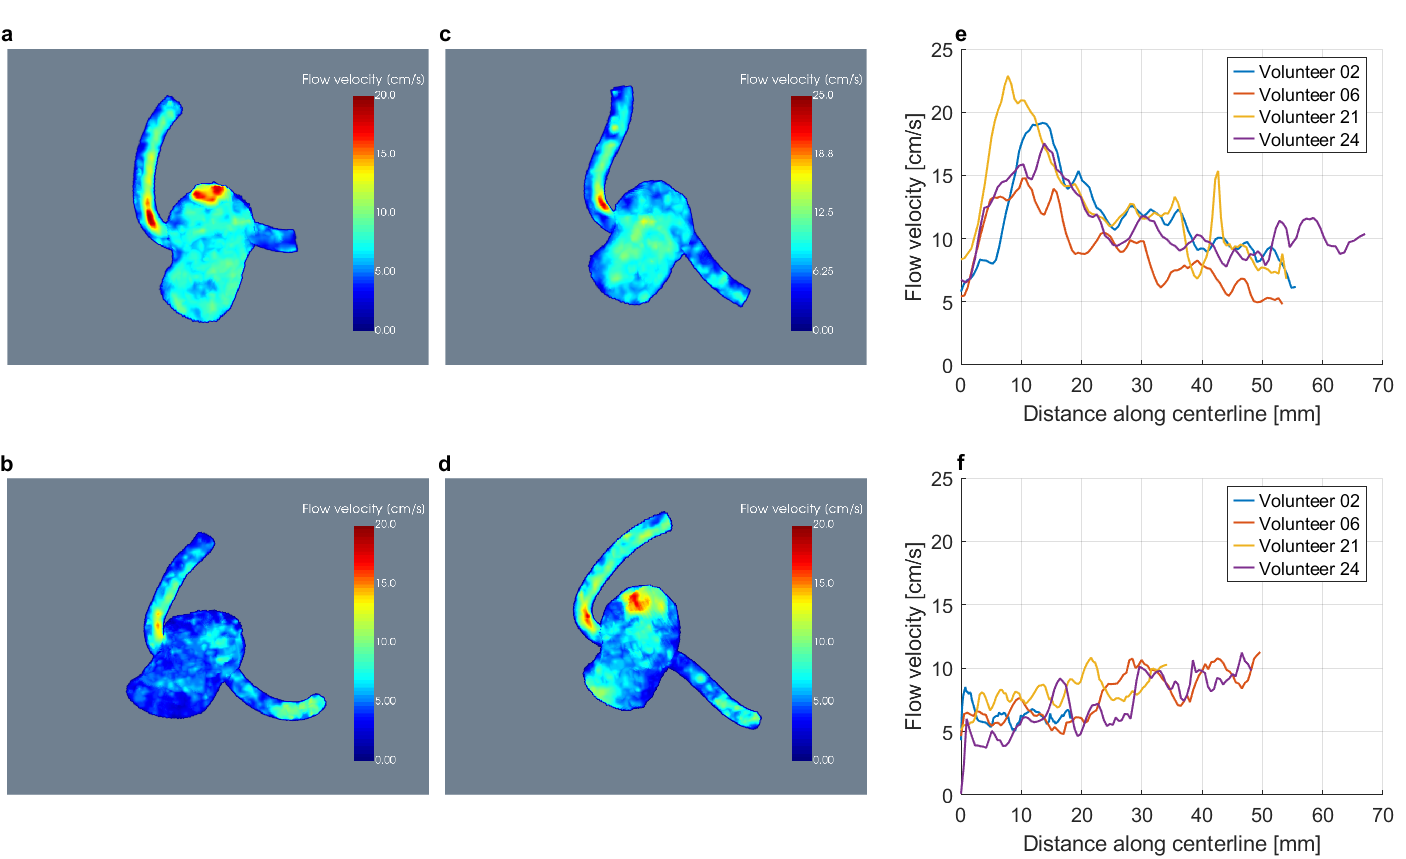
Figure 3
MIP images of volumes of interest containing the coronary arteries for volunteers 2 (a), 6 (b), 21 (c) and 24 (d). The corresponding peak flow velocities per slice perpendicular to the respective centerline plotted against the distance along the centerline are shown for the LCA (e) and RCA (f).
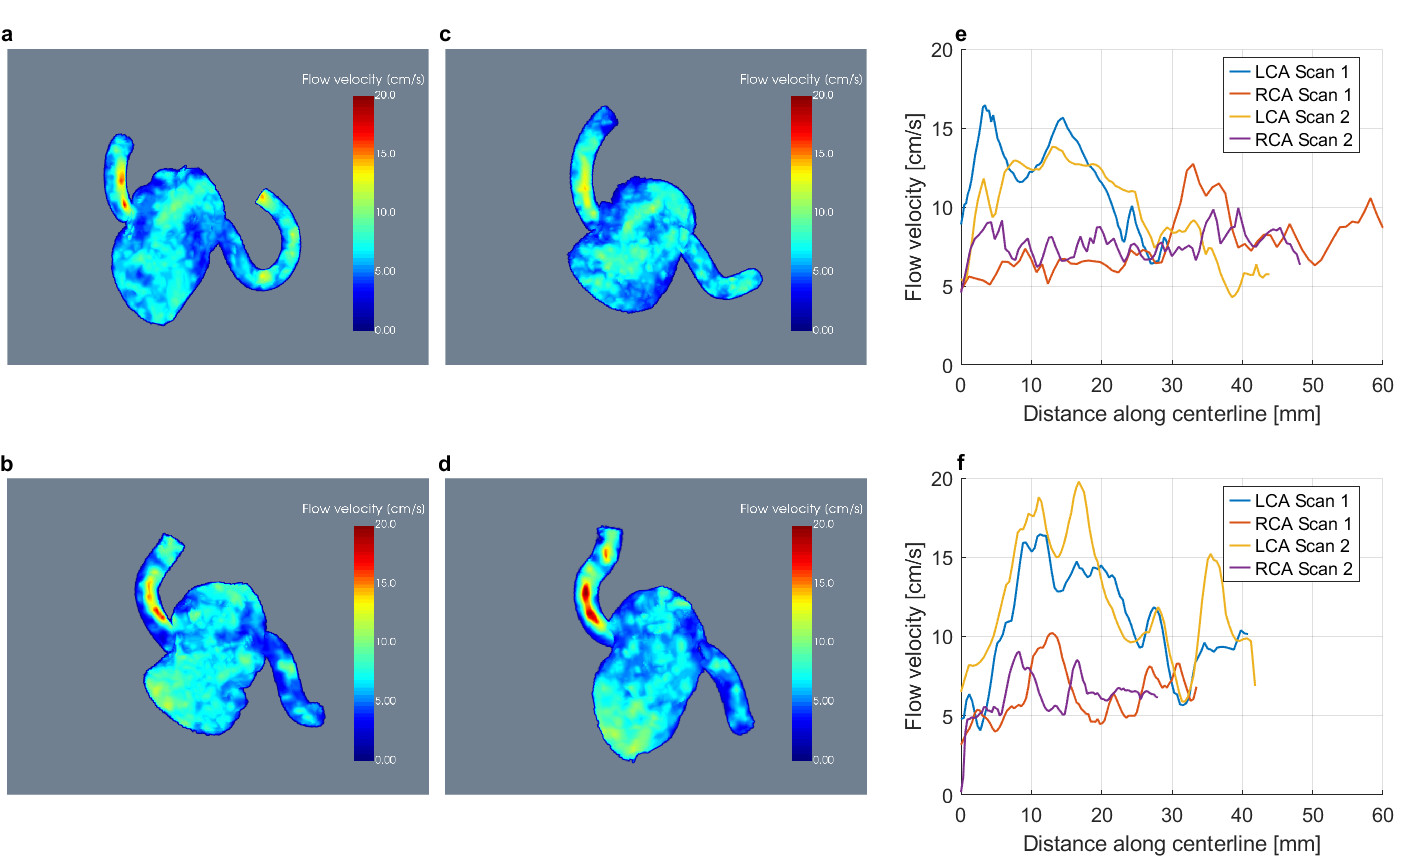
Figure 4
MIP images of volumes of interest containing the coronary arteries for volunteers 3 (a,c) and 12 (b,d). The corresponding peak flow velocities along the centerline are given in (e) and (f) respectively. The data shown in (a) and (c) was acquired on different days, whereas the measurements presented in (b) and (d) were performed within one session.
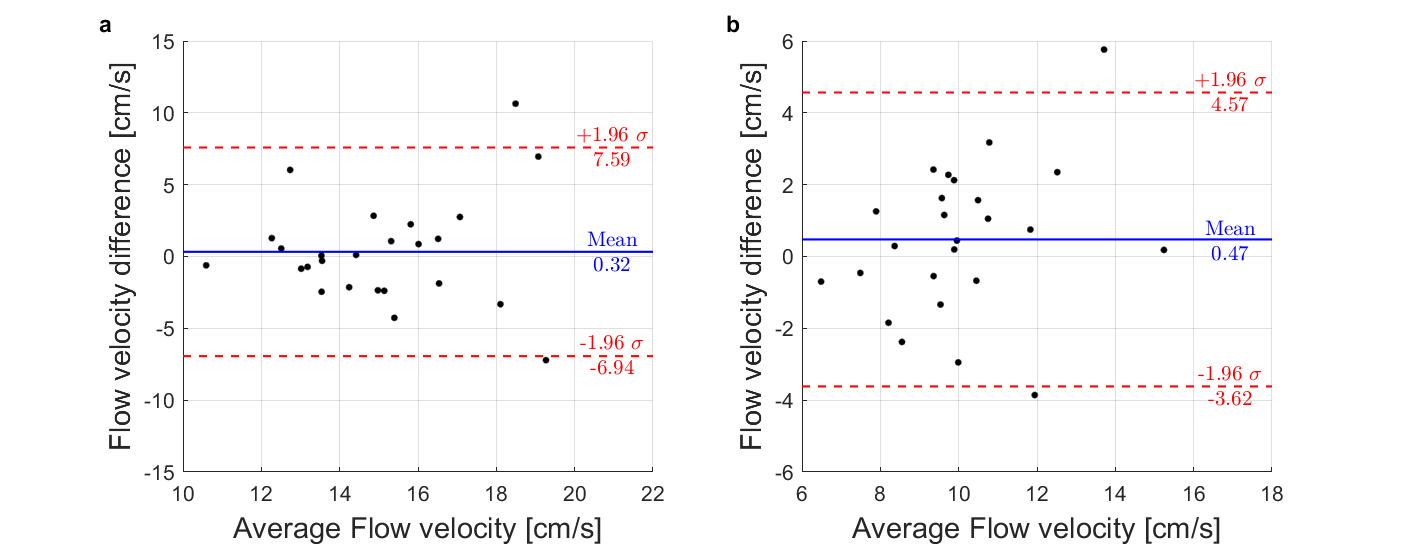
Figure 5
Bland-Altman plots analyzing the repeatability within the same session. The difference in flow velocities is plotted against the mean for the LCA (a) and the RCA (b). The mean difference is indicated by the blue lines. The standard deviation of the differences is shown by the red lines.