3817
Assessment of the relationship between APTw values and R2* and PDFF values in renal tumor1Department of Radiology, Xi'an GaoXin Hospital, Xi'an, China, 2Philips Healthcare, Beijing, China
Synopsis
Keywords: Kidney, CEST & MT
Renal tumors are often containing lipid components, ischemic-hypoxia and hemorrhage. These components can be reflected by the proton density fat fraction (PDFF) and R2* levels of the mDIXON_Quant. Amide proton transfer-weighted (APTw) imaging has made breakthroughs in tumor research, however, its signal intensity is affected by many factors. This study focused on the effect of PDFF and R2* values on APTw values in renal tumors. The preliminary results showed that renal tumor APT values were correlated with PDFF and R2* values. Thus, precision APTw imaging studies of renal tumors need to consider the effects of differential composition.Introduction
Renal tumors are often complex in composition, containing lipid components, ischemic-hypoxia and hemorrhage [1]. These components can be reflected by the proton density fat fraction (PDFF) and R2* levels of the mDIXON_Quant sequence, and there are differences in the levels of both in different types of tumors [2,3]. Amide proton transfer-weighted (APTw) imaging has mainly focused on individual systemic tumors, its signal intensity is affected by many factors, especially in the middle and upper abdomen. Respiratory motion, intestinal gas, and feces can significantly affect the quality of APT imaging of the middle and upper abdominal organs, which different from the cranial APTw imaging environment. Our team has successfully achieved the possibility of APTw imaging of renal tumors using intermittent breath- hold respiratory (IBH) compensation [4], and this study aims to further analyze the effect of renal tumor components on APTw values and lay the foundation for accurate APTw imaging studies of renal tumors.Method
Retrospectively collected 14 patients (6 males and 8 females, age 11-69 years, mean 47.71±15.92 years) with complete clinical data and excellent MRI images of renal tumors from November 2021 to October 2022, of which 9 cases of Renal clear cell carcinoma (RCCC) and 1 case of renal angiomyolipoma (RAML) were pathologically confirmed, and other 4 RAML diagnosed by MR imaging. All MR images were obtained on a 3.0 T MR scanner (Ingenia CX, Philips Healthcare) using a 32-channel phased- array abdominal coil. Routine clinical imaging, including axial T1WI and T2WI, and coronal T2WI sequences. Then axial and coronal 3D-APTw, and axial mDIXON-Quant sequences were scanned (Table 1). 3D APTw imaging selected the largest level of the affected renal tumor for 3-layer imaging, and the other sequences covered both kidneys. The quality of APTw images was evaluated by 2 senior radiologists, and the tumor maximum cross-sectional APTw, PDFF, and R2* values were measured by selecting the image excellent orientation and level. Spearman correlation analysis was used to analyze the relationship between the APTw and PDFF values, the APTw and R2* values of the tumor tissue.Result
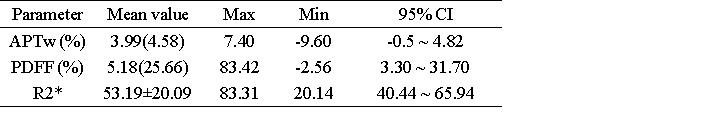
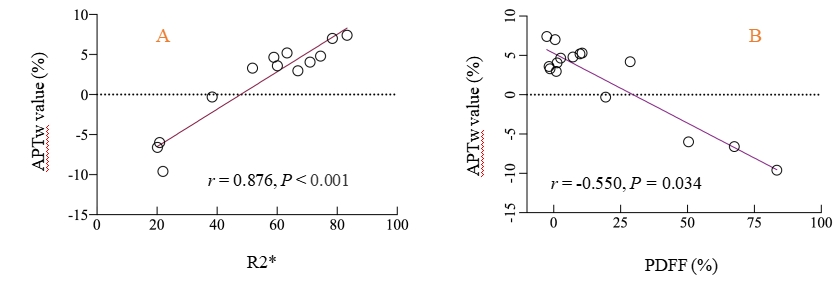
Maximum cross-sectional measurements of 14 renal tumors showed (Table 2), APTw value 95% CI: -0.5 ~ 4.82, PDFF values 95% CI :3.30 ~ 31.70%, and R2* value 95% CI: 40.44 ~ 65.94. Correlation analysis showed, renal tumor APTw values were moderately negatively correlated with PDFF values (r=0.550, P=0.034) (Fig.1A), and were significantly positively correlated with R2* values (r=0.876, P< 0.001) (Fig.1B).Discussion
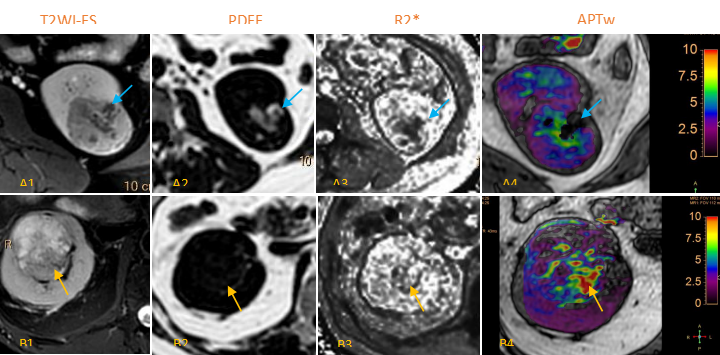
APTw imaging has shown great potential in the preliminary exploration stage of abdominal research, its stability and influencing factors need to be further explored. Although spectral presaturation with inversion recovery (SPIR) used to suppress the effect of adipose tissue and 3D-mDIXON used to correct inhomogeneous in the B0 field in brain [5]. However, complex abdominal imaging environment different from in brain. We found that different PDFF and R2 * level in renal tumor tissue have a significant impact on APTw values (Fig. 2). The tumor APTw values were moderately negatively correlated with PDFF values and significantly positively correlated with R2* values. Thus, precision APTw imaging studies of renal tumors need to consider the effects of differential composition within the measurement region.Conclusions
The preliminary results of this study show that the PDFF value and R2 * value of renal tumor tissue may affect the APTw values of tumor tissue.Acknowledgements
No acknowledgement found.References
[1] Du W, Zhang L, Brett-Morris A, et al. HIF drives lipid deposition and cancer in ccRCC via repression of fatty acid metabolism[J]. Nature Communications, 2017, 8 (1):1-12
[2] Notohamiprodjo M, Staehler M, Steiner N, et al. Combined diffusion-weighted, blood oxygen level-dependent, and dynamic contrast-enhanced MRI for characterization and differentiation of renal cell carcinoma. Acad Radiol, 2013, 20(6): 685-693
[3] Min JH, Kim CK, Park BK, et al. Assessment of renal lesions with blood oxygenation level- dependent MRI at 3 T: preliminary experience. aJR Am J Roentgenol 2011; 197:489-494
[4] Wang X, Bu CQ, Tian G, et al. Application of APTw imaging in prediction of clear cell renal cell carcinoma. Proc. Iintl. Soc. Mag. Reson. Med. 30(2022)
[5] Togao O, Keupp J, Hiwatashi A, et al. Amide proton transfer imaging of brain tumors using a self-corrected 3D fast spin-echo Dixon method: comparison with separate B0 correction. magn Reson Med, 2017,77:2272-2279
Figures
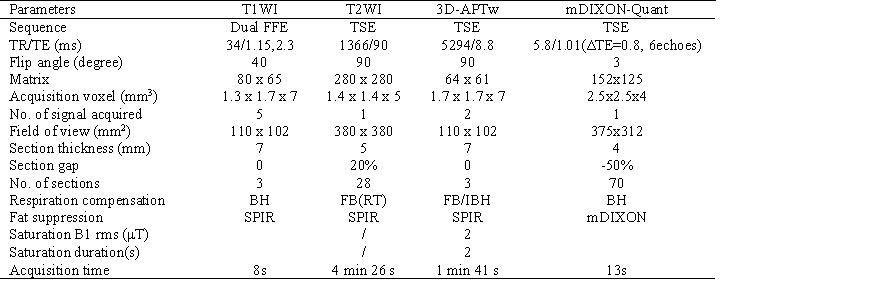
Table 1. MRI pulse sequences and parameters.(FFE: fast field echo; TSE: turbo spin echo; FB: free breathing; BH: breath-hold; IBH: intermittent breath-hold; RT: respiratory triggering).