3815
Preliminary exploration of the influence of demographic characteristics on 3D-APTw imaging of right normal kidney1Department of Radiology, Xi'an GaoXin Hospital, Xi'an Jiao Tong University, Xi'an, Shaanxi, China;, Xi'an, China, 2Philips Healthcare, Beijing, China
Synopsis
Keywords: Kidney, CEST & MT
APTw imaging is able to detect free protein and peptide molecules in cells non-invasively. The aim of this study was to investigate the influence of age, gender and BMI on the APT values of right normal kidney. The results showed that there was a low correlation of APT values and age or BMI; and the male mean APT values was lower than that in female. The influence of age, gender and BMI factors should be taken into account in scientific research and clinical application of renal APTw imaging.Introduction
Amide proton transfer-weighted (APTw) imaging can detect free protein and peptide molecules inside cells non-invasively, indirectly reflecting the metabolic changes and physiopathological information inside living cells [1]. The studies of APTw imaging previously focused on cerebral diseases. The application in the kidney is still in the preliminary exploration stage, due to the respiratory motion artifacts and B0inhomogeneity.Preliminary studies have found that APTw imaging is highly promising in terms of diagnostic efficacy for chronic kidney disease and renal tumors [2, 3], but lack of normal population research. In this study, on the basisof previous research, we further explored the influence of age, gender and BMI on the APT values of right normal kidney.Method
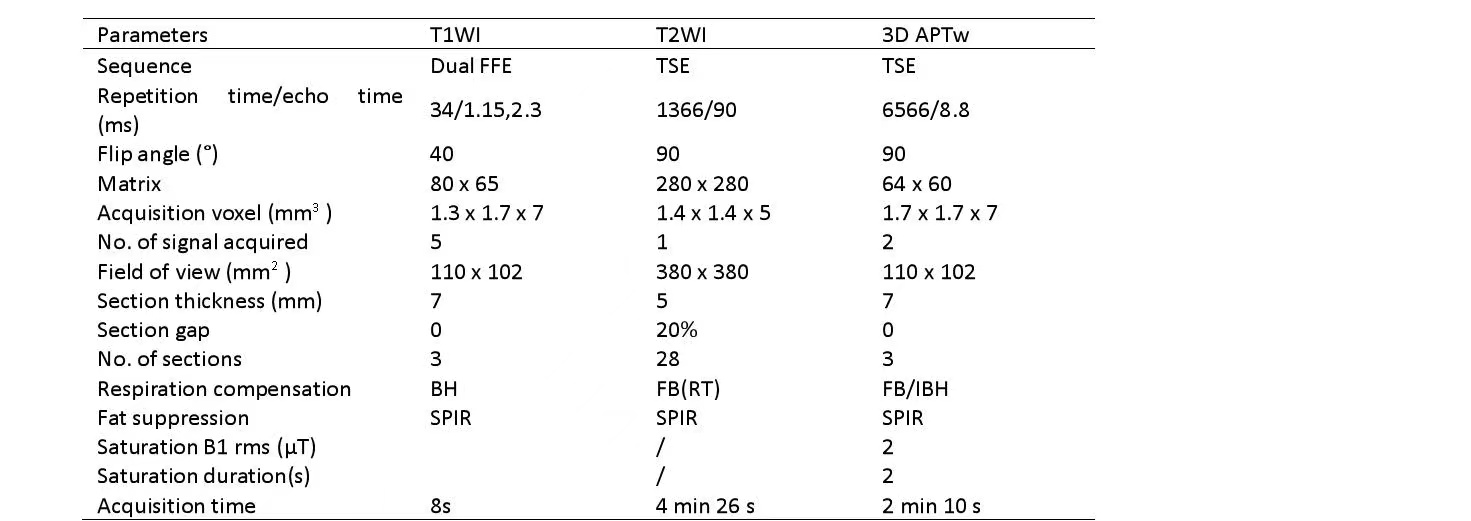
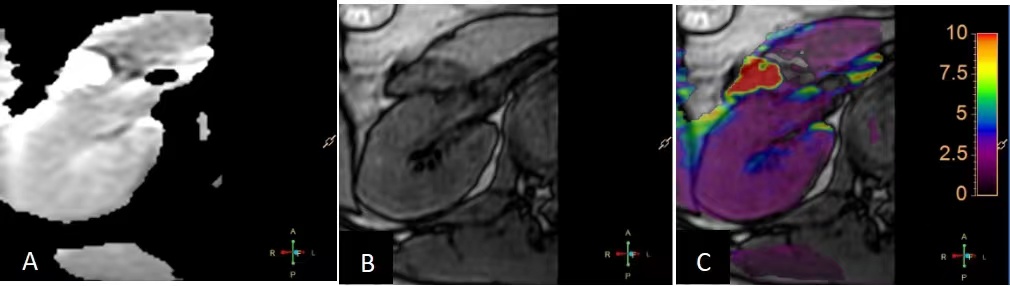
One hundred and eighty-two healthy volunteers from September 2021 to February 2022 were enrolled for intermittent breath-hold right kidney axial 3D APTw imaging using Philips 3.0T Ingenia CX. The specific imaging parameters are shown in Table 1. The scores of APTw images with more than 2points by the 5-Likert scale were considered successful images and were used to measure APT values. A circular region of interest (ROI) with an area of 0.2 to 0.4 cm2 was used to measure APT values, and the ROI placement area included approximately 1/2 of the renal cortex and 1/2 of the medulla. Spearman's correlation coefficient was used to analyze the correlation between right kidney APT values and age or BMI. One-way variance (ANVOA) and Bonferroni were used to analyze the differences of APT values among different groups of age and BMI. Mann-Whitney U test was used to analyze the differences of APT values between males and females.Result
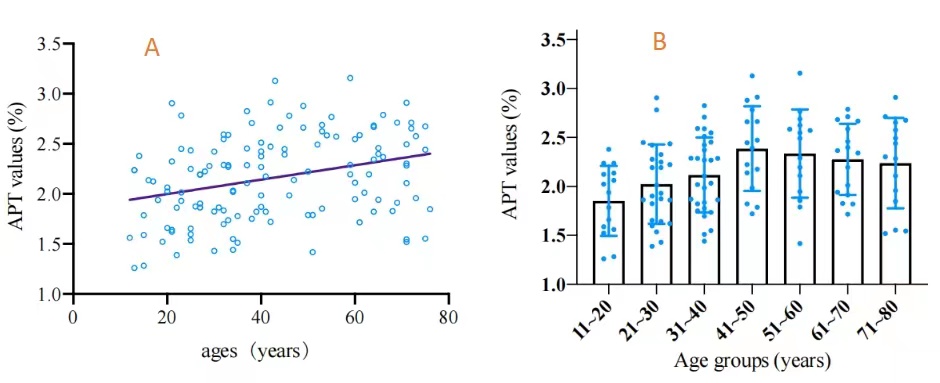
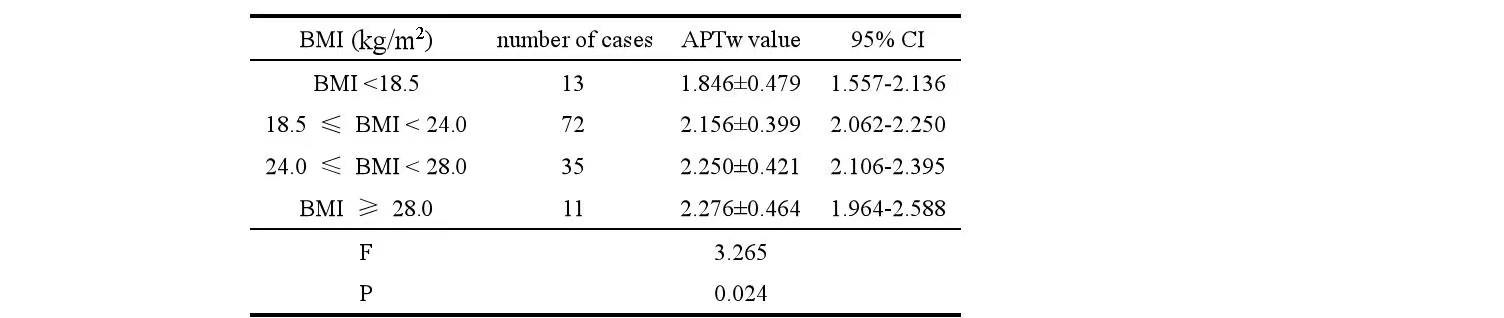
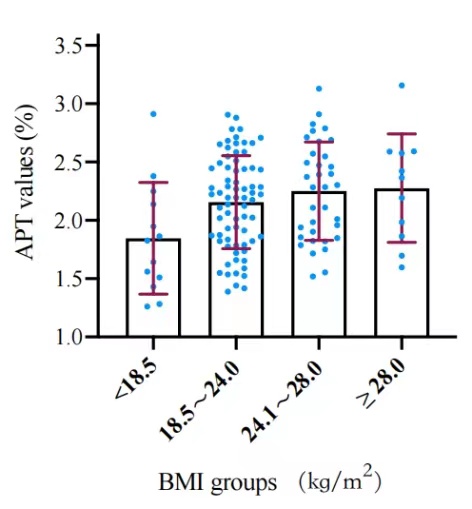
One hundred and thirty-one cases of right normal kidney of APTw images were eventually successful images. APT values were weakly correlated with age (r=0.325, P=0.000) (Fig.2A), APT values after the 41-50 years age group showed a decreasing trend with increasing age group(Fig.2B), but were not statistically different,. and there was statistically significant among different groups (F=3.566, P=0.003). Within-group analysis revealed that the APT values of 11-20 years vs. 41-50 years or 51-60 years had statistically significant. The mean APT values of males was 2.052±0.359%, lower than that of females [2.284 (2.586,1.825)%] (P = 0.021). The APT values of right normal kidney had a very weak positive correlation with BMI (r = 0.181, P = 0.039). APT values were statistically different between BMI groups (P = 0.024)(Table 2).Within-group analysis showed that the APT values of BMI <18.5 kg/m2 were lower than 24.0 kg/m2≤BMI<28.0 kg/m2(P = 0.021)(Fig.3).Discussion
There was a correlation between right kidney APT values and age and BMI, and right kidney APT values showed a gradual decrease with increasing age group after the age group of 41-50 years. It is hypothesized that a decrease or increase in renal blood flow may cause a decrease or increase in protein in renal micro perfusion blood flow [4, 5, 6], which in turn causes a decrease or increase in APT values. Also the decrease in the number of renal glomeruli may be one of the reasons for the decrease in APT values with increasing age group after the age group of 41-50 years; the renal APT values were smaller in men than in women in this study. It is hypothesized that estrogen has a delaying effect on kidney aging and may be one of the reasons for the lower renal APT values in men compared to women.Conclusion
The influence of age, gender and BMI factors on the APT values of normal right kidney should be taken into account in clinical studies and diagnosis.Acknowledgements
We sincerely thank the participants in this study.References
[1]Schmidt H, Schwenzer NF, Gatidis S, et al. Systematic Evaluation of Amide Proton Chemical Exchange Saturation Transfer at 3 T: Effects of Protein Concentration, pH, and Acquisition Parameters[J]. Invest Radiol.2016,51(10):635-46.
[2] Ju Y, Liu A, Wang Y, et al. Amide proton transfer magnetic resonance imaging to evaluate renal impairment in patients with chronic kidney disease [J]. Magn Reson Imaging.2022,87:177-182.
[3] Jia X, Wang W, Liang J, et al. Risk stratification of abdominal tumors in children with amide proton transfer imaging [J]. Eur Radiol.2022, 32(4):2158-2167.
[4] Chen Y, Wang X, Su T, et al. Feasibility evaluation of amide proton transfer-weighted imaging in the parotid glands: a strategy to recognize artifacts and measure APT value[J]. Quant Imaging Med Surg.2021,11(6):2279-2291.
[5] Chen SZ, Yuan J, Deng M, et al. Chemical exchange saturation transfer (CEST) MR technique for in-vivo liver imaging at 3.0 tesla [J]. Eur Radiol. 2016,26(6):1792-1800.
[6] Yoshikawa T, Kawamitsu H, Mitchell DG, et a1. ADC measurement of Abdominal organs and lesions using parallel imaging technique [J]. AJR Am J Roentgenol.2006, 187(6):1521-1530.
Figures