3814
The feasibility of amide proton transfer imaging at 3T for renal masses: a preliminary study1Tongji Hospital, School of Medicine, Tongji University, Shanghai, China, 2Philips Healthcare, Shanghai, China
Synopsis
Keywords: Kidney, CEST & MT, amide proton transfer,RCC
This study aims to assess the feasibility of amide proton transfer-weighted (APTw) imaging in depicting renal lesions and its ability to differentiate malignant from benign tumors. The results show that APTw can be used to discriminate renal tumors from normal kidney tissues, as well as to identify benign and malignant renal tumors. However, the technique still needs to be improved to reduce artifacts.introduction
Modern imaging plays a key role in the identification of benign and malignant renal lesions and in the selection of an appropriate surgical strategy. However, the differentiation of benign and malignant lesions, tumor grading and prognostic prediction based on functional MRI remain challenging due to low interobserver agreement and suboptimal diagnostic accuracy and specificity. APTw is a molecular MRI technique that generates image contrast based on endogenous mobile cellular proteins and peptides in tissues1. Applications of APTw imaging in the head, neck, pelvis, and other anatomical regions have been reported 2-4. In this study, we investigated the feasibility of APTw imaging in renal lesions in terms of image quality and evaluated its ability to differentiate between lesions and normal tissues.Methods
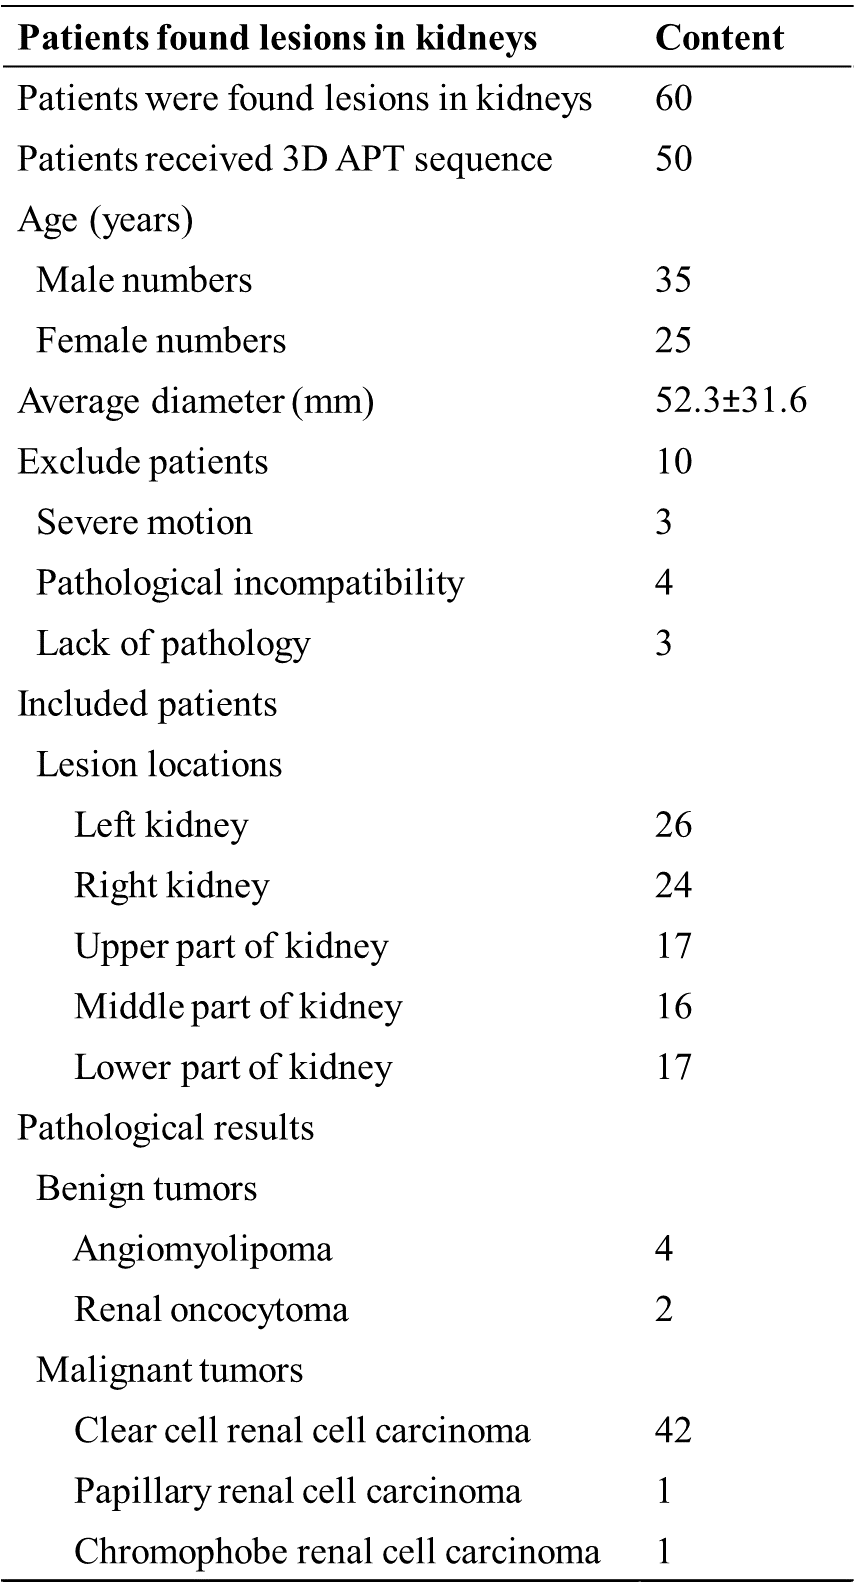
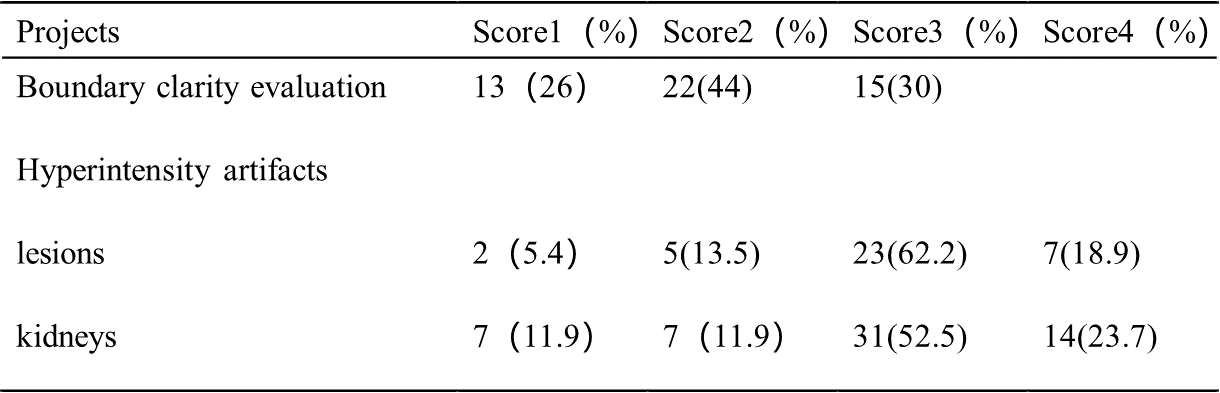
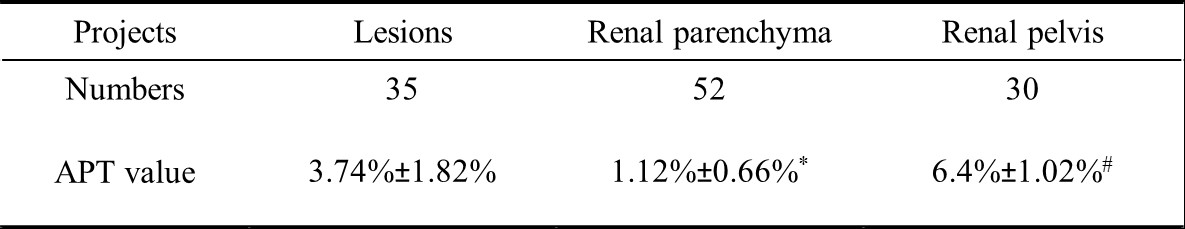
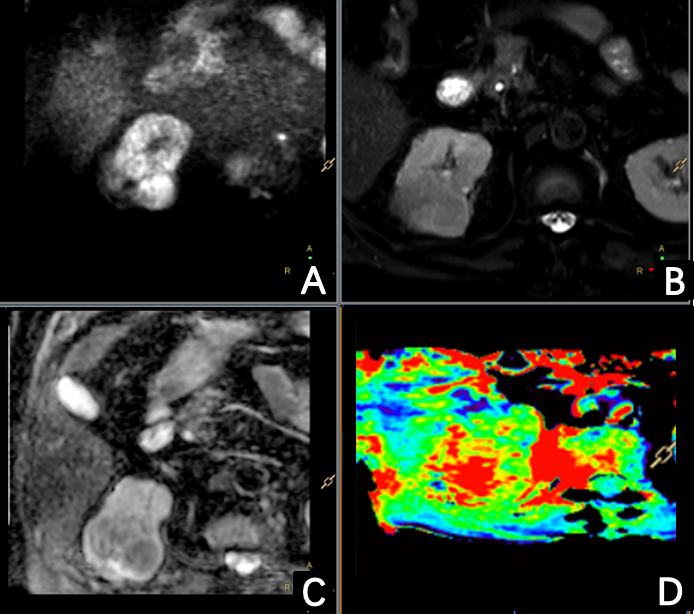
Patients with renal lesions received APTw imaging on a 3.0T scanner (Ingenia, Philips Healthcare, Best, the Netherlands). The imagine parameters were: 3D turbo spin echo (TSE) acquisition, field-of-view = 230 × 298 × 60 mm3, voxel size = 1.8 × 2 × 6 mm3, parallel imaging factor = 1.6, TSE factor = 174, fat suppression = SPIR, saturation B1 rms = 2 uT, saturation duration = 2 seconds. Totally 9 saturation frequencies were acquired (+3.5 ppm for 3 times, -3.5 ppm, ±4.3 ppm, ±2.7 ppm, -1560 ppm). For +3.5 ppm acquisitions, an mDixon-based acquisition scheme was used to get B0 map. And this B0 map was used to correct for off-resonance effects. APTw image was defined as the asymmetry ratio at 3.5 ppm: MTRasym(3.5 ppm) = [Ssat(-3.5 ppm) – Ssat(+3.5 ppm)]/S0, where Ssat represents the acquired signal intensity. The APTw images were generated online and transferred to IntelliSpace Portal (v9, Philips Healthcare, Best, the Netherlands) for analysis. Two radiologists, who were blinded to the clinical data, independently evaluated the APTw images. The image quality was scored using 3-point Likert scales (1=poor, 3=excellent) for lesions’ boundary clarity5 and 4-point Likert scales (1=poor, 4=excellent) for hyperintensity artifacts6. Evaluable images (boundary clarity >1 and hyperintensity artifacts score >1) were then enrolled for APTw value comparison between lesions and normal tissues. The intraclass correlation coefficient (ICC) was calculated using SPSS (v26, IBM Corp, Armonk, NY, USA) to assess the agreement of the measurements between two observers. Descriptive statistics (mean ± standard deviation) were used to summarize all variables. APT values were compared between tumor lesions and renal parenchyma and between renal parenchyma and renal pelvis using the t-test. p values less than 0.05 were considered statistically significant.Results
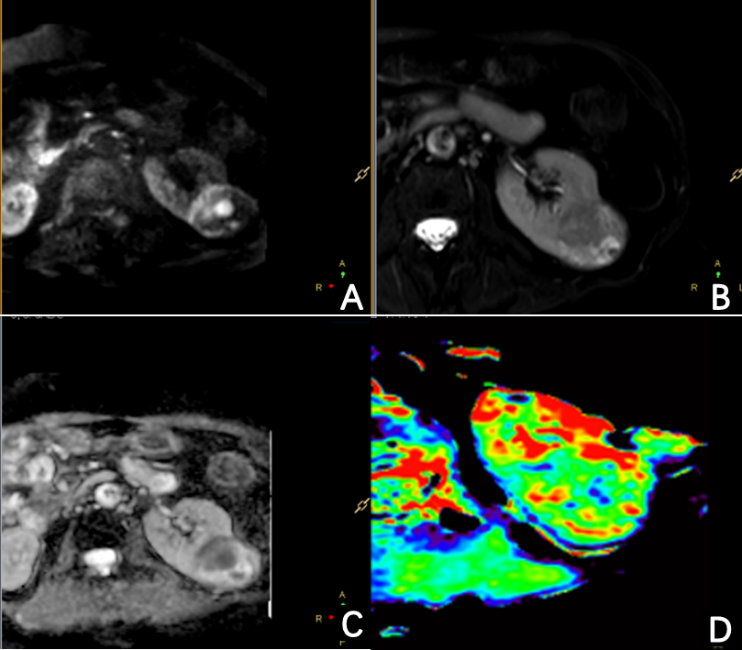
A total of 50 lesions and 59 normal kidneys were analyzed. Among the 50 lesions, 6 were benign and 44 were malignant. In the assessment of lesions’ boundary clarity, 15 of the 50 lesions were considered a score of 3 and 13 lesions were considered a score of 1. After excluding 13 cases with a clarity of 1 point, 37 lesions and 59 normal renal were evaluated again for hyperintensity artifacts. Renal lesions were scored as 1, 2, 3, and 4 in 5.4%, 13.5%, 62.2%, and 18.9% cases, respectively; Normal kidneys were scored as 1, 2, 3, and 4 in 11.9%, 11.9%, 52.5%, and 23.7% cases, respectively (Table 2). (Figure 1-2) The intra-group correlation between two independent readers on the clarity of the lesion boundary and the score of hyperintensity artifacts was greater than 0.9. After removing images with a boundary clarity and hyperintensity artifacts score of 1, the mean APTw values were 3.74%±1.82% and 1.12%±0.66% for the 35 renal lesions and 52 renal parenchymas, respectively. Among them, total of 30 cases of renal pelvis included. The renal pelvis tended to show hyperintensity, with an average APTw of 6.4% ± 1.02%, which was significantly different from renal parenchyma (P<0.001). There was a significant difference in APTw values between renal lesions and normal renal parenchyma (P<0.001). (Table 3) There was also a significant difference in APTw values between benign and malignant lesions (P<0.001). The APTw measurements of lesions were consistent between the two observers (ICC>0.75).Discussion
In this study, the renal pelvis and renal arteries and veins showed high signal in normal kidneys. This phenomenon is mainly caused by the fluid and a dedicated fluid-suppression technique could be used in the future research7. Severe B0 inhomogeneity, respiratory motion, and magnetic sensitivity artifacts due to adjacent air-containing structures (e.g., intestine) may affect image quality, too. Further research to overcome these effects will ensure improved success of APT imaging in clinical practice. APT values in renal lesions are higher than in normal renal parenchyma. There was a significant difference in APTw values between benign and malignant lesions, which was largely consistent with previous studies.Conclusion
APT imaging can be used as an imaging biomarker for kidney lesions. However, further technical improvements are needed to optimize APT imaging protocols before APT imaging can be applied to renal MRI.Acknowledgements
No acknowledgement found.References
1.Zhou J, Payen JF, Wilson DA, et al. Using the amide proton signals of intracellular proteins and peptides to detect pH effects in MRI.Nature medicine.2003,9(8):1085-90.
2.Togao O, Yoshiura T, Keupp J, et al. Amide proton transfer imaging of adult diffuse gliomas: correlation with histopathological grades.Neuro-oncology.2014,16(3):441-8.
3.Ohno Y, Yui M, Koyama H, et al. Chemical Exchange Saturation Transfer MR Imaging: Preliminary Results for Differentiation of Malignant and Benign Thoracic Lesions.Radiology.2016,279(2):578-89.
4.Takayama Y, Nishie A, Sugimoto M, et al. Amide proton transfer (APT) magnetic resonance imaging of prostate cancer: comparison with Gleason scores.Magma (New York, NY).2016,29(4):671-9.
5.Wang HJ, Cai Q, Huang YP, et al. Amide Proton Transfer-weighted MRI in Predicting Histologic Grade of Bladder Cancer.Radiology.2022,305(1):127-34.
6.Chen Y, Wang X, Su T, et al. Feasibility evaluation of amide proton transfer-weighted imaging in the parotid glands: a strategy to recognize artifacts and measure APT value.Quant Imaging Med Surg.2021,11(6):2279-91.
7.Keupp, Jochen, and Osamu Togao. Magnetization transfer ratio based metric for APTw or CESTw MRI suppressing signal from fluid compartments-initial application to glioblastoma assessment. Proc 26th Annual Meeting ISMRM. Vol. 3156. 2018.
Figures