3812
Assessment of renal lipid deposition and abnormal oxygen metabolism of type 2 diabetes mellitus based on mDixon-Quant
Chun Yang1,2, Yishi Wang3, Wei Li1, and Yuxin Wang1,2
1The First Affiliated Hospital of Shandong First Medical University & Shandong Provincial Qianfoshan Hospital, Jinan, China, 2Shandong First Medical University, Jinan, China, 3Philips Healthcare, Beijing, China
1The First Affiliated Hospital of Shandong First Medical University & Shandong Provincial Qianfoshan Hospital, Jinan, China, 2Shandong First Medical University, Jinan, China, 3Philips Healthcare, Beijing, China
Synopsis
Keywords: Kidney, Endocrine, mDixon-Quant, type 2 diabetes mellitus, renal function
mDixon-Quant adopts a multi-echo 3D fast GRE sequence that can be used to obtain fat fraction, T2* and R2* mapping in a single breath hold. The variation of deoxyhemoglobin in the kidney can reflect the oxygen metabolism in patients with diabetic nephropathy under pathological and physiological conditions. FF maps can be used for fat quantification. mDixon-Quant provides the assessment both fat metabolism and oxygen metabolism of the kidney at the same time and may be valuable in detecting changes in renal function and pathology.Summary of main findings
Our study showed that mDixon-Quant can monitor fat metabolism and oxygen metabolism of the kidney simultaneously for type 2 diabetes mellitus by measuring FF and R2* values. The mDixon-Quant sequence can provide clinical value for early identification and progress assessment of diabetic nephropathy.Introduction
Diabetes nephropathy (DN) is a microvascular complication of diabetes and the main cause of end-stage renal failure1. Glucose metabolism disorders are also accompanied by abnormal lipid metabolism. Urinary microalbumin and eGFR are the main modalities for early diagnosis of DN, but many physiological factors can affect their accuracy2. Renal puncture biopsy is the gold standard for the diagnosis of DN. However, on account of its invasiveness, it cannot be used as a routine test3,4. For patients who already have renal injury, contrast agents can significantly reduce the oxygen content of the kidneys in DN and aggravate renal injury5.mDixon-Quant is a modified Dixon method that can provide water-only, fat-only, in-phase, opposite-phase, fat fraction (FF), T2* and R2* images using 3D acquisition within one single breath-hold. The aim of our study was to investigate whether mDixon-Quant can monitor fat metabolism and oxygen metabolism of the kidney at the same time.
Materials and methods
PatientsForty consecutive diabetic patients and twenty healthy volunteers were recruited for participation in our study.
MR Imaging
All MR examinations were performed on a 3.0 T MRI system (Ingenia CX, Philips, Best, the Netherlands). The following images were obtained: coronal T2- weighted images using turbo spin-echo sequence (TSE) and mDixon Quant.
Image analysis
T2WI was used as an anatomical reference to distinguish renal cortex and renal medulla. Carefully avoiding the collecting system, artifacts and vascular, on the coronal sections near the renal hilum, the regions of interest (ROIs) were manually positioned at the upper, middle and lower poles of each kidney on the FF and R2* maps. Three slices were measured for each kidney. Fig. 1 shows representative examples of ROIs of the bilateral kidneys, including the FF, R2* maps and T2W image. Statistical analyses were performed using SPSS (version 26 for Windows, IBM) and MedCalc software (version 20.0, Ostend, Belgium). P<0.05 was considered statistically significant.
Results
Renal parenchymal FF and R2* values were significantly different between the three groups with healthy controls < DM < DN (all P≤0.01) (Figure 2). With the progress of diabetes, the FF and R2* values presented an increasing trend. Correlation of MRI parameters with biochemical parameters were shown in Table 1. For DM and DN patients, a positive correlation was found between the FF values and ACR (cortex, r=0.538; medulla, r=0.468), microalbuminuria (cortex, r=0.434; medulla, r=381), as well as a negative correlation between the FF values and HbA1C (cortex, r=367)(all P<0.001). Moreover, a positive correlation was found between the R2* values and ACR(cortex, r=0.536; medulla, r=761), microalbuminuria(cortex, r=0.605; medulla, r=0.739), Cystatin C(cortex, r=0.506; medulla, r=0.620), β2 Microglobulin (cortex, r=0.481; medulla, r=0.647), as well as a negative correlation between R2* values and eGFR(cortex, r=-0.384; medulla, r=-0.522) (all P<0.001). ROC curves of MRI parameters for discriminating the three groups were presented in Fig. 3, and the corresponding diagnostic characteristics are shown in Table 2. The R2* value of the medulla achieved the largest AUC of 0. 947 with a sensitivity of 95% and a specificity of 90% (cutoff = 22.473), which made it the best parameter for discrimination of DM from DN. Comparing with the result of FF values, R2* value of the renal cortex showed the highest AUC value for discriminating DM from controls and R2* value of the renal cortex showed the highest AUC value for discriminating DM from DN.Discussion and Conclusion
In our study, we demonstrated the feasibility of non-invasive quantification assessment of renal lipid deposition and abnormal oxygen metabolism in patients with type 2 diabetes mellitus. The increase in the lipid content of renal cortex and medulla occurs in the diabetic without any complications and the increase of renal lipid content is more obvious when accompanying diabetic nephropathy. The R2* values of medulla manifested the highest correlation with ACR. Moreover, R2* value possibly can serve as a more sensitive biomarker for discriminating DM from controls and DM from DM than the FF values. These suggested that the mDixon-Quant technique may be a promising functional imaging tool to monitor the alteration of renal lipid and oxygen for diabetes mellitus to reflect the progress of renal function. The mDixon-Quant sequence can provide clinical value for assessing diabetic nephropathy.Acknowledgements
No acknowledgement foundReferences
1. Tuttle KR, Bakris GL, Bilous RW, et al. Diabetic Kidney Disease: A Report From an ADA Consensus Conference. Diabetes Care 2014;37(10):2864-2883.2. Sulaiman MK. Diabetic nephropathy: recent advances in pathophysiology and challenges in dietary management. Diabetol Metab Syndr 2019;11:7.
3. Simunov B, Gunjaca M, Cingel B, Skegro D, Knotek M. Safety of Outpatient Kidney Biopsies. Nephron 2018;138(4):275-279.
4. Kawaguchi T, Nagasawsa T, Tsuruya K, et al. A nationwide survey on clinical practice patterns and bleeding complications of percutaneous native kidney biopsy in Japan. Clin Exp Nephrol 2020;24(5):389-401.
5. Dai H, Zhao C, Xiong Y, et al. Evaluation of contrast-induced acute kidney injury using IVIM and DKI MRI in a rat model of diabetic nephropathy. Insights Imaging 2022;13(1):110.
Figures
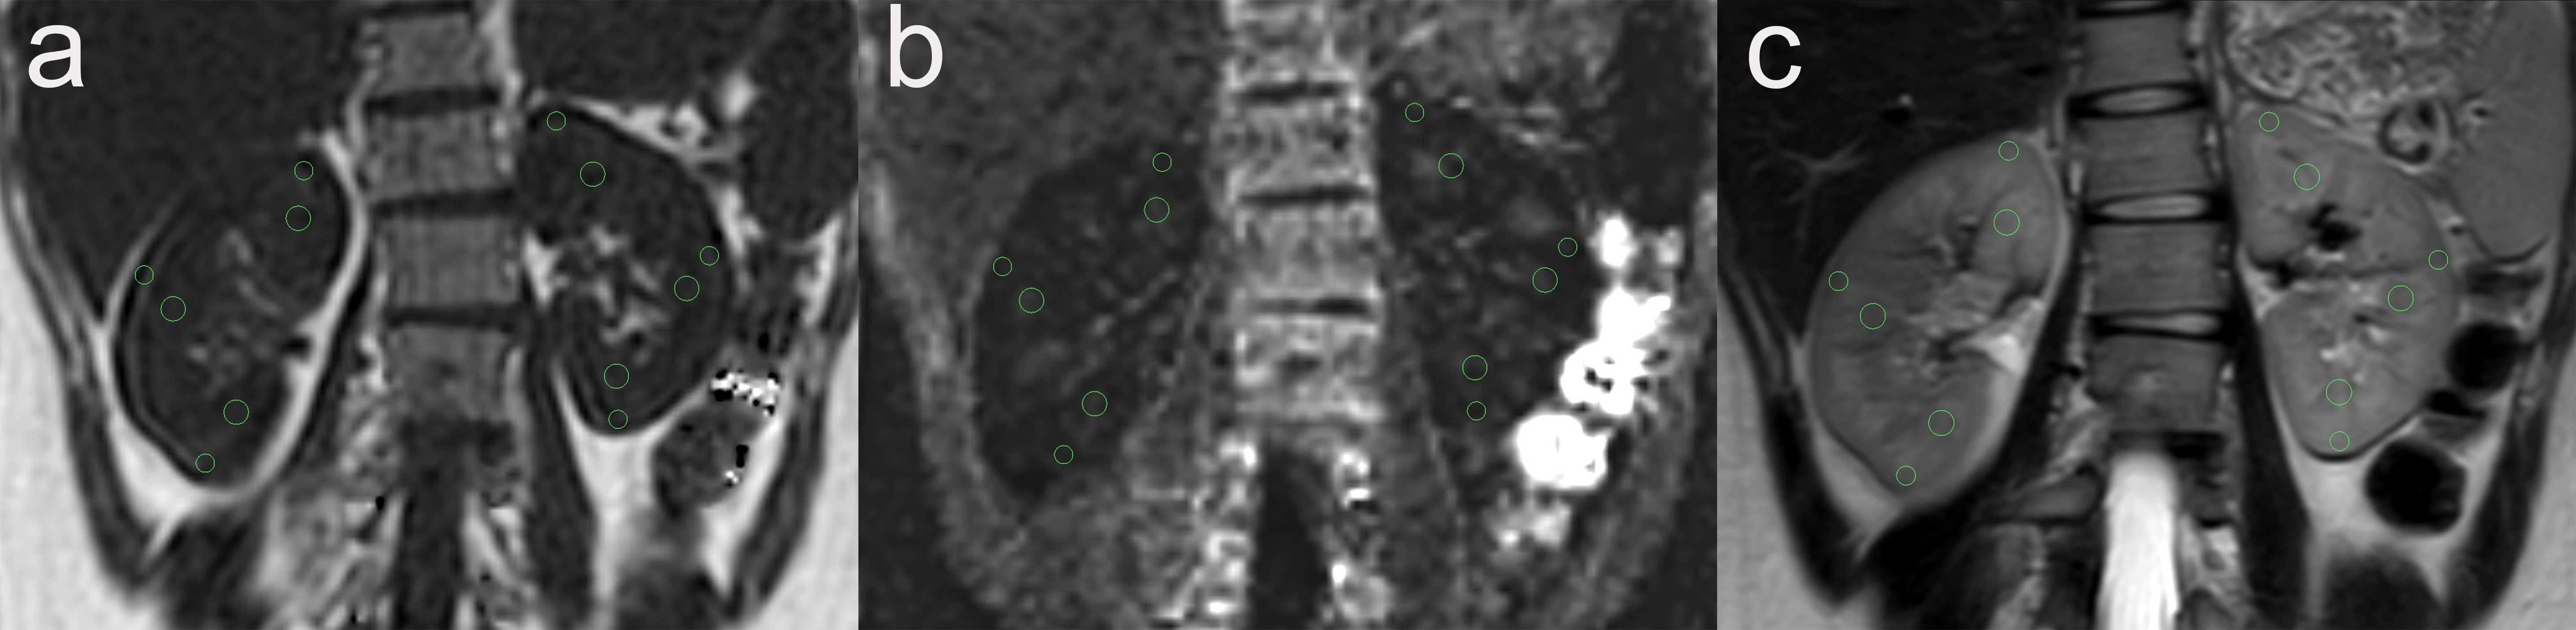
Figure 1, Examples of ROIs of the bilateral kidneys: the (a)FF map, (b)R2* map and (c)T2W image
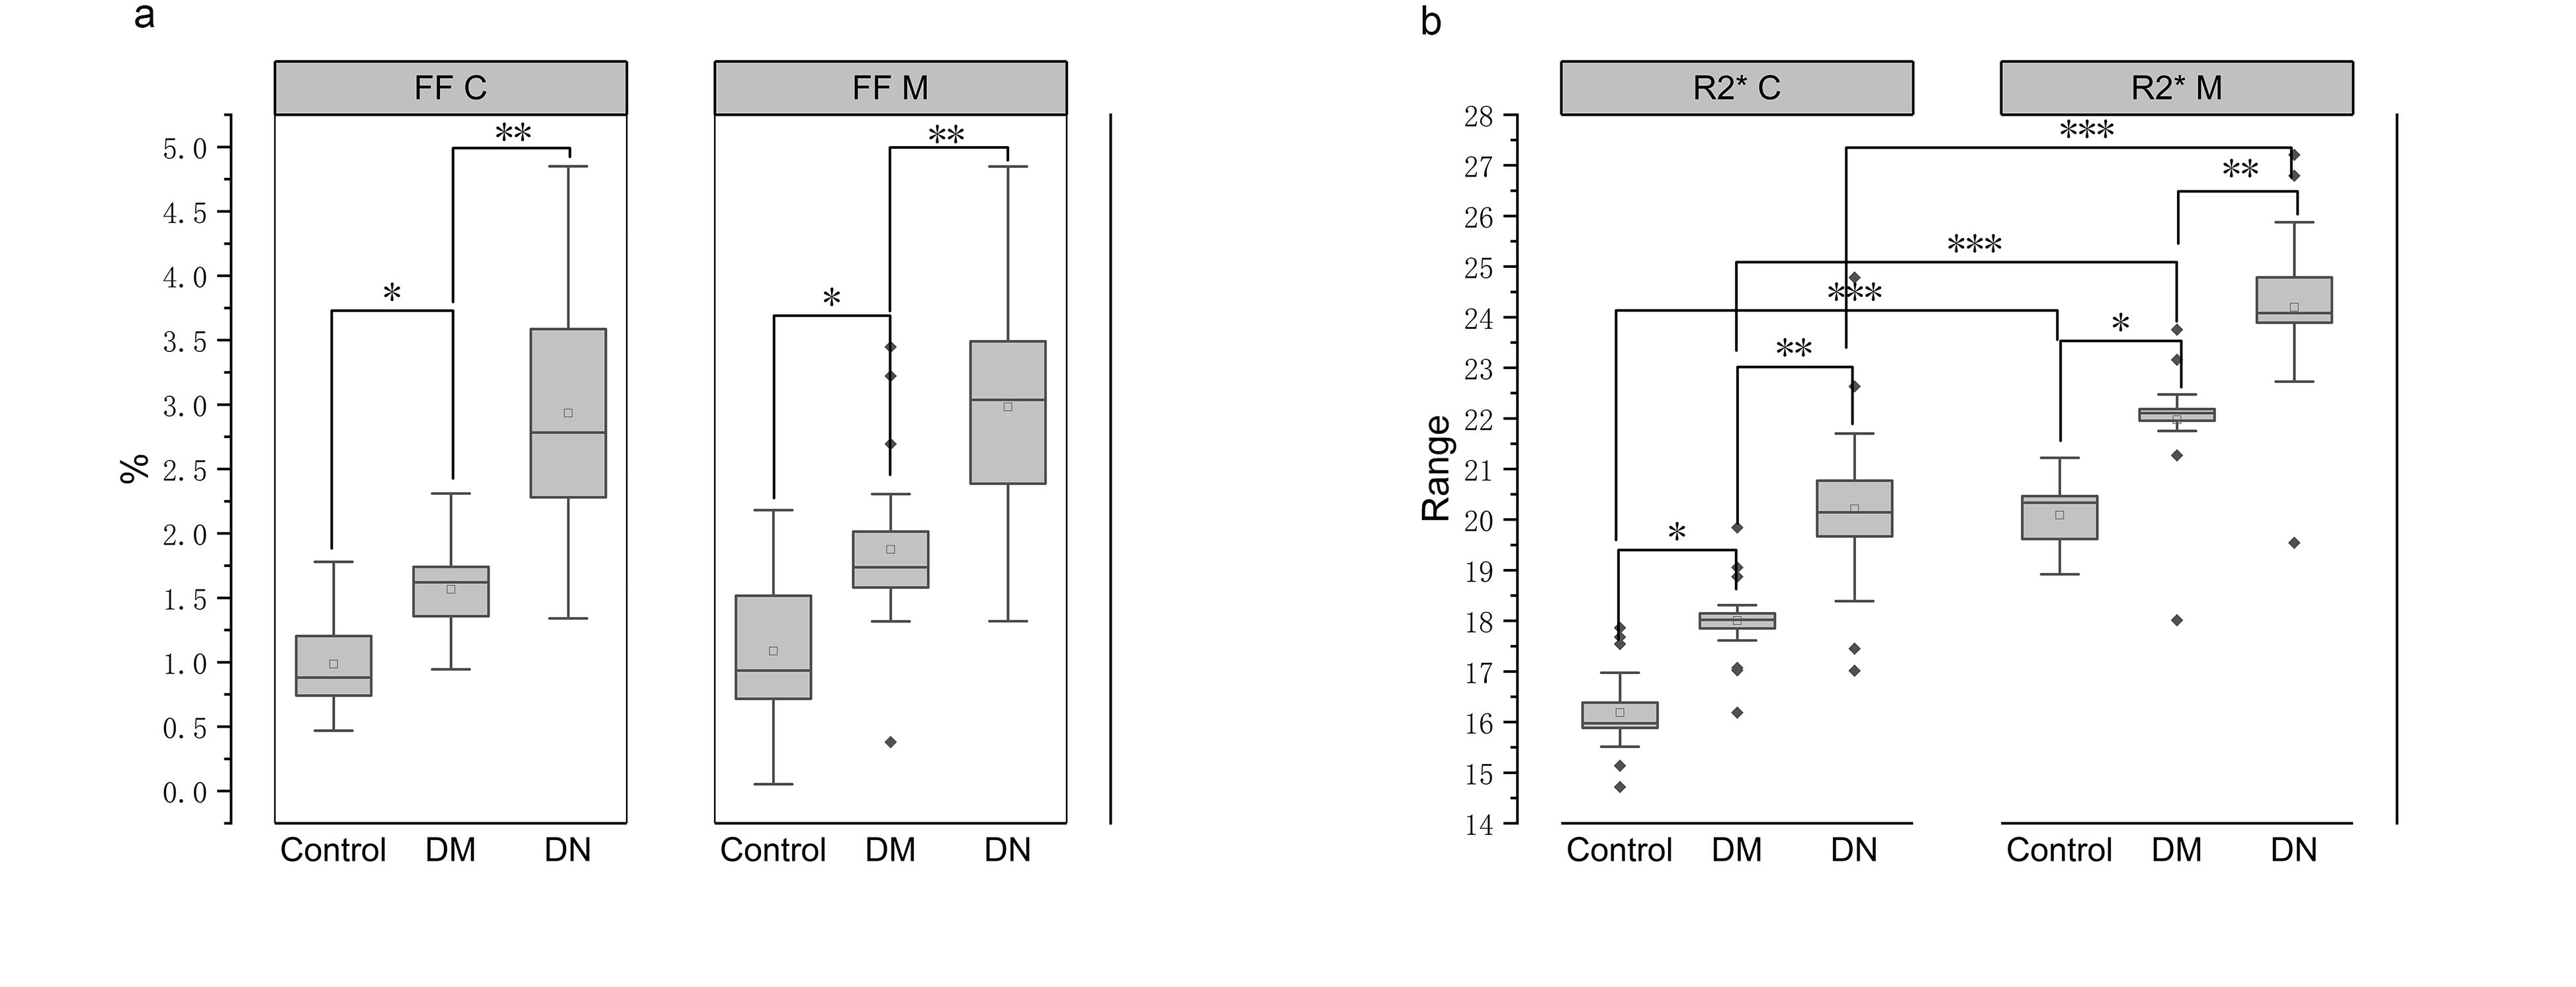
Figure 2, Box-whisker plot of renal parenchymal FF(a) and R2*(b) of the cortex and medulla in the healthy controls, DM and DN. (FF C, FF values of cortex; FF M, FF values of medulla; R2* C, R2* values of cortex; R2* M, R2* values of medulla; DM, diabetes mellitus type 2; DN, diabetes mellitus type 2 accompanying diabetic nephropathy.) (* compared with control group, ** compared with DM, *** compared with cortex.).
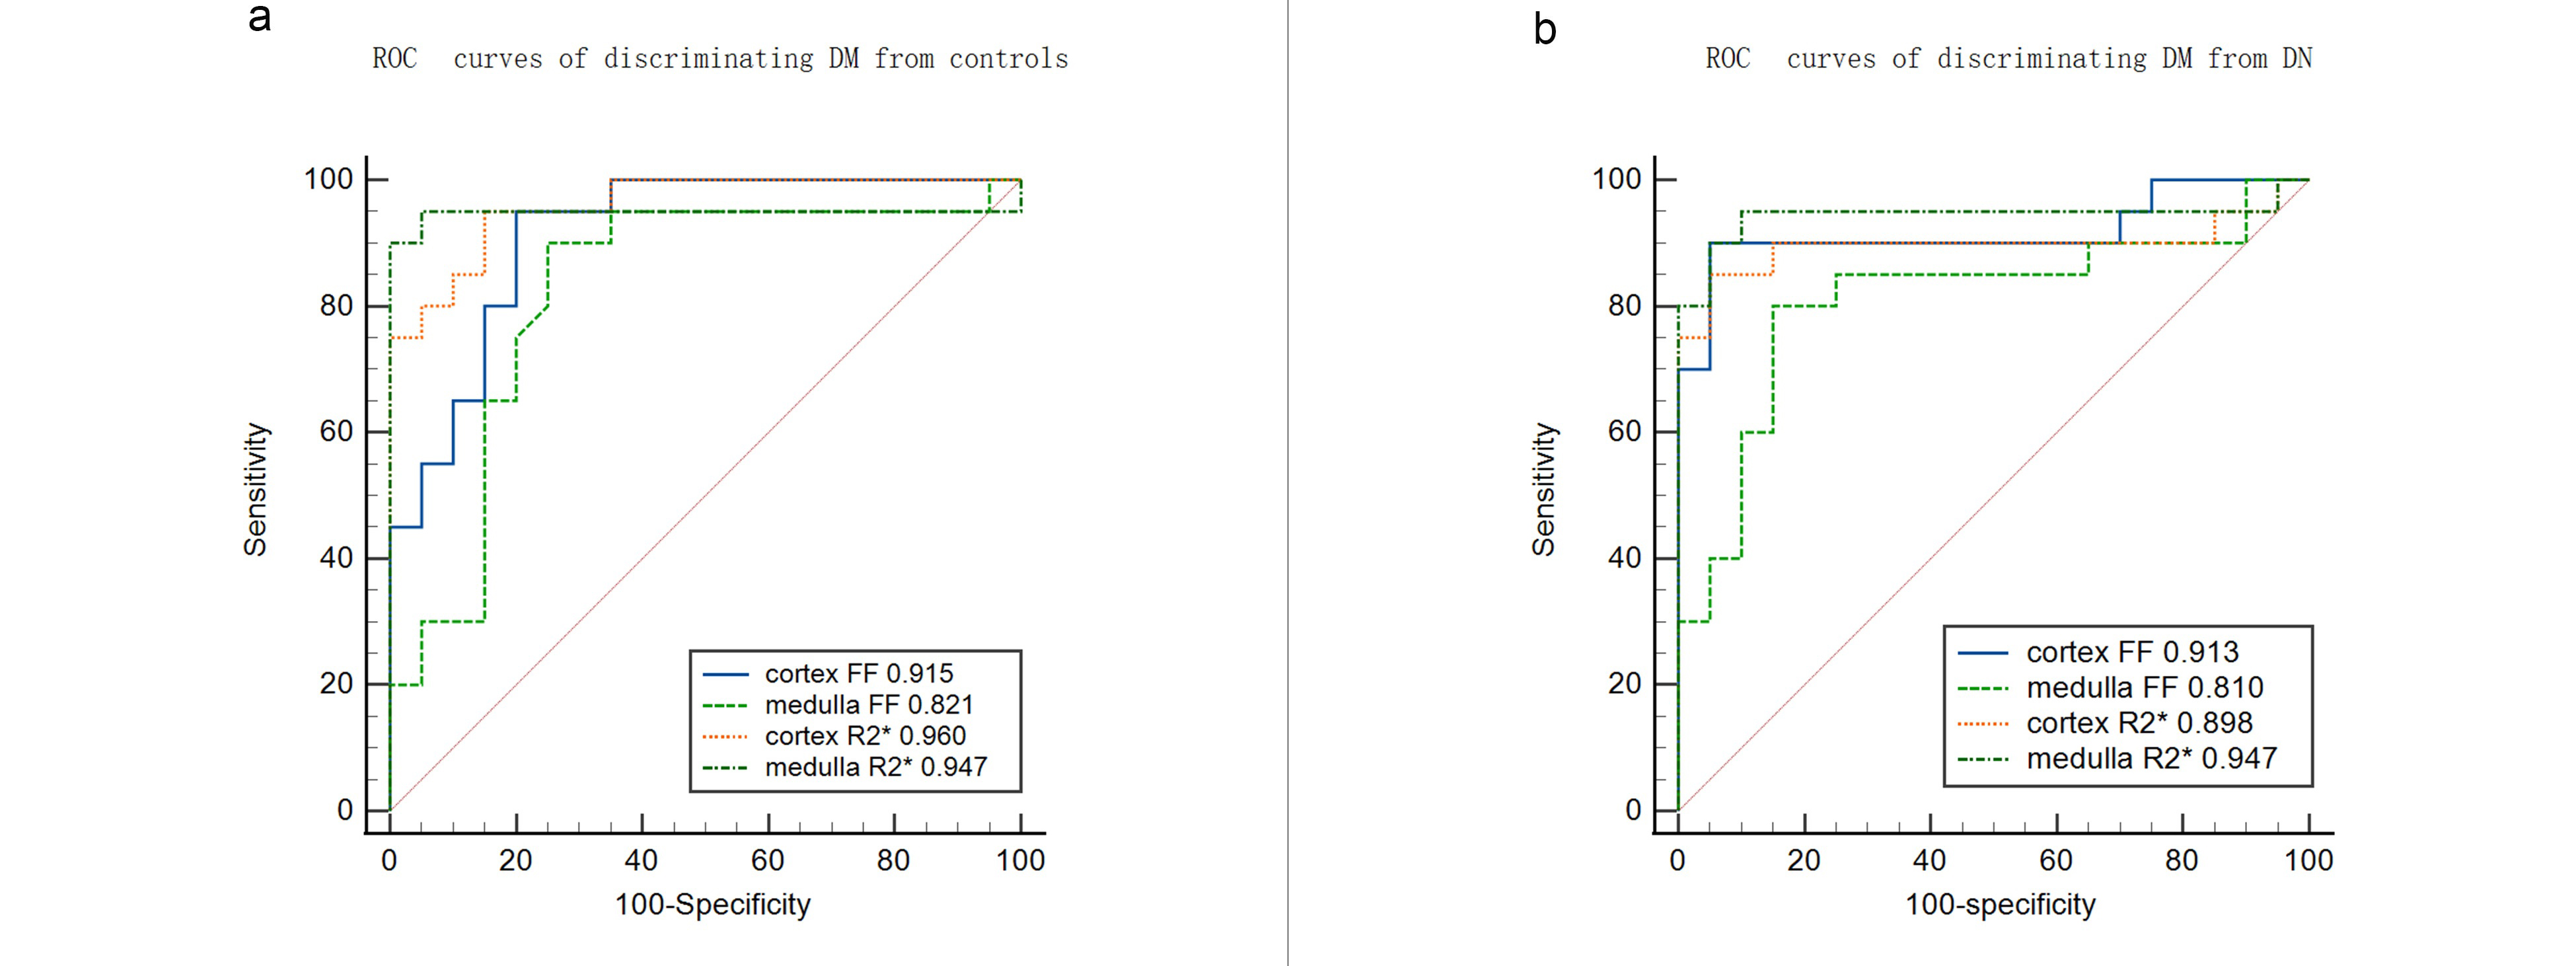
Figure 3, Receiver operating characteristic curves of the diagnostic performance of FF and R2* values of the renal cortex and medulla. (a)discriminating DM from control group (b) discriminating DN from DM. Area under the receiver operating characteristic curve is shown for each parameter.
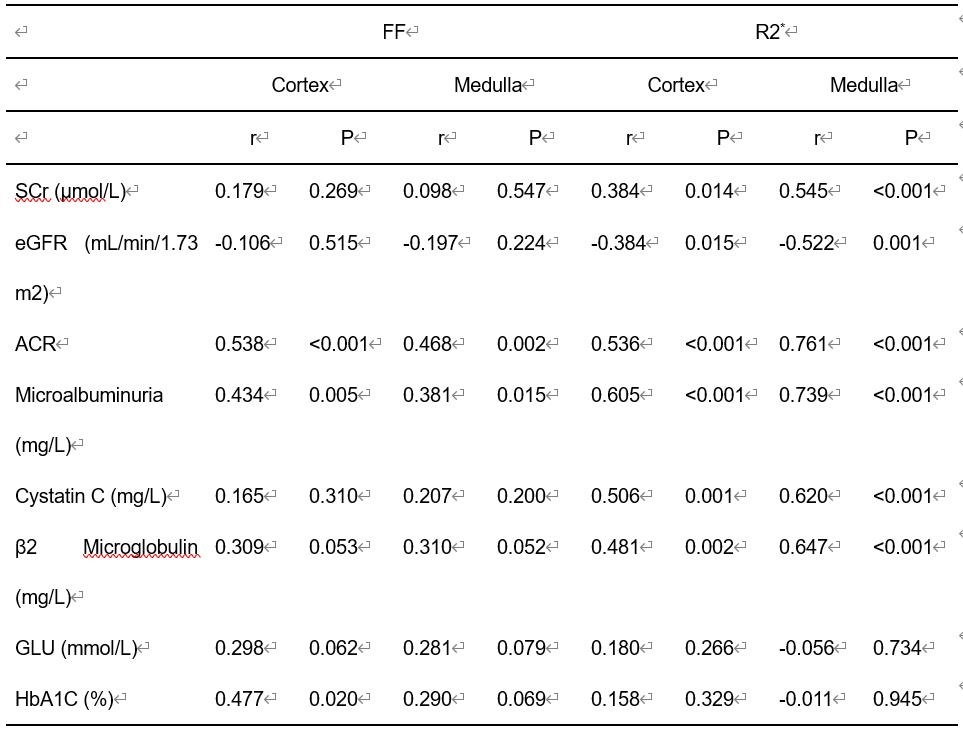
Table 1. Correlations of the FF and R2* with SCr, eGFR, ACR, Microalbuminuria, Cystatin C, β2 Microglobulin, GLU, and HbA1C.
SCr, Serum creatinine; eGFR, glomerular filtration rate; ACR: urine albumin: creatinine ratio; GLU, blood glucose; HbA1c, glycated hemoglobin.
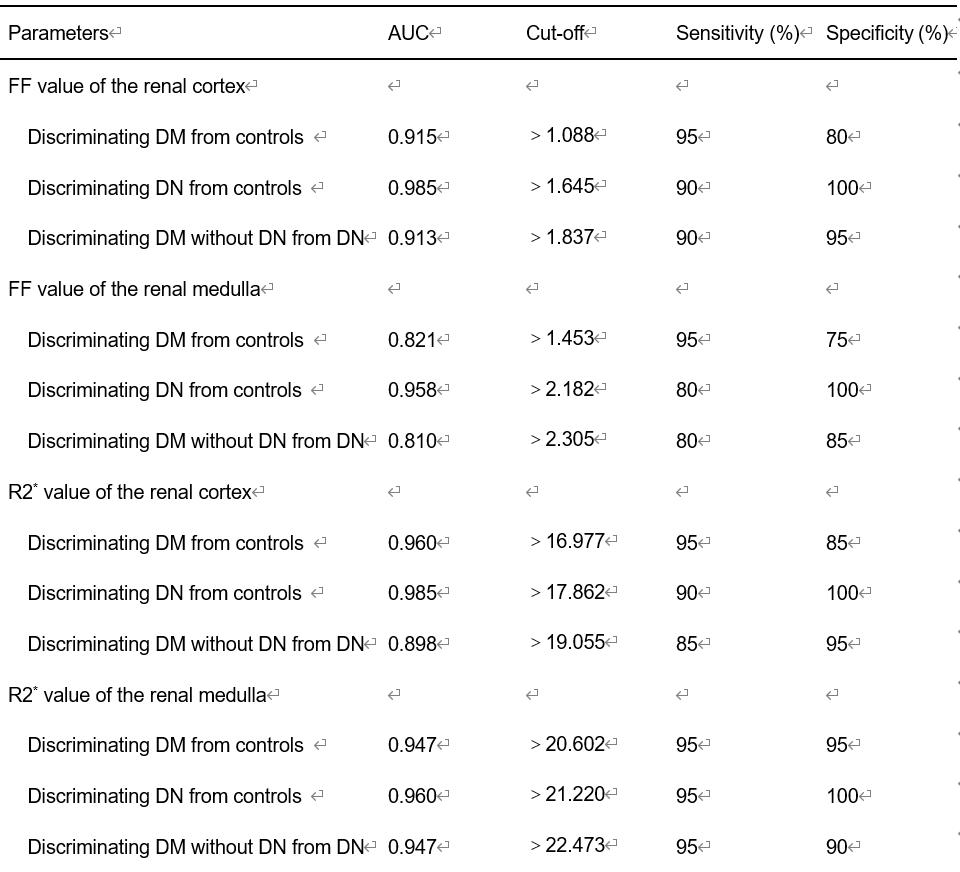
Table 2. Diagnostic
performance of MRI parameters for the discrimination among the three groups.
DOI: https://doi.org/10.58530/2023/3812