3811
Diffusion tensor imaging-based quantitative assessment of renal function in early-stage lupus nephritis1The second Affiliated Hospital Guangzhou, School of Medicine, South China University of Technology, Guangzhou, China, 2Department of Radiology, Guangzhou First People’s Hospital, Guangzhou, China, 3Philips Healthcare, Guangzhou, China, 4Department of Rheumatology, The second Affiliated Hospital Guangzhou, School of Medicine, South China University of Technology, Guangzhou, China, 5Department of Rheumatology, Guangzhou First People’s Hospital, Guangzhou, China
Synopsis
Keywords: Kidney, Diffusion Tensor Imaging, Lupus nephritis
Lupus nephritis (LN) is a substantial cause of death in patients with systemic lupus erythematosus (SLE). The purpose of this study was to explore the value of Diffusion tensor imaging (DTI) in evaluating renal function in patients with early-stage LN. The results showed apparent diffusion coefficient (ADC) values in the cortex and fractional anisotropy (FA) values in the cortex and medulla were significantly lower in early-stage LN patients compared with healthy volunteers. Furthermore, FA values in the cortex and medulla were also independent predictors of early-stage LN, suggesting that FA values can be a potentially sensitive imaging biomarker.
Introduction
Lupus nephritis (LN) is one of the most severe organ manifestations of systemic lupus erythematosus (SLE), remaining a substantial cause of morbidity and death1. Therefore, early and accurate diagnosis of LN for prompt initiation and therapy is vital to preventing disease progression. Diffusion tensor imaging (DTI) has been proven to be valuable to assess renal dysfunction in both primary and secondary renal disease by the fractional anisotropy (FA) value in detecting anisotropic diffusion2. Consequently, this study aimed to estimate the value of DTI in identifying split renal function in early-stage LN patients.Methods
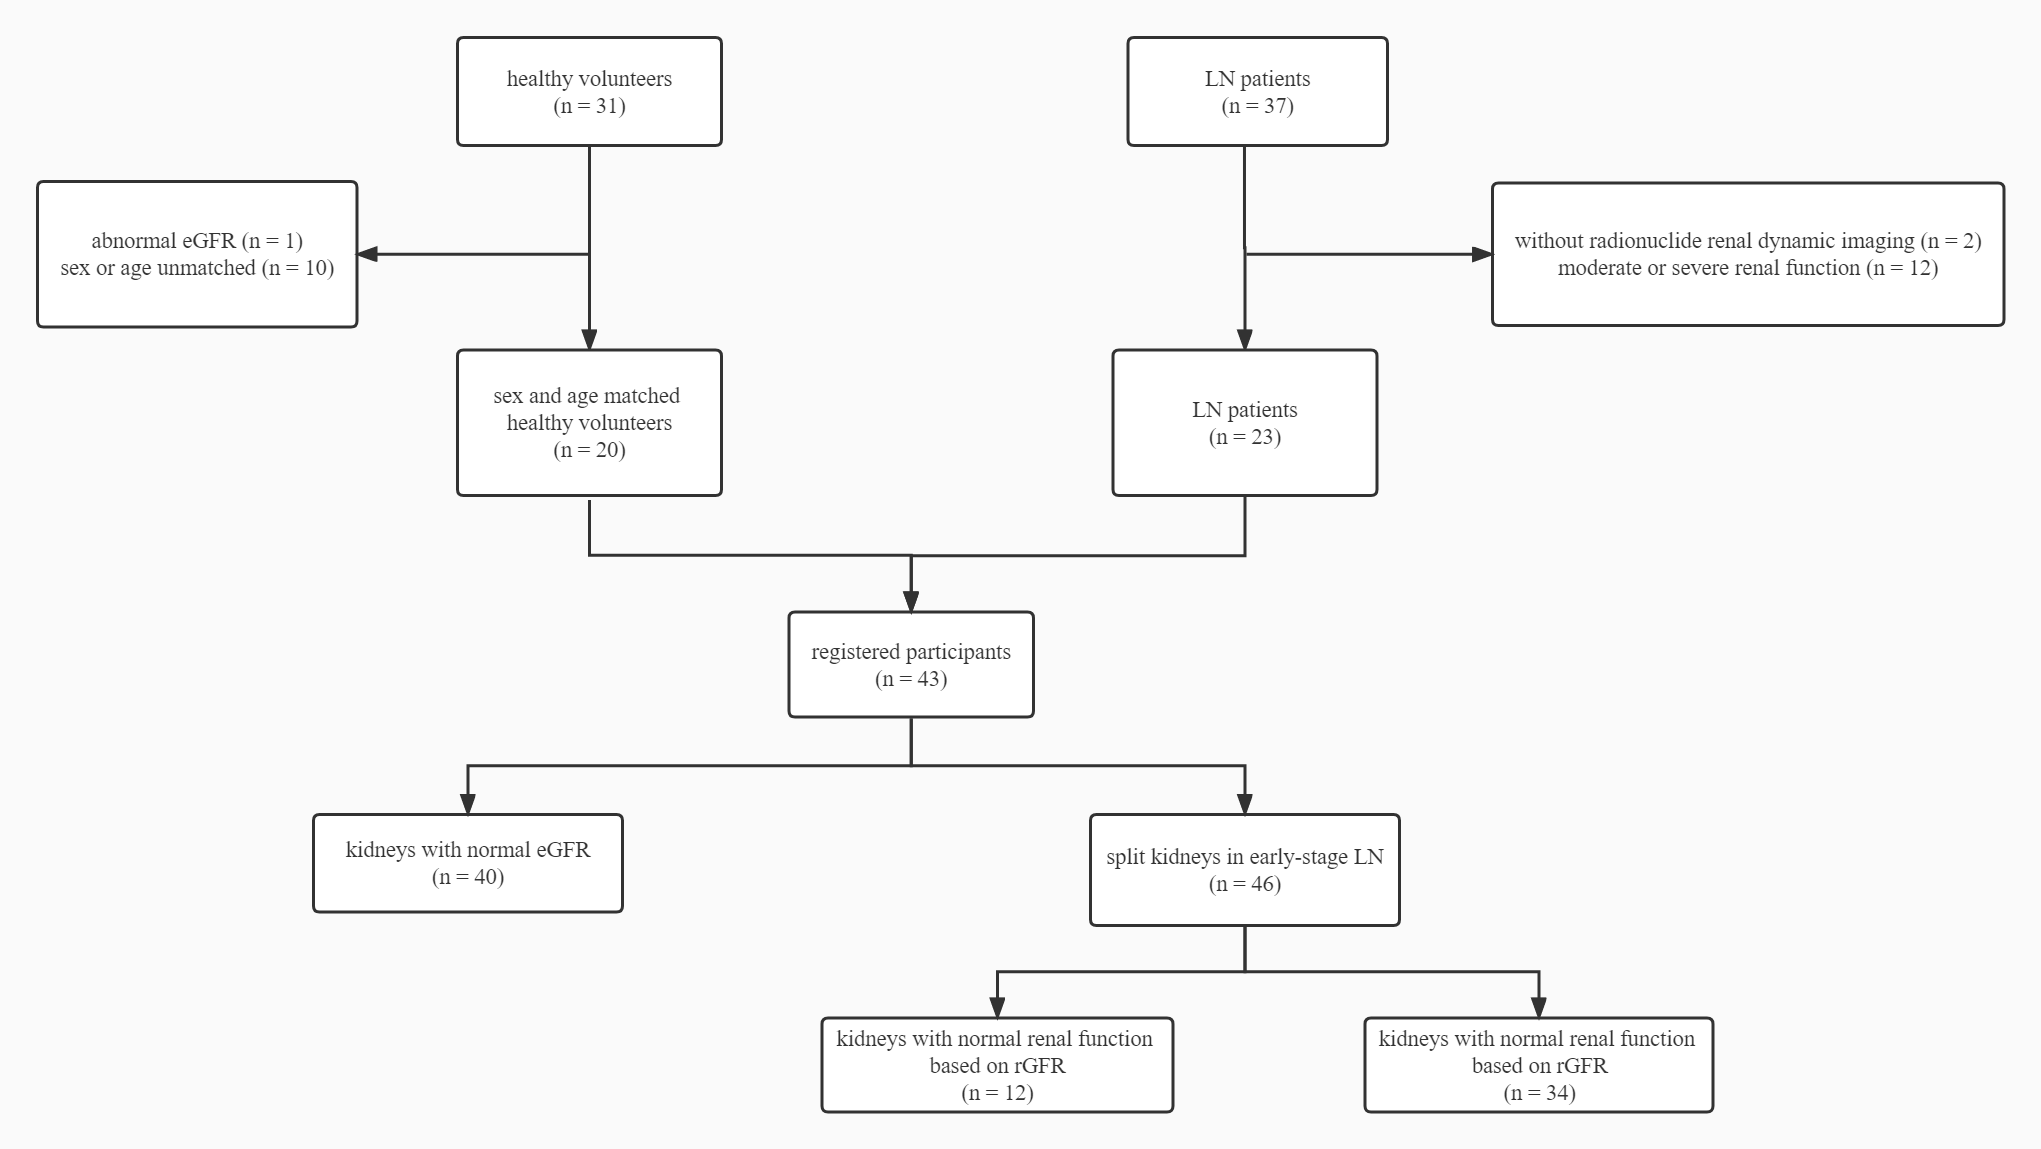
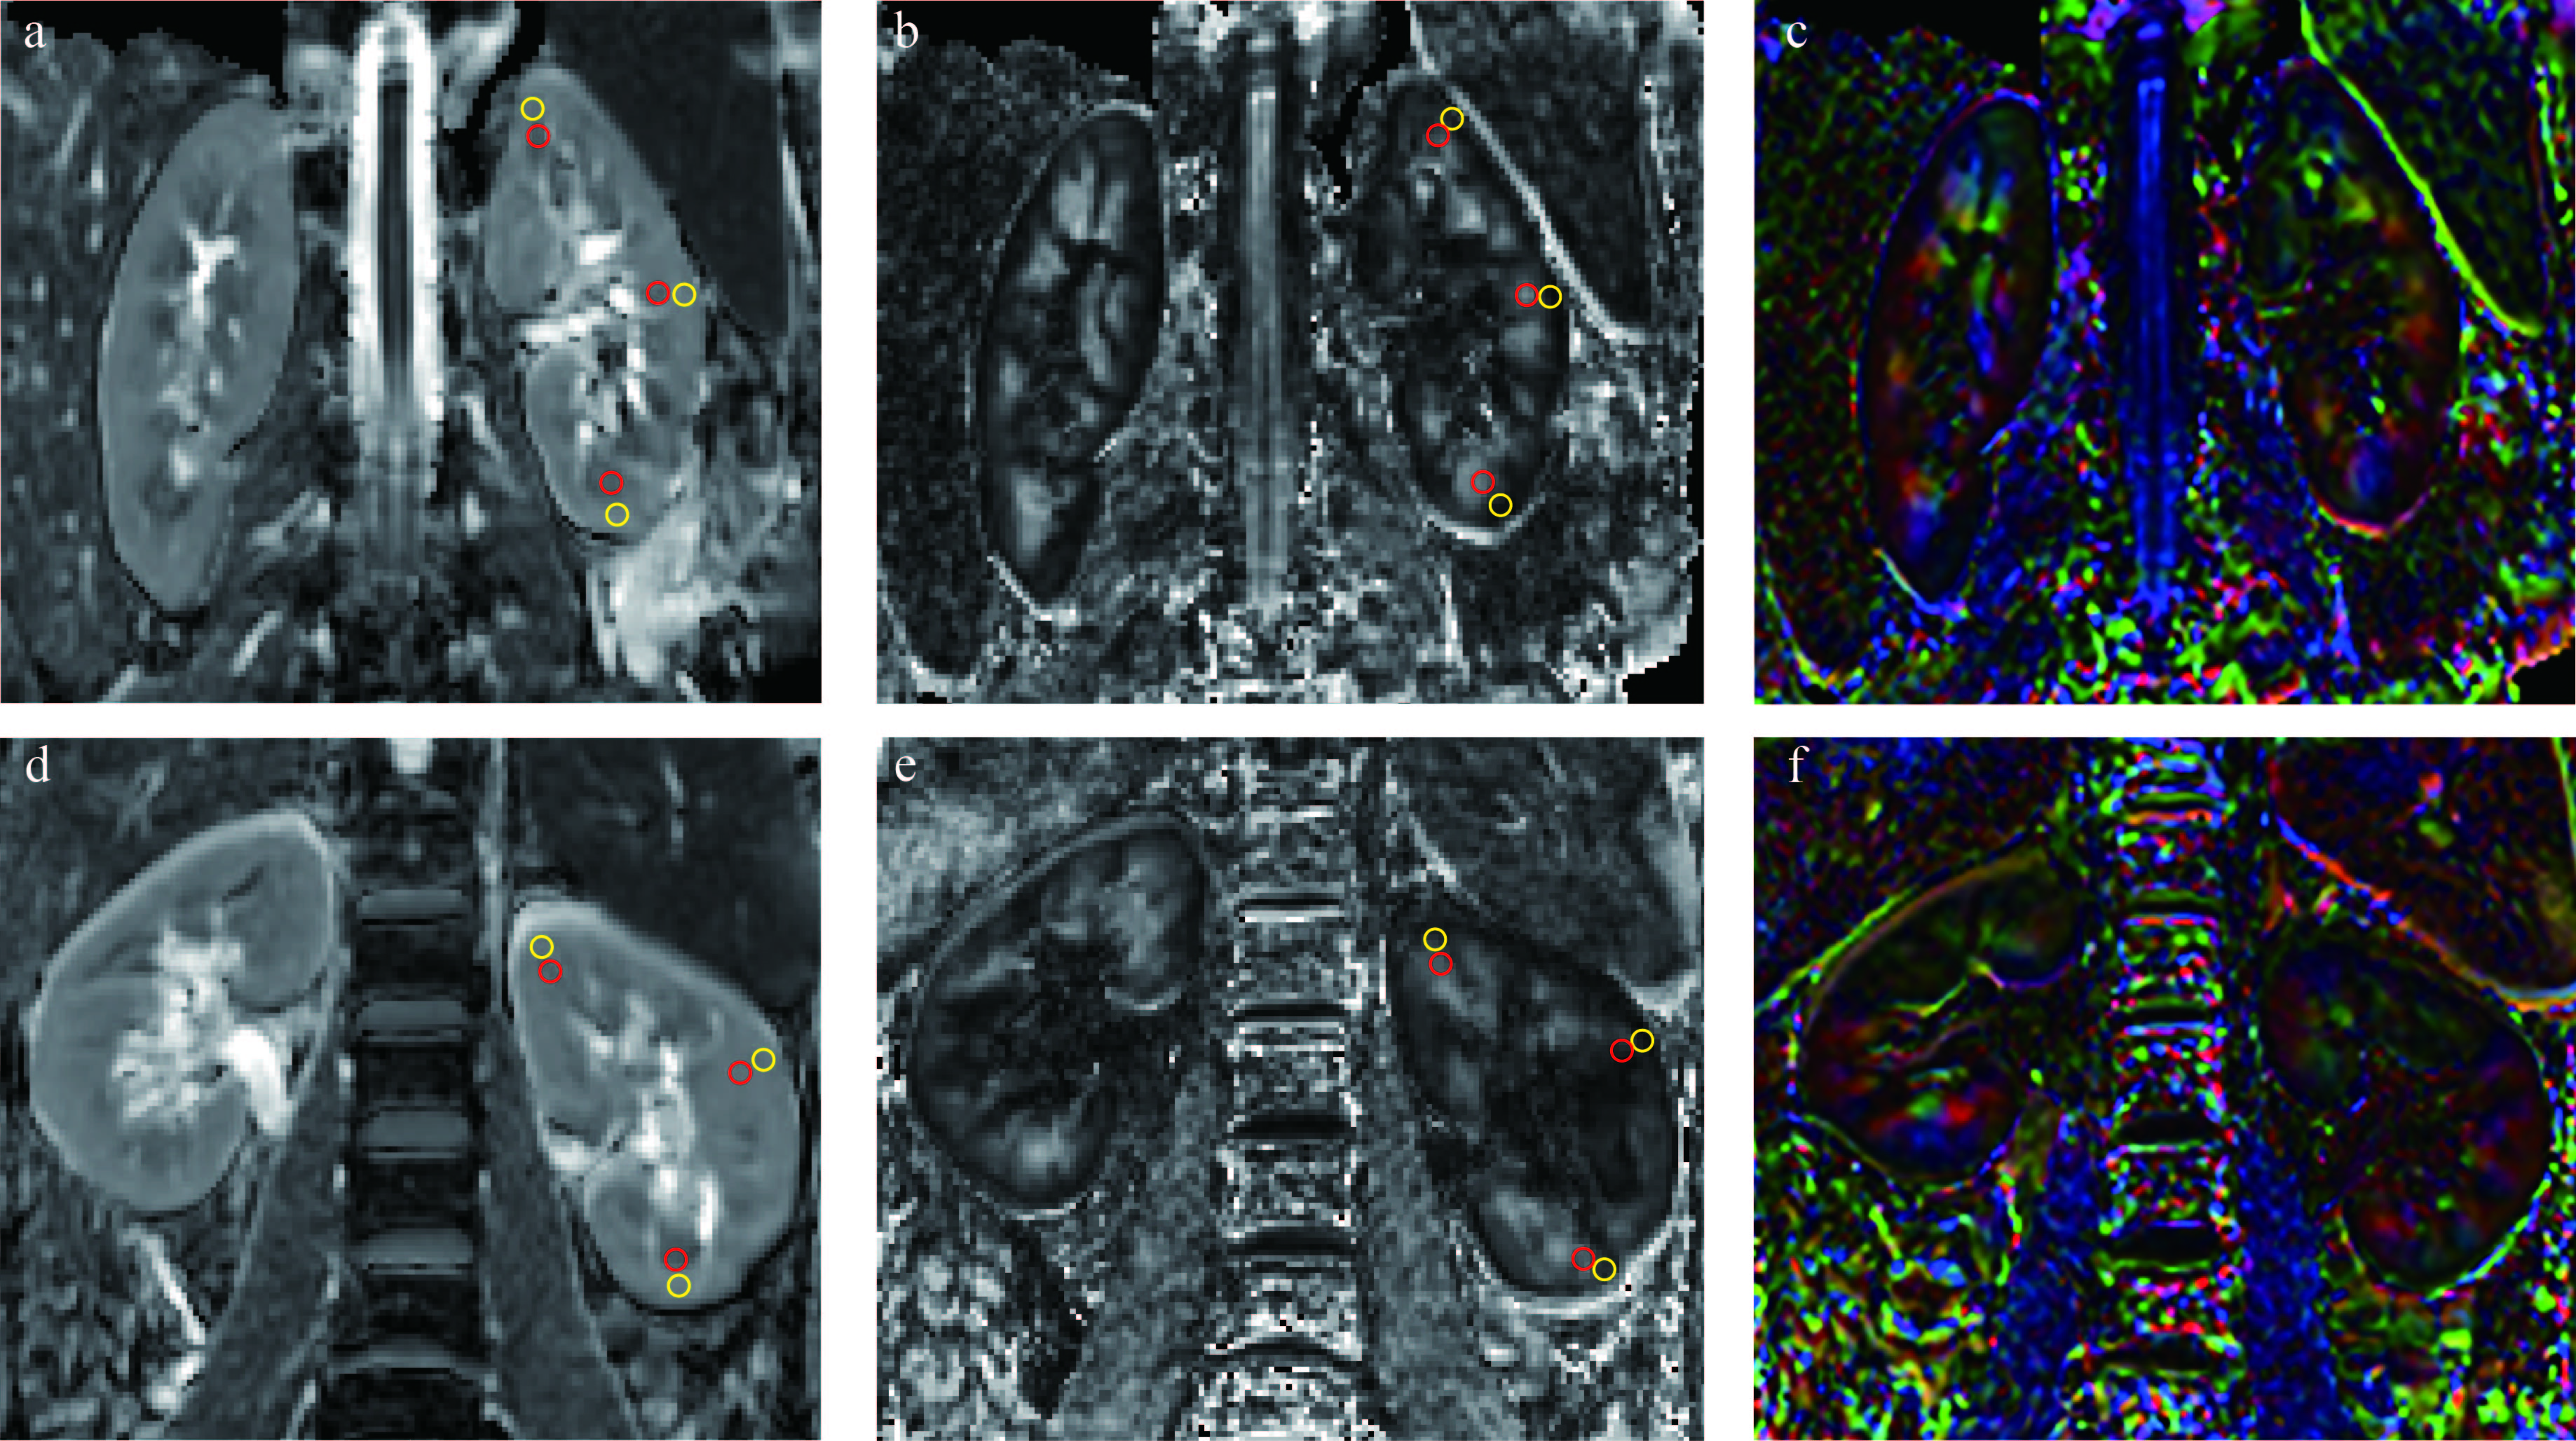
This prospective study included 20 healthy volunteers (HVs) and 23 early-stage LN patients (Figure 1). All the participants underwent DTI scans while LN patients also underwent radionuclide renal dynamic imaging to obtain the radionuclide glomerular filtration rate (rGFR). The apparent diffusion coefficient (ADC) and FA values were obtained by placing circle-shaped regions of interest (ROI) in both cortex and medulla in the upper pole, middle, and inferior poles of the split kidneys (Figure 2). To further explore the role of DTI in LN patients with different severity, LN patients were divided into a normal renal function (rGFR-normal) and a mild decline renal function (rGFR-mild) subgroups according to the radionuclide renal dynamic imaging. The univariate and multivariate logistic models were employed to predict the LN patients. To better explore the contribution of FA values, the multiplicative inverse of FA values (1/FA) was put into the multivariate regression analysis. The receiver operator characteristic (ROC) curve and the area under the curve (AUC) were employed to evaluate the predictive performance.Results
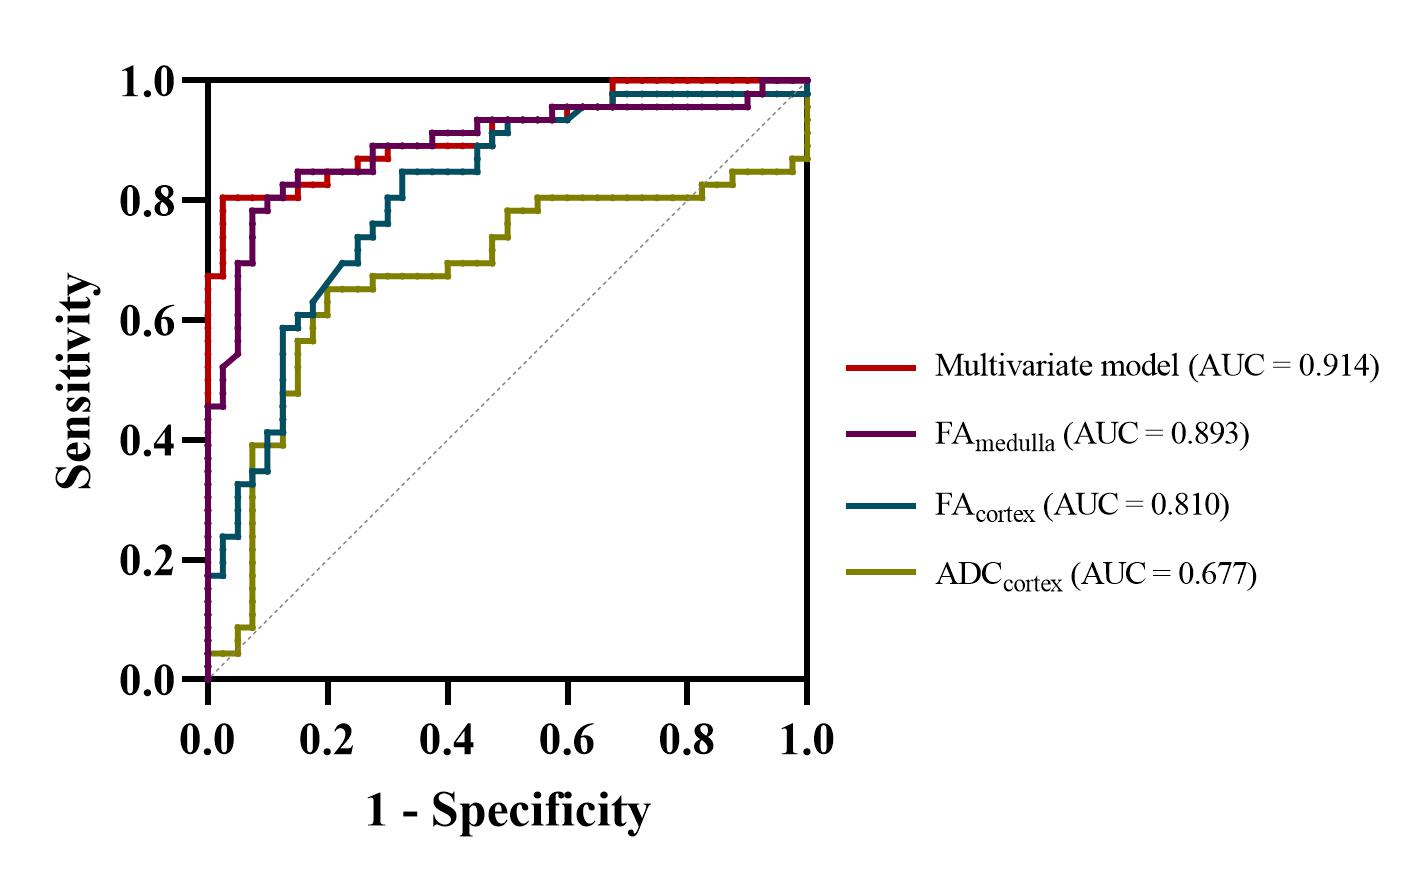
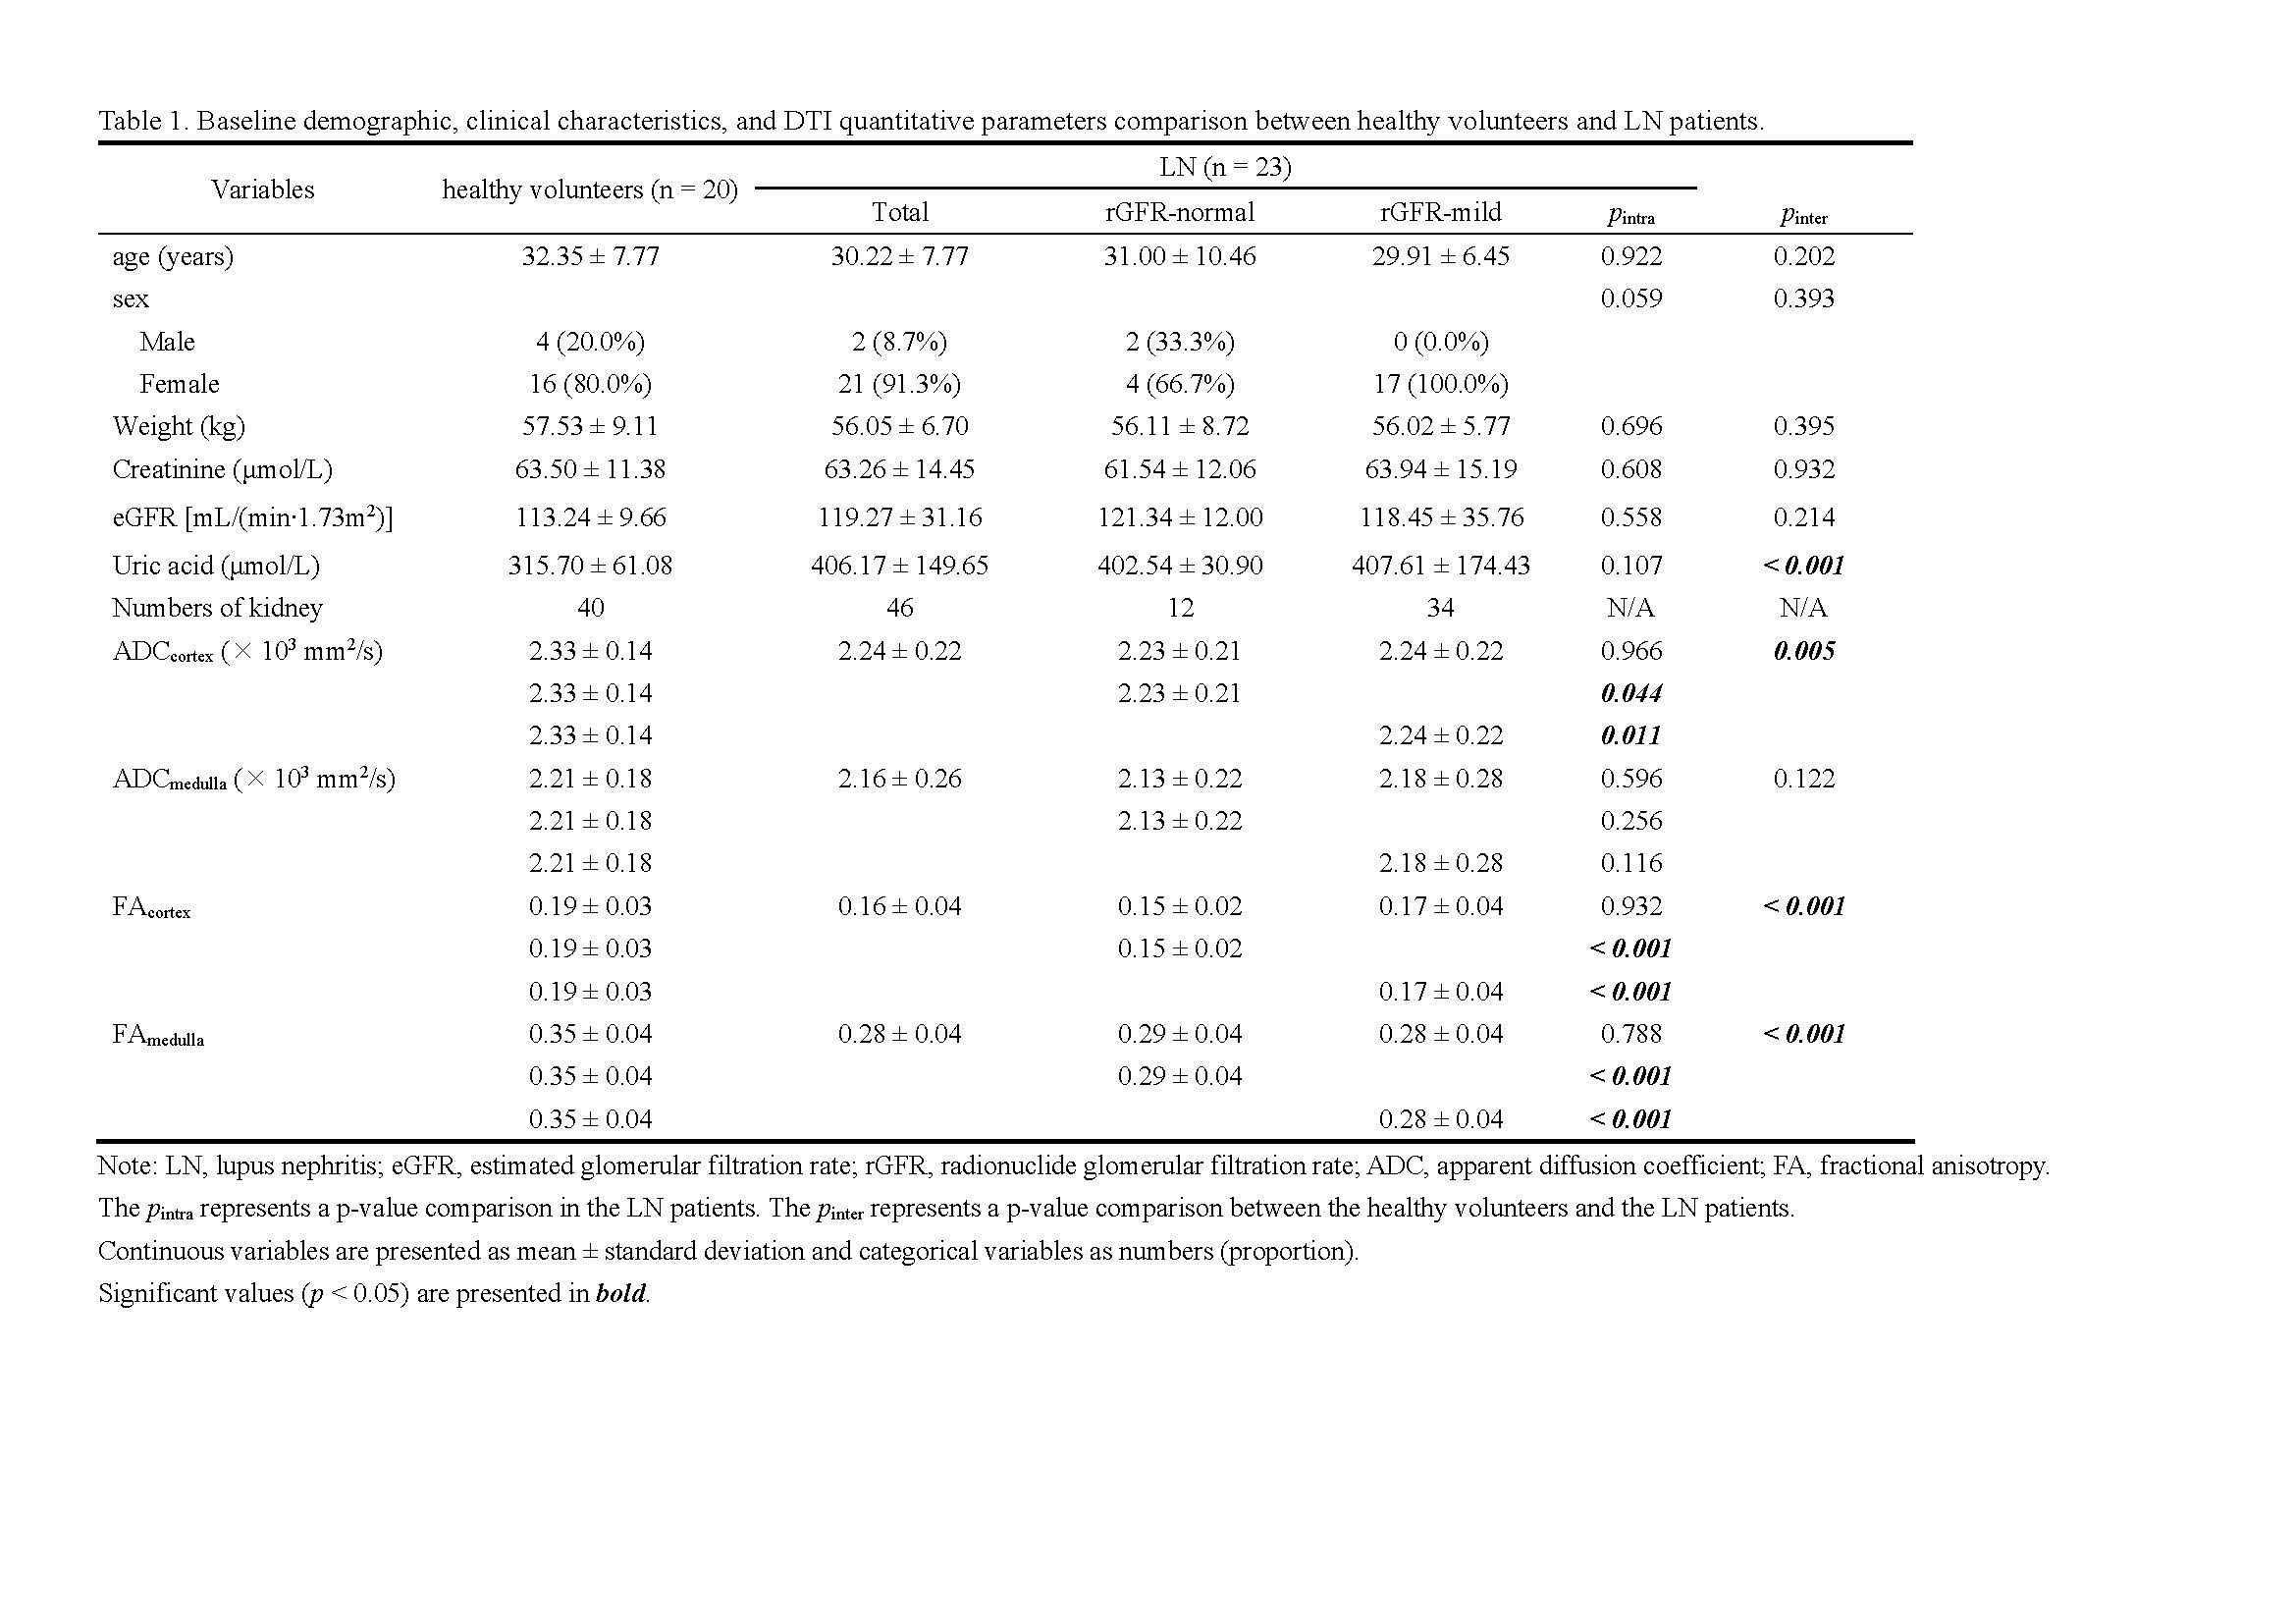
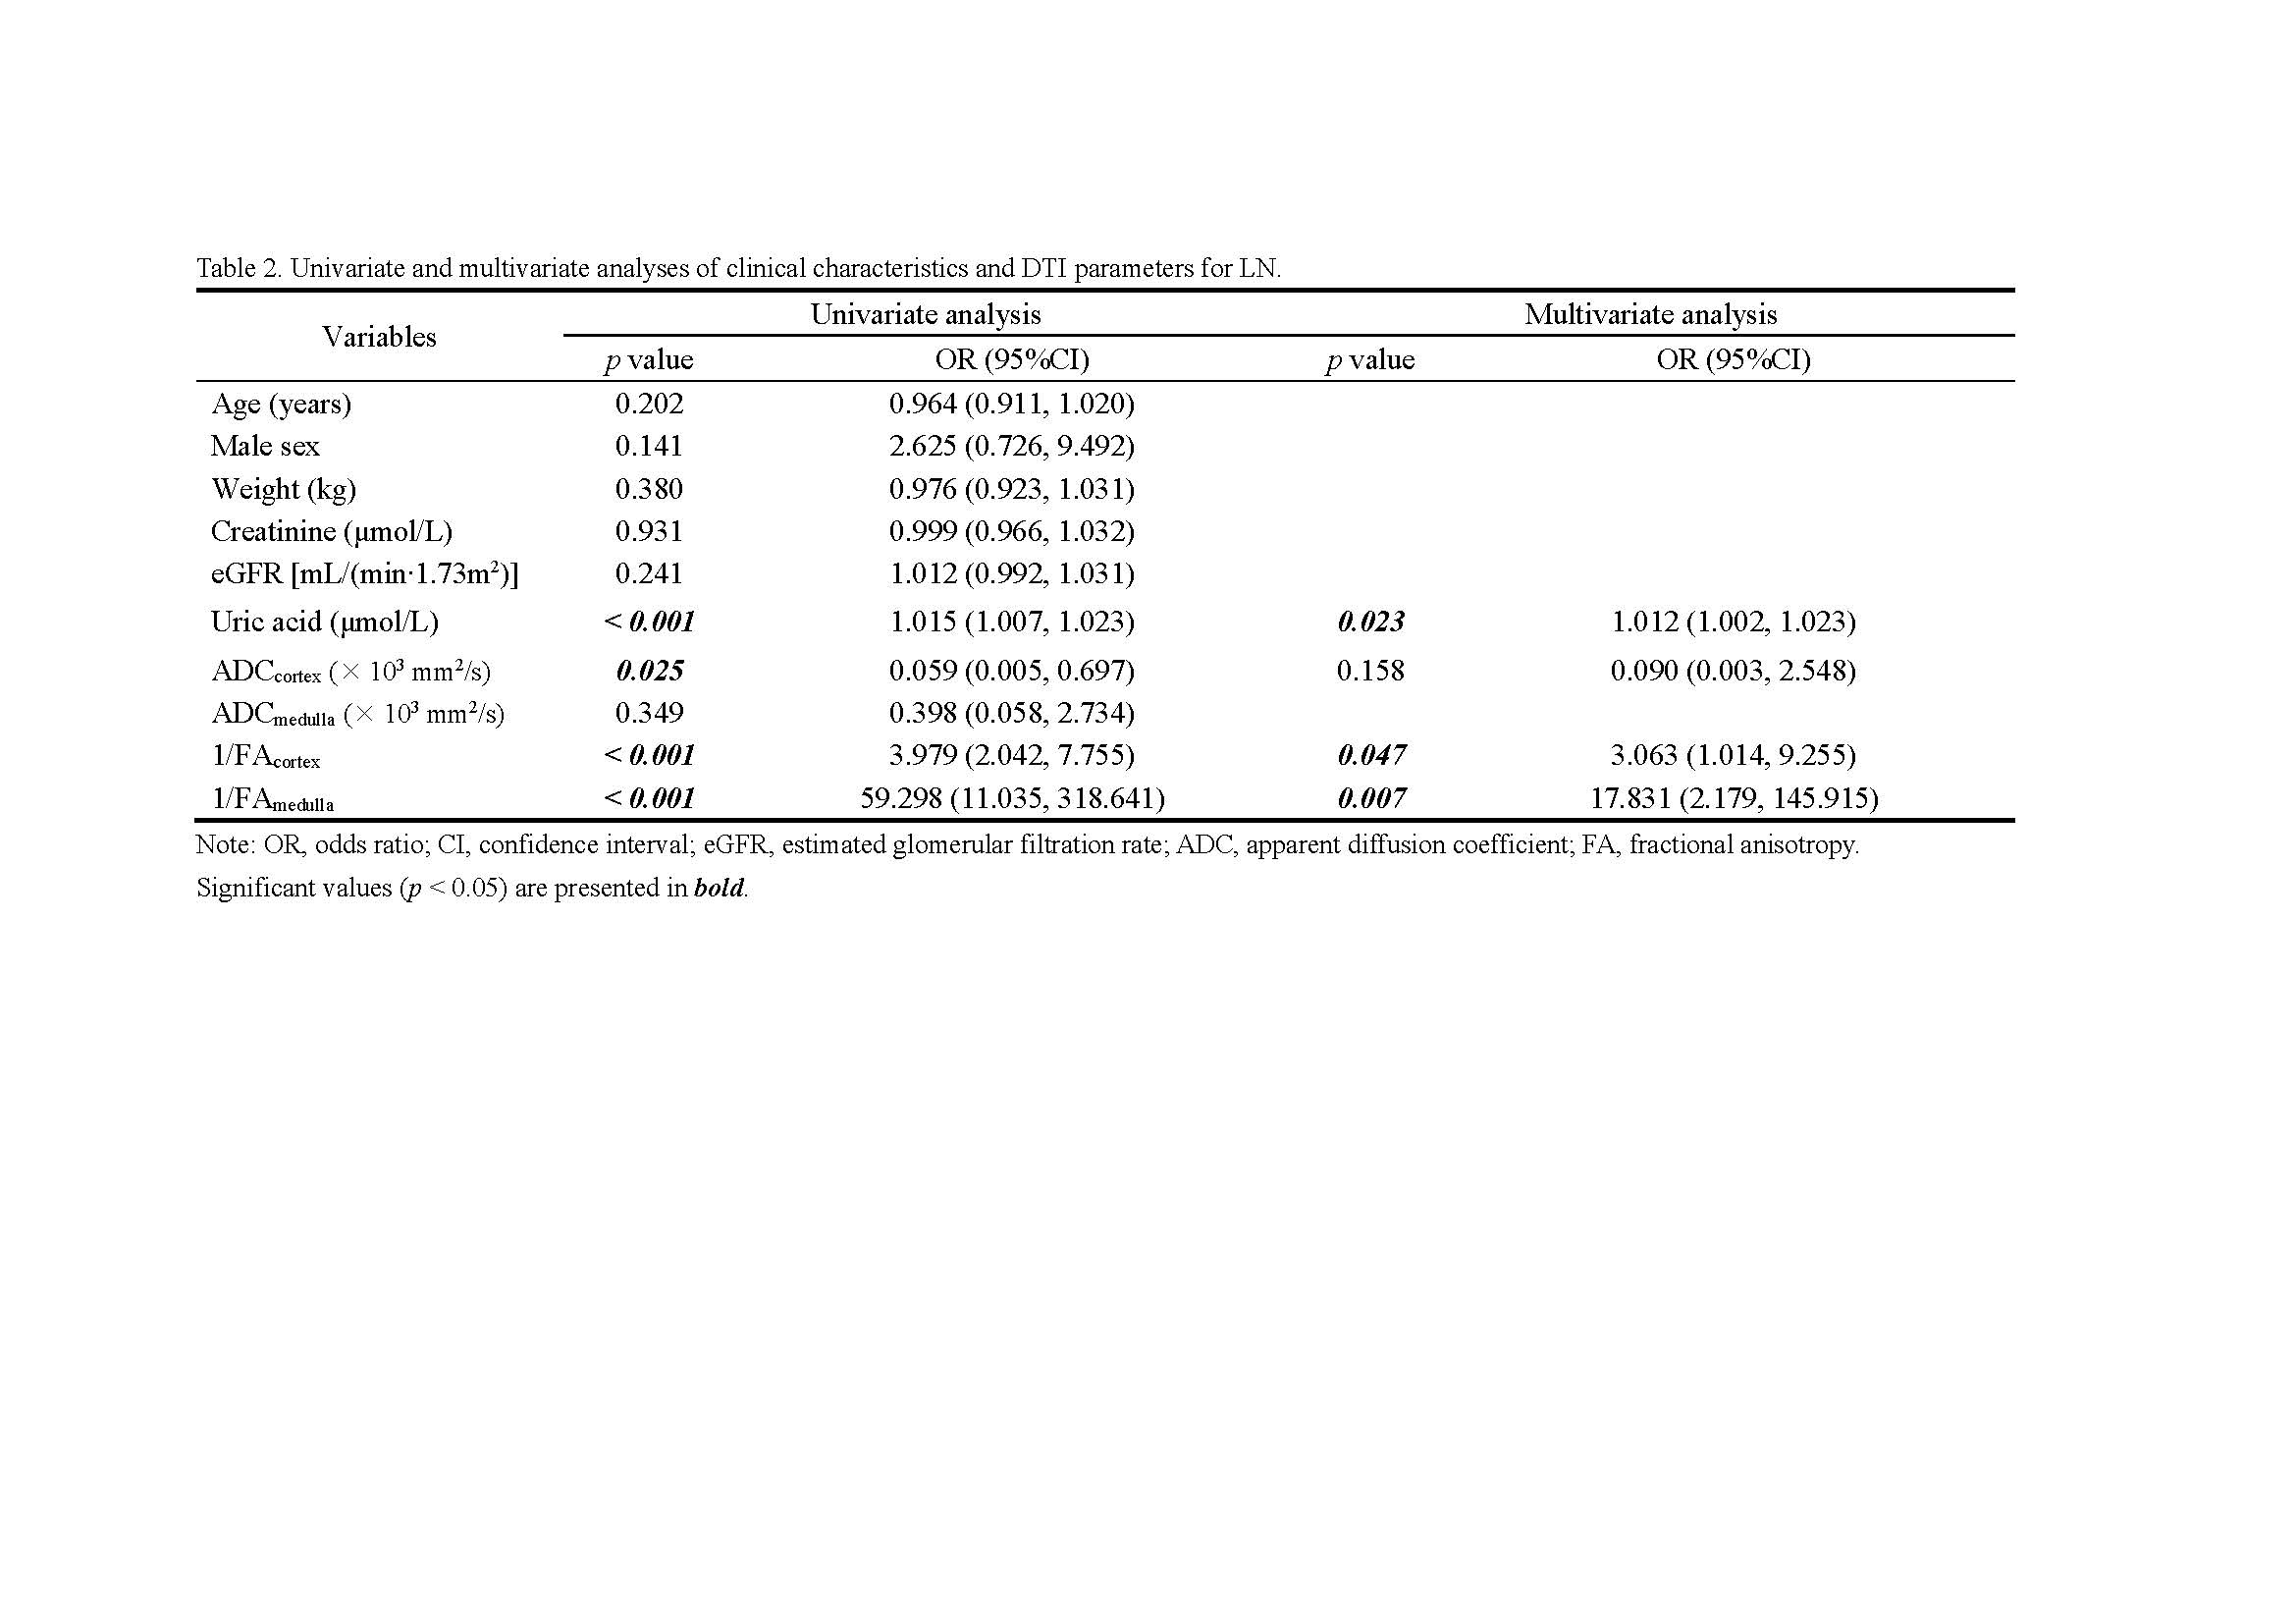
The baseline characteristics showed no significant differences between HVs and LN patients except uric acid (p < 0.001) (Table 1). Compared with the HV group, the ADC value of the cortex (ADCcortex, p = 0.005), FA value of the cortex (FAcortex, p < 0.001), and FA value of the medulla (FAmedulla, p < 0.001) were all significantly lower in the LN group. Furthermore, multivariate logistic regression analysis showed that 1/FAcortex (p = 0.047; odds ratio [OR] = 3.063; 95% confidence interval [CI]: 1.014, 9.255), 1/FAmedullar (p = 0.007; OR = 17.831; 95% CI: 2.179,145.915) and uric acid (p = 0.023, OR = 1.012; 95% CI: 1.002, 1.023) were independent predictors of early-stage LN (Table 2). The ROC curve (Figure 3) showed a specificity of 85.0% and a sensitivity of 80.4% with an AUC value of 0.914 (95% CI: 0.854, 0.974). However, when the LN patients were sub-grouped, no significant difference was found between ADC values or FA values in the rGFR-normal subgroup and rGFR-mild decreased subgroup. When compared with the healthy volunteers, the ADCcortex (p = 0.044 and p = 0.011), FAcortex (p = 0.001 and p < 0.001), and FAmedulla (p < 0.001 and p < 0.001) values were significantly lower in both subgroups (Table 1).Discussion
In this study, we discovered the correlation between quantitative characteristics in DTI and early-stage LN. Compared with the healthy volunteers, early-stage LN patients had lower ADC values in the cortex, lower FA values in both the cortex and the medulla, and higher uric acid levels. Moreover, the multivariate regression model demonstrated FA values in both the cortex and the medulla and uric acid were independent predictors for early-stage LN. Accordingly, the results indicated DTI could be an imaging biomarker of renal function decrease in early-stage LN.The main pathophysiological change in LN is a decrease in renal function due to secondary glomerulonephritis caused by immune complex deposition1. Radionuclide renal dynamic imaging, as is well known, could sensitively detect impaired split renal function at an early stage, which was also the reference standard for grouping. It is undeniable that some LN patients in the early stage still have normal renal function by radionuclide renal dynamic imaging, but the prediction model can still distinguish between healthy volunteers and early-stage LN patients. The results show that the FAcortex and FAmedulla were significantly lower in early-stage LN patients and remained independent predictors. This might be explained by the fact that DTI describes the anisotropy of water molecules, indicating the microstructure changes of the kidney, which were consistent with previous studies3-5, suggesting that the FA value can detect structural changes in the kidney at an early stage. The results also indicated that renal FA values can be used as a marker of structural changes in the kidney.
Additionally, our study further explored the relationship between DTI parameters and LN severity. Our results showed no significant difference in DTI parameters between rGFR-normal and rGFR-mild subgroups. However, the ADCcortex, FAcortex and FAmedulla values were significantly reduced in these two subgroups compared with healthy volunteers, indicating that DTI remains sensitive in distinguishing normal renal function from early-stage LN patients.
Conclusion
Our findings indicated the quantitative parameters of DTI have the capability to detect split renal function in early-stage LN patients and the FA values could serve as potential biomarkers for early-stage LN, which would be more sensitive than radionuclide renal dynamic imaging for detecting renal function in early-stage LN.Acknowledgements
This study was funded by the National Natural Science Foundation of China (81971574); the GuangDong Basic and Applied Basic Research Foundation (2021A1515220060); Guangzhou Key Laboratory of Molecular Imaging and Clinical Translational Medicine (202201020376). The funders had no role in the study design, data collection and analysis, decision to publish, or preparation of the manuscript.References
1. Anders HJ, Saxena R, Zhao MH, Parodis I, Salmon JE, Mohan C. Lupus nephritis. Nat Rev Dis Primers. Jan 23 2020;6(1):7. doi:10.1038/s41572-019-0141-9
2. Sigmund EE, Vivier PH, Sui D, et al. Intravoxel incoherent motion and diffusion-tensor imaging in renal tissue under hydration and furosemide flow challenges. Radiology. Jun 2012;263(3):758-69. doi:10.1148/radiol.12111327
3. Gaudiano C, Clementi V, Busato F, et al. Diffusion tensor imaging and tractography of the kidneys: assessment of chronic parenchymal diseases. European Radiology. 2013;23(6):1678-1685. doi:10.1007/s00330-012-2749-y
4. Feng Q, Ma Z, Wu J, Fang W. DTI for the assessment of disease stage in patients with glomerulonephritis--correlation with renal histology. Eur Radiol. Jan 2015;25(1):92-8. doi:10.1007/s00330-014-3336-1
5. Liu Z, Xu Y, Zhang J, et al. Chronic kidney disease: pathological and functional assessment with diffusion tensor imaging at 3T MR. Eur Radiol. Mar 2015;25(3):652-60. doi:10.1007/s00330-014-3461-x
Figures