3810
Quantitative assessment of split renal function in early lupus nephritis using BOLD-MR: an initial study1The second Affiliated Hospital Guangzhou, School of Medicine, South China University of Technology, Guangzhou, China, 2Department of Radiology, Guangzhou First People’s Hospital, Guangzhou, China, 3Department of Radiology, TCM-integrated Hospital of Southern Medical University, Guangzhou, China, 4Philips Healthcare, Guangzhou, China, Guangzhou, China, 5Department of Rheumatology, Guangzhou First People’s Hospital, Guangzhou, China
Synopsis
Keywords: Kidney, fMRI, split-renal function
Lupus nephritis (LN) is one of the most severe manifestations of systemic lupus erythematosus (SLE) that can progress to end-stage kidney disease. This study aimed to detect the split-renal function changes in early-LN by using BOLD-MRI. The results demonstrated the R2*, as a biomarker for tissue oxygenation, was significantly lower in cortex and medulla in the early-LN patients compared to the healthy volunteers. Moreover, The R2* in medulla remained a considerable good power in predicting early-LN, suggesting it has the potential to be employed as a noninvasive imaging biomarker for early-LN patients with SLE.Introduction
Systemic lupus erythematosus (SLE) is a chronic multisystem autoimmune disease, in which 80% involve renal injury, known as lupus nephritis (LN), and it is also the most severe cause of morbidity and mortality for this disease.1 Therefore, early identification of renal function damage in LN is of great importance. Renal hypoxia has been reported as the main driver in pathophysiological changes underlying the progression of LN. 2 Employing BOLD-MRI, which is a noninvasive approach capable to detect oxygenation, our aim is to evaluate whether BOLD-MRI could identify the early alterations of split-renal function in LN.Methods
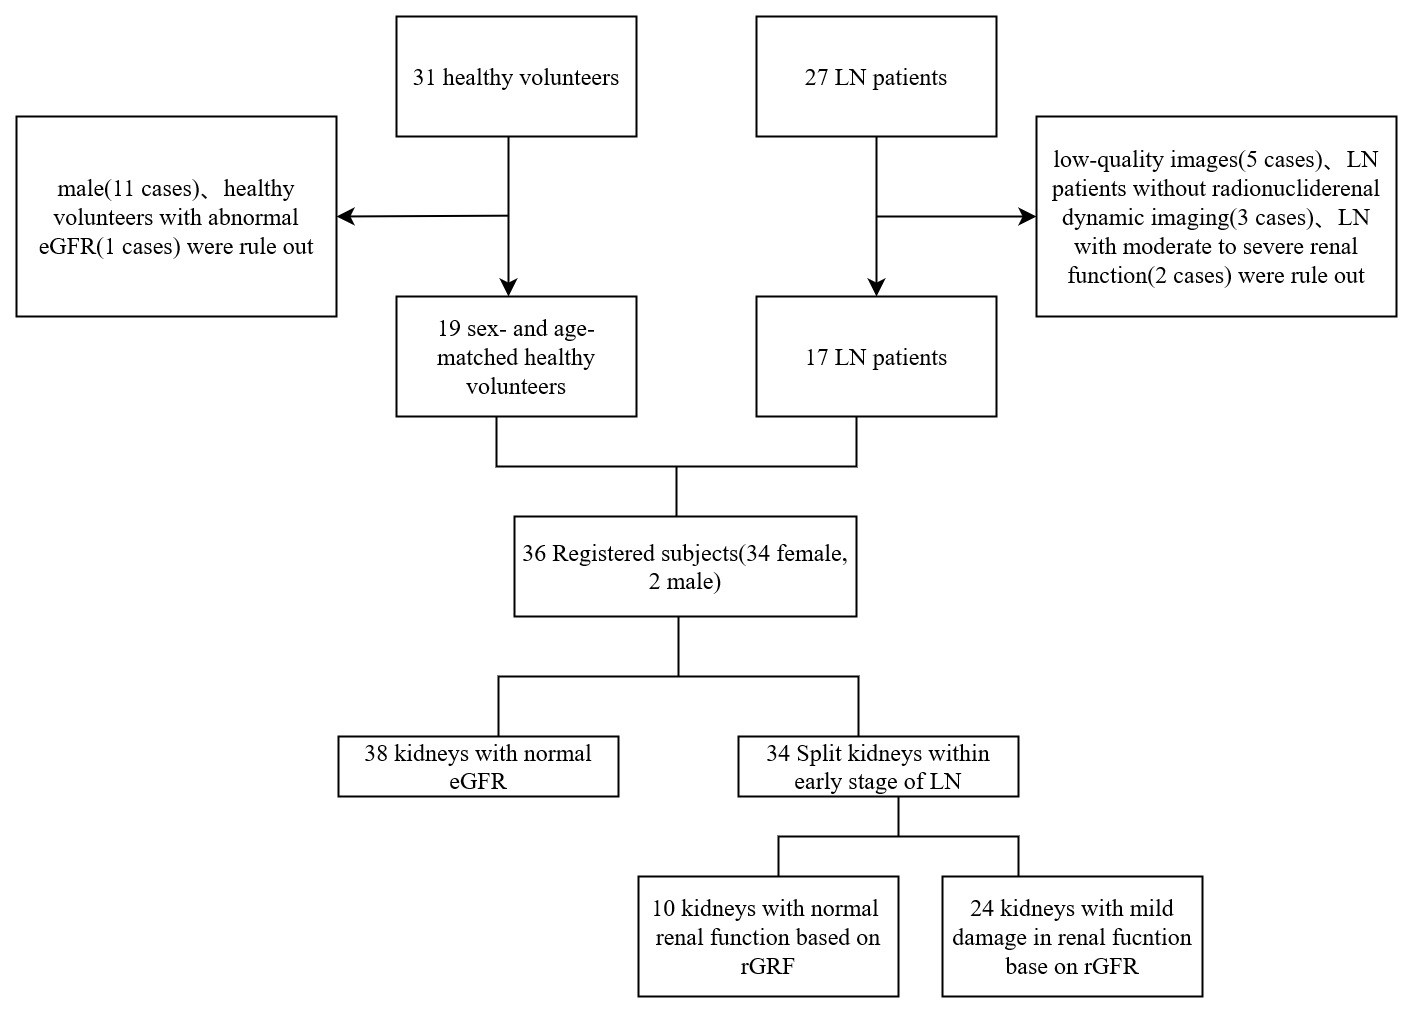
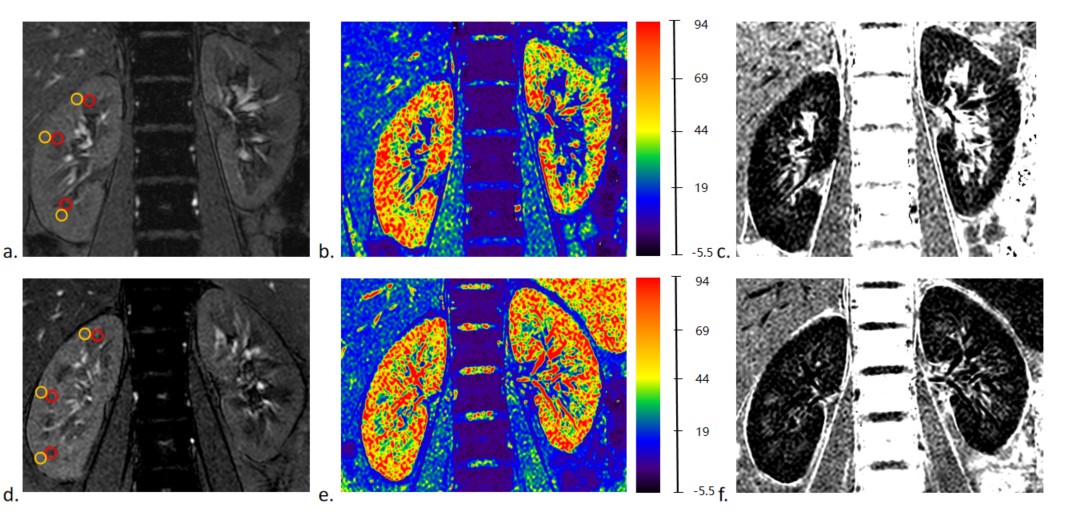
Nineteen age- and sex-matched healthy volunteers (HVs) and 17 patients with early-LN were enrolled in this study (Fig.1). All the participants were performed BOLD-MRI scans and LN patients were also performed radionuclide renal dynamic imaging. The clinical data including estimated glomerular filtration rate (eGFR), creatinine (Cr), uric acid (UA), radionuclide glomerular filtration rate (rGFR) and split-renal function were collected. Circle-shaped regions of interest (ROIs) were placed in the upper, middle and inferior poles of the renal cortex and medulla respectively, to obtain R2* values (Fig.2). To further investigate the potential of BOLD-MRI in detecting early renal function alterations compared with the radionuclide renal dynamic imaging, the early-LN patients were then divided into LN patients with normal rGFR (LN-normal group) vs. LN patients with mild decreased rGFR (LN-mild group) based on the rGFR.3Results
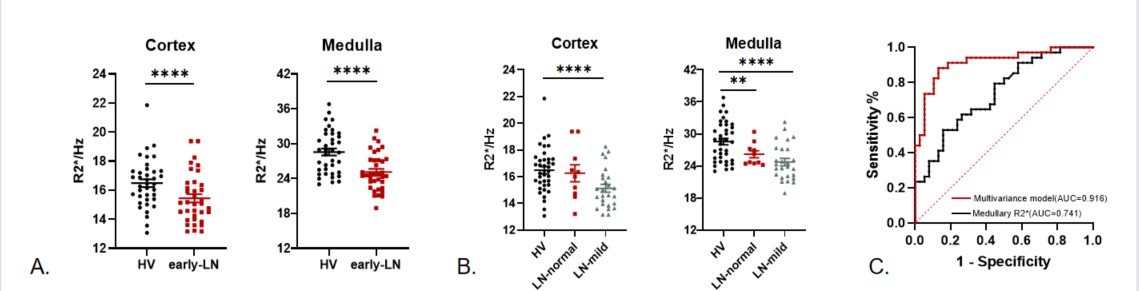
The demographic and clinical characteristics of participants were presented in Table 1.The R2* in the cortex (p=0.015) and medulla (p<0.0001) were both significantly lower in LN group (Fig.3A, B), suggesting higher oxygenation detected in early-LN.
Furthermore, to observe the associations between the indices of BOLD and early-LN, logistic regression was performed on each variable for the univariate model and combining clinical factors for the multivariate model (Table 2), the R2*_Medulla remained a stable and independent predictor for early-LN patients in both the univariate and multivariate model (Univariate: OR 0.758, 95% CI 0.645-0.890, p = 0.001; Multivariate: OR 0.765, 95% CI 0.606-0.966, p = 0.024).
The AUC (Fig.3C) of the R2*_Medulla as an independent predictor for early-LN was 0.741 (95% CI 0.628-0.853, p<0.0001). For the multivariate model, combining the R2*_Medulla, R2*_Cortex and UA these three factors together have shown the stronger power in predicting early-LN, the AUC of this model was 0.916 (95% CI 0.848-0.983, p<0.0001).
In all LN patients, only 12 patients (24 kidneys) have been detected slightly declined rGFR by radionuclide renal dynamic imaging examination, and 5 patients (10 kidneys) were with normal rGFR. The split-renal function between these two groups were not significantly different. However, the R2* in medulla have been detected significantly lower both in LN-normal and LN-mild groups, compared to the HVs group.
Discussion
In this study, we found that the R2* in medulla was significantly lower in patients in any LN group (early-LN, LN-normal and LN-mild group), and this index was a significant predictor for early-LN in univariate and multivariate model. This result indicates that the R2* in medulla has the potential being an imaging biomarker for early-LN patients in SLE.Although glomerulonephritis is the main pathological damage of LN, recent research has observed tubulointerstitial injury can also exacerbate renal function in LN, and this mainly could be reflected through hypoxia.4 Our study demonstrated the R2* in the medulla and cortex is significantly lower, suggesting higher tissue oxygenation detected in early-LN. This is consistent with the hypothesis that the reduced metabolism and oxygen consumption lead to disturbed tubular reabsorption processes which caused the higher tissue oxygenation in early-LN, according to previous studies.5 Thus, decreased R2* would represent an imaging marker of early tubulonecrosis which could be observed in early-LN. Furthermore, the R2* in medulla maintained a strong association with early-LN in the univariate and multivariate model. The AUC results showed that R2* in medulla as an independent predictor had good predict power; when combined with the clinical factors, the multivariate model demonstrated stronger predict power for early-LN. The findings indicate the potential possibility of R2* as an imaging biomarker for early-LN among SLE patients.
Besides, when dividing the early-LN patients into LN-normal and LN-mild group based on the rGFR, only 12 patients (24 kidneys) have been detected slightly declined rGFR and 5 patients (10 kidneys) were with normal rGFR. The split-renal function between these two groups was not significantly different. However, the R2* in medulla have been detected as significantly different both in LN-normal and LN-mild groups, compared to the HVs group. The findings indicate the R2* has a higher sensibility to detecting the renal functional changes in the early stage of LN.
Conclusion
BOLD-MRI has the capacity to detect and quantify the split-renal functional changes in early-LN and the index-R2* could probably be an imaging biomarker for detecting early-LN in SLE. Moreover, it demonstrated a considerable potential with higher sensitivity than radionuclide renal dynamic imaging in detecting the split-renal functional changes with early-LN in this study. The finding needs to be further investigated through more extensive longitudinal study.Acknowledgements
This study was funded by the National Natural Science Foundation of China (81971574, 82271938), the Natural Science Foundation of Guangdong Province (2021A1515011350), the Guangdong Basic and Applied Basic Research Foundation (2021A1515220060), the Science and Technology Project of Guangzhou (202102010025), Guangzhou Key Laboratory of Molecular Imaging and Clinical Translational Medicine (202201020376).References
1. Anders HJ, Saxena R, Zhao M hui, Parodis I, Salmon JE, Mohan C. Lupus nephritis. Nat Rev Dis Primers. 2020;6(1):7.
2. Palm F, Nordquist L. Renal tubulointerstitial hypoxia: Cause and consequence of kidney dysfunction: Renal tubulointerstitial hypoxia. Clinical and Experimental Pharmacology and Physiology. 2011;38(7):474-480.
3. Blaufox MD, Aurell M, Bubeck B, et al. Report of the Radionuclides in Nephrourology Committee on renal clearance. J Nucl Med. 1996;37(11):1883-1890.
4. Yu F, Haas M, Glassock R, Zhao MH. Redefining lupus nephritis: clinical implications of pathophysiologic subtypes. Nat Rev Nephrol. 2017;13(8):483-495.
5. Diffusion weighted imaging and blood oxygen level-dependent MR imaging of kidneys in patients with lupus nephritis - PubMed. Accessed November 8, 2022.
Figures
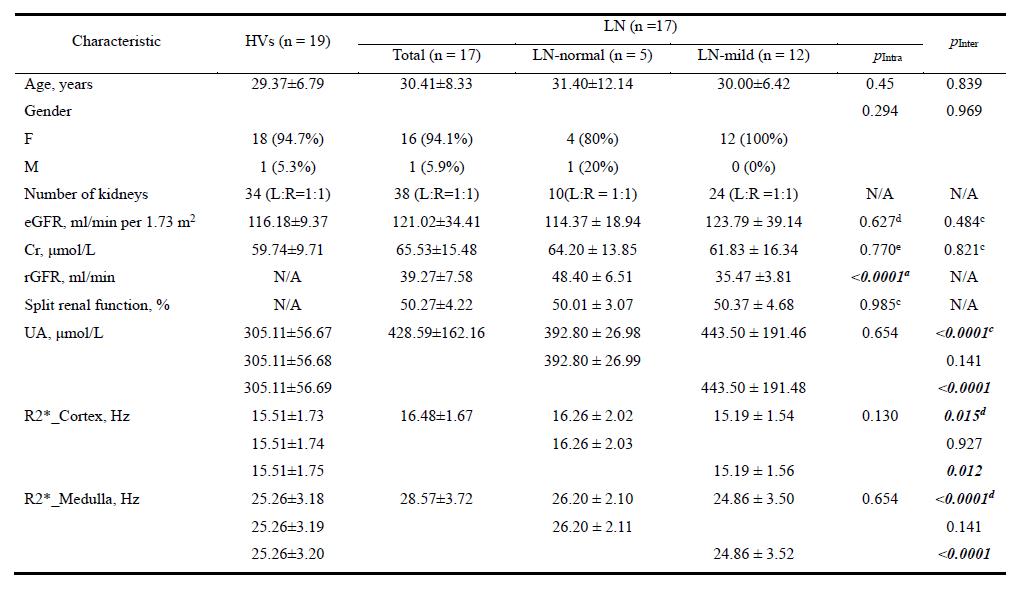
Table 1. The baseline characteristics and BOLD-MRI indices of participants
Continuous variables were reported as mean ± standard deviation and categorical variables as numbers (proportion). a Student’s t-test; b Chi-squared test; c Mann-Whitney U test; d One way ANOVA test; e Kruskal-Wallis H test; eGFR = estimated glomerular filtration rate, Cr = creatinine, UA = Uric Acid, rGFR = radionuclide glomerular filtration rate; pIntra represents the comparison between LN-normal group and LN-mild group, pInter represents the comparison between HVs group and LN group.
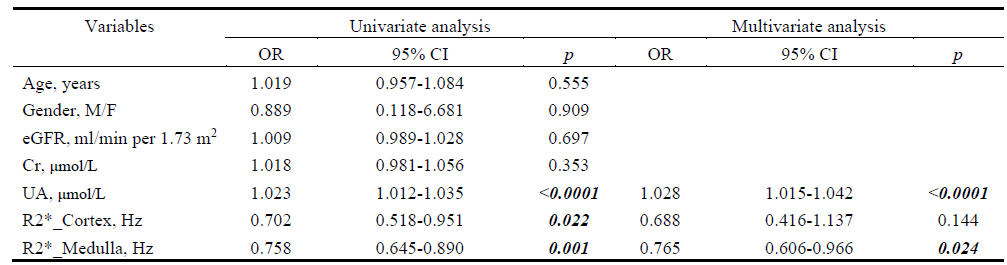
Table 2. The Univariate and Multivariate models for predicting LN patients
eGFR = estimated glomerular filtration rate, Cr = creatinine, UA = Uric Acid