3809
Kidney T2 can be used as a biomarker for disease progression and functional decline in mouse models of polycystic kidney disease1Calico Life Sciences, South San Francisco, CA, United States
Synopsis
Keywords: Kidney, Kidney
We investigated quantitative T2 mapping as an MRI biomarker for disease progression in mouse models of autosomal dominant polycystic kidney disease and its correlation with kidney function. Our results show a good correlation between the fraction of the kidney tissue with elevated T2 and cyst load quantified by histology. There was also a good correlation between high T2 values and kidney function decline indicated by reduced glomerular filtration rates.
Introduction
Autosomal Dominant Polycystic Kidney Disease (ADPKD) is rare disease caused by polycystin mutations and is characterized by the development of slowly growing fluid-filled cysts in both kidneys that can lead to end-stage renal disease. Since kidney function declines late in the disease process, total kidney volume (TKV) has been approved as a surrogate endpoint for accelerated approval in autosomal dominant polycystic kidney disease. Preclinical MRI can accurately quantify TKV and renal cyst development1,2. We have previously published our approaches for high resolution anatomical mouse kidney MRI and automatic kidney segmentation for accurate TKV measurements3. Beyond TKV measurements, MRI offers access to a wide variety of parameters to quantify various changes in tissues associated with disease progression. Recently, T1 and T2 quantifications have been shown to correlate with disease progression in the closely related Autosomal Recessive Polycystic Kidney Disease, both in mouse models and clinically4. Here, we investigate the correlation between T2 changes in two different mouse models of ADPKD with TKV and glomerular filtration rates (GFR) to evaluate if T2 mapping can serve as a useful biomarker for ADPKD progression.Methods
All animal procedures were approved by the IACUC and followed AAALAC guidelines. Animals received a SC injection of 0.4 mg/kg atropine approx. 20 minutes before imaging to slow down peristaltic motion. Mice were anesthetized with isoflurane (2%) and kept at 37±0.5°C. Imaging was performed with a 9.4T Bruker BioSpec (Bruker, Ettlingen, Germany). Animals were placed supine, with their abdomen on a 4-channel cardiac receiver array in a 86mm transmit/receive volume coil. We performed MRI on two models of polycystic kidney disease: Pkd1RC/RC mice, a slowly progressing genetic model for ADPKD, and a doxycycline-induced conditional knockout model for PKD1: Pkd1fl/fl;Pax8rtTA;TetO-cre (courtesy of the Peter Jackson lab at Stanford), and some C57BL/6J mice as healthy controls. Anatomical images were acquired for TKV measurement with an improved resolution3 compared to previous publications. To acquire T2 maps, a multi-SE-series was acquired (0.16×0.16×0.8 mm3, 5 slices, 10 TEs from 12.5 to 192.5 ms, TR=1.05s, acquisition time around 3 minutes). Automatic segmentation was used to mask kidneys in images, and T2 maps were calculated by fitting a voxel wise nonlinear exponential decay using MATLAB.Glomerular filtration rates (GFR) were determined by measuring the transdermal fluorescence signal of a dye (FITC-sininstrin) undergoing renal clearance (MediBeacon transdermal mini GFR monitor, MediBeacon, St. Louis, MO, USA). For the GFR measurement, the flank was shaved under isoflurane, the transcutaneous GFR monitor was taped to the flank, and background signal was recorded for 3 mins. Then, one drop of ophthalmic anesthetic (0.5% proparacaine hydrochloride ophthalmic solution) was administered to one eye, and 0.075 mg/g BW of FITC-sinistrin in approx. 50 ul of sterile PBS were injected retro-orbitally. Animals were placed in a clean cage each and data were recorded for 1.5-2 h. At the end of the recording, animals were anesthetized again for removal of the GFR monitor.
Recorded data were analyzed in the vendor’s software to obtain GFR estimates.
Results
Both ADPKD models showed strongly different rates of disease progression, indicated by TKV and T2 increase (Fig. 1). T2 quantification were utilized in two ways: by calculating mean T2 for every kidney, and by measuring the fraction of the kidney volume where voxels showed elevated T2 values (>80ms).Mean kidney T2 and elevated T2 volume fraction were non-linearly correlated for both ADPKD models and wildtype control mice (Fig 2 A). Progression to high T2 values was particularly prevalent in Pkd1fl/fl mice. A good correlation was observed between elevated T2 fraction and cystic area determined from histological slides (R2=0.84). Elevated T2 fraction has systematic offset when compared to cystic area estimates from histology (Fig. 2 B). Mean T2 increased with increasing TKV in both models (Fig 2 C,D), with higher variability in the Pkd1RC/RC mice (R2=0.51), and mean T2 reaching a plateau above TKVs of over 2000 mm3 in the Pkd1fl/fl model (R2=0.86). GFR measurements showed high variability, but were correlated with both elevated T2 fraction and mean T2 (R2=0.49 and 0.47, respectively, Fig 2 E,F). GFR appeared normal approximately up to a mean T2 of 80 ms or less than 40% of elevated T2 fraction, respectively, and declined for higher values.
Discussion and Conclusion
Cyst load measured from histology and kidney T2 measurements showed good correlation, indicating that kidney cyst load can be accurately predicted by in vivo T2 mapping. Volume fraction of the kidneys with elevated T2 were larger than cystic fractions measured by histology, which is likely due to partial volume effects overestimating cystic load. Measured GFR decline was correlated with increased mean T2 and higher elevated T2 fractions. Kidney T2 measurements are a promising biomarker for ADPKD progression in mouse models.Acknowledgements
We thank Art Nikkel, Holly Robb, Tim Vortherms and Kathy Mortell for the histology quantification, and Andrew Stafford for excellent support with kidney segmentations. The Pkd1RC/RC mice were provided by the Eduardo Chini lab at the Mayo Clinic, Rochester, MA, USA, and the model was developed by Dr. Peter C. Harris, Mayo Clinic, Rochester, MA, USA. The Pkd1fl/fl;Pax8rtTA;TetO-cre mice were provided by the Peter Jackson lab at Stanford, CA, USA, and uses Pkd1 flox/flox mice developed by Dr. Stefan Somlo, Yale, Pax8 developed by Dr. Robert Koesters, German Cancer Research Center (DKFZ), Heidelberg, Germany, and TetO-cre developed by Dr. Andras Nagy, Mount Sinai Health System, NY, USA.
References
1 Kidney International (2008) 73, 778–781; doi:10.1038/sj.ki.5002771;
2 Kidney International (2004) 65, 1511-1516; doi:10.1111/j.1523-1755.2004.00532.x
3 Pediatr Res. 2020 Apr 13; doi: 10.1038/s41390-020-0883-9
4 Proc ISMRM 2022, abstract #2320
Figures
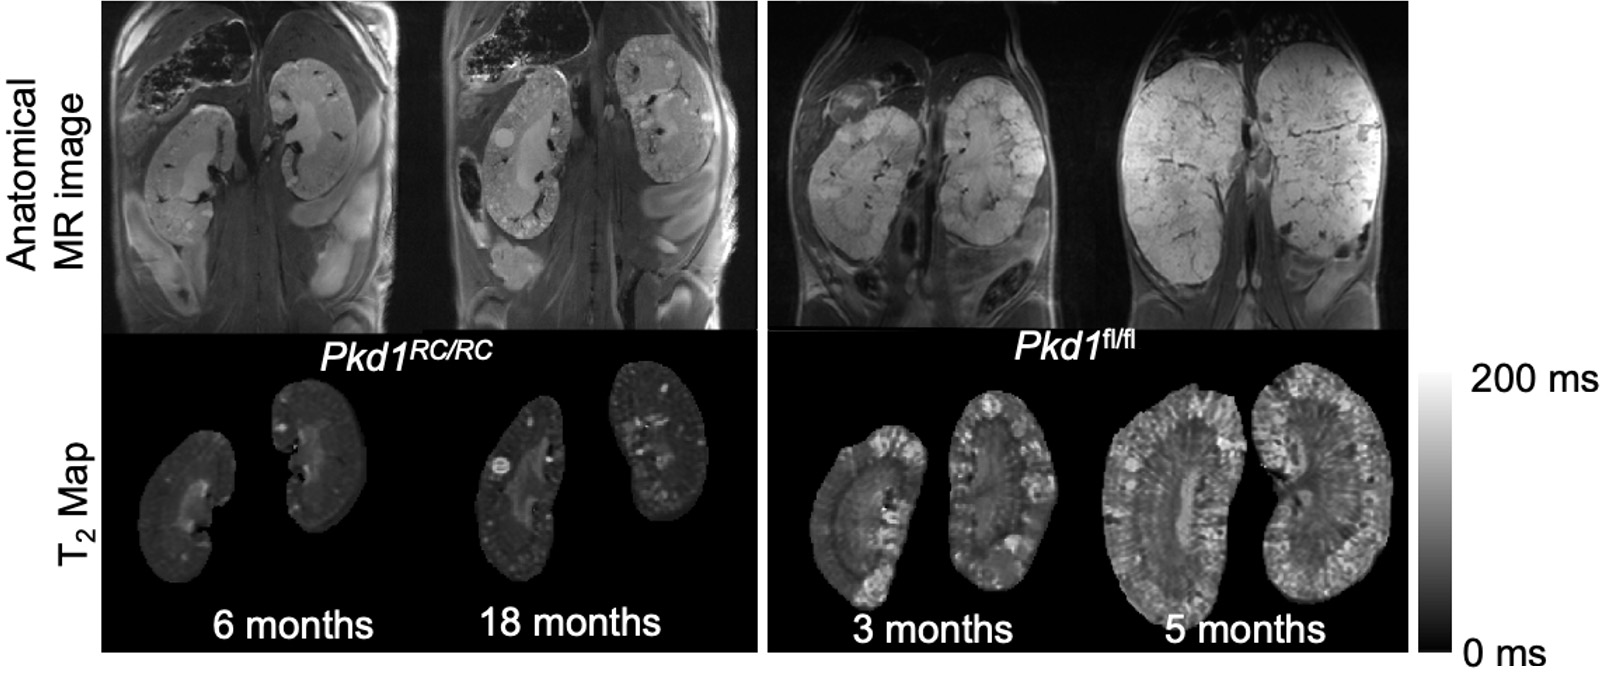
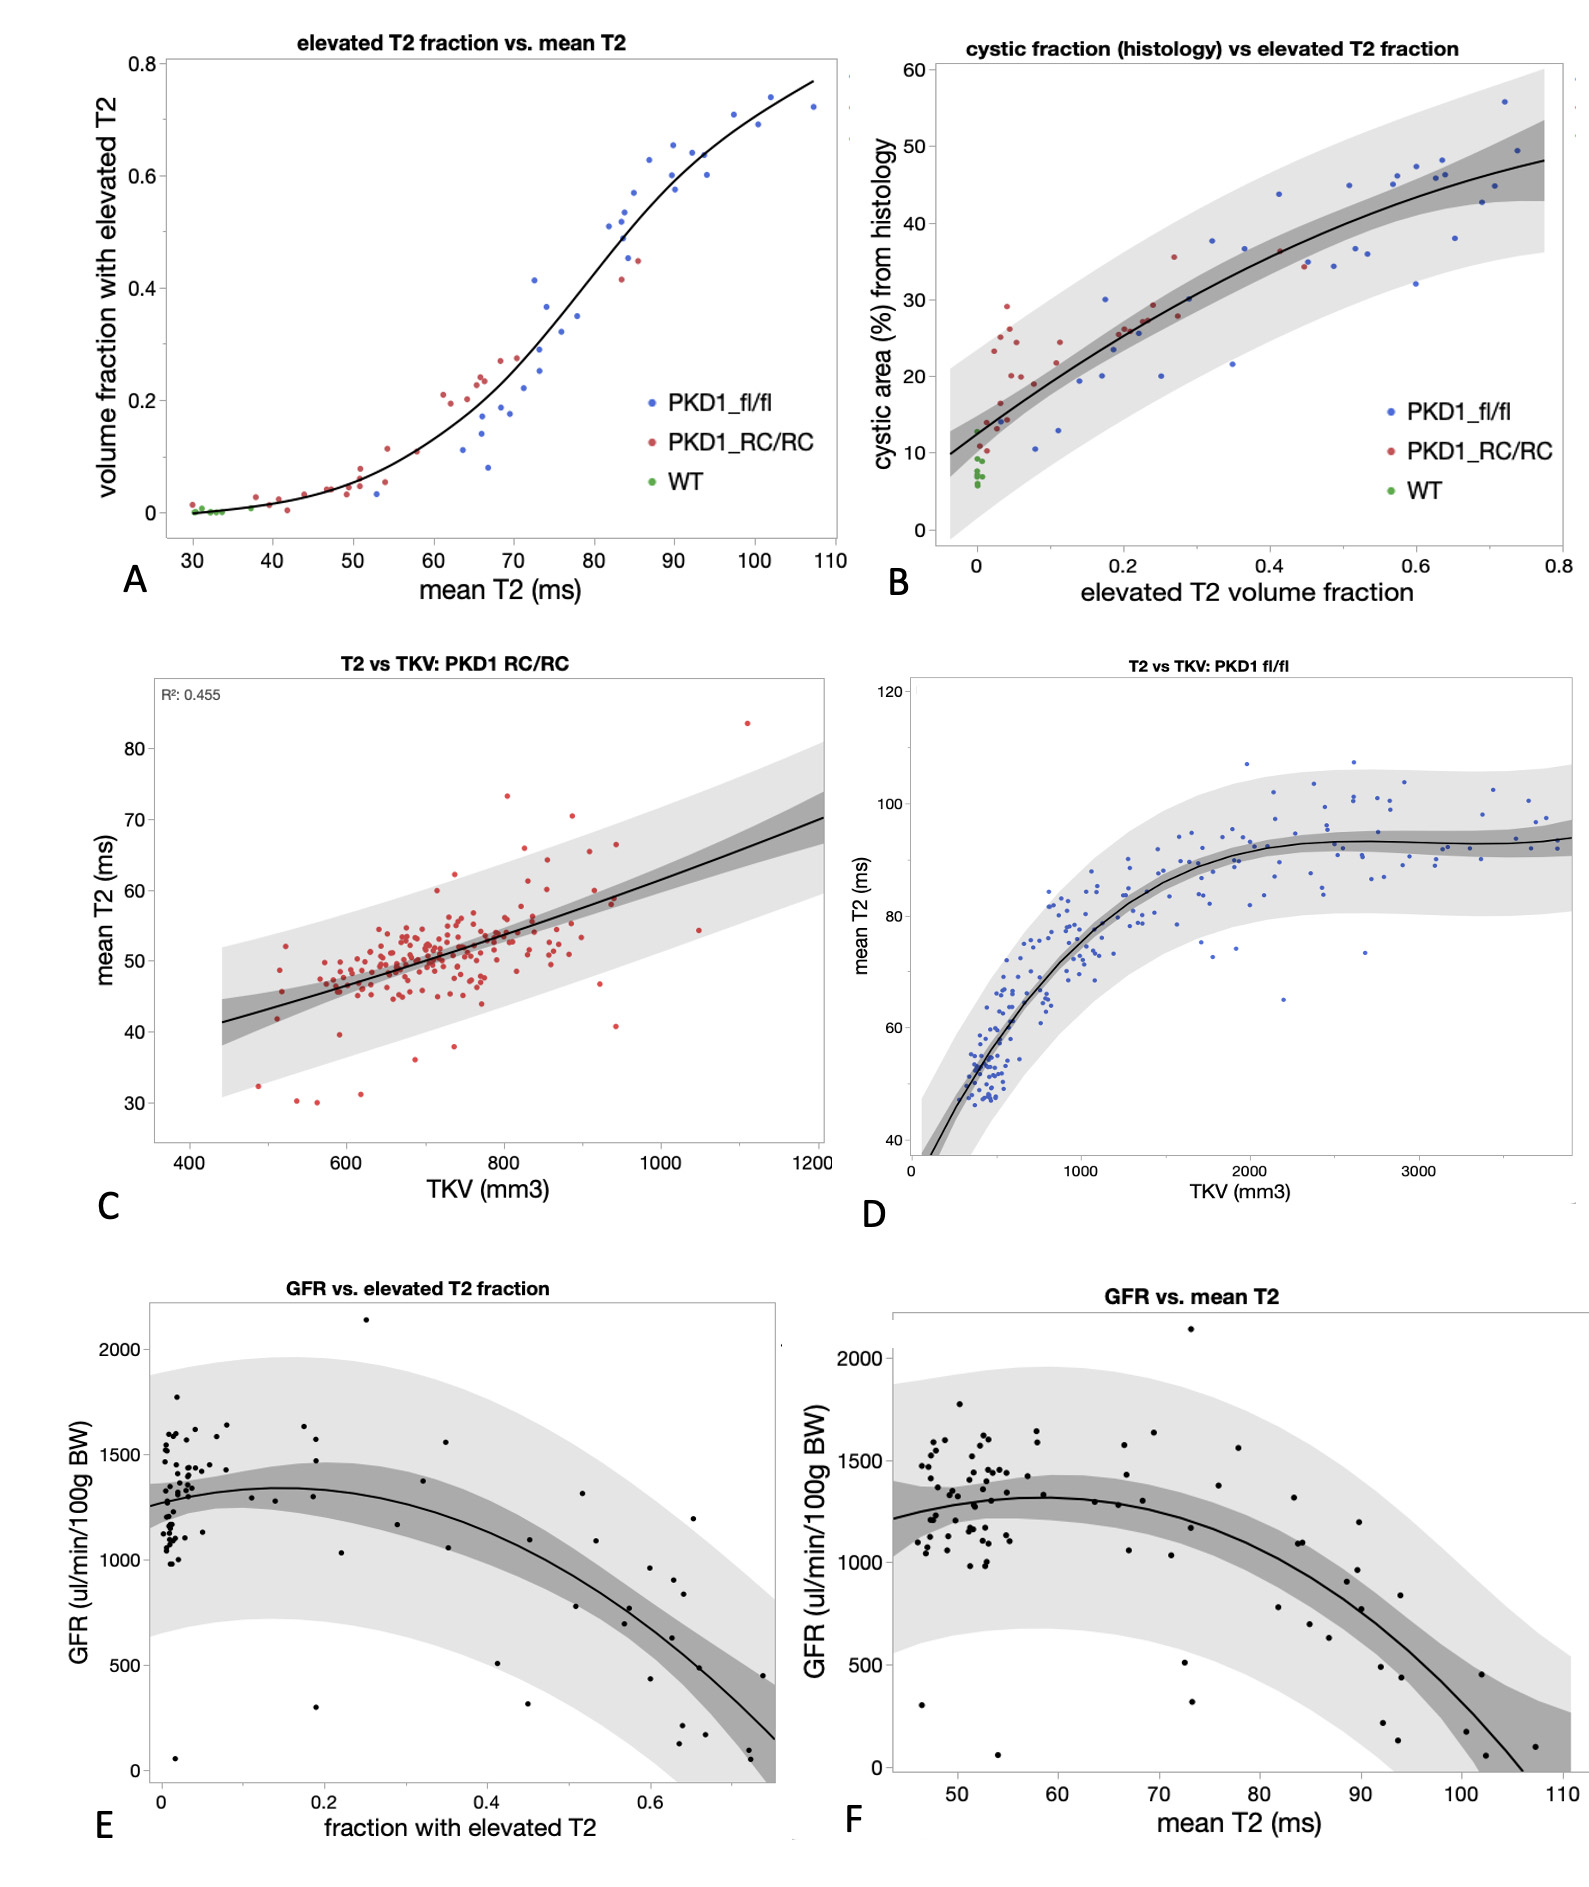
Fig. 2: Correlations between mean T2, fraction of the kidney volume showing elevated T2 (>80 ms), TKV, GFR, and cyst fraction measured from histological sections. 95% Confidence intervals for cubic polynomial fit (darker gray) and data point range (lighter gray).