3807
Correlation between Shifted Apparent Diffusion Coefficient of the Renal Parenchyma and Estimated Glomerular Filtration Rates: A Pilot Study1Osaka University Graduate School of Medicine, Suita, Japan
Synopsis
Keywords: Kidney, Diffusion/other diffusion imaging techniques
This retrospective study investigated the correlation between shifted apparent diffusion coefficient (sADC) of the kidney measured using diffusion-weighted imaging obtained with b = 200, 1500 and estimated glomerular filtration rates (eGFR), and the performance in discriminating patients with impaired renal function was compared between sADC and ADC. sADC of the renal cortex showed the highest correlation coefficient in correlation with eGFR. In discriminating cases with eGFR <45, <60, or <90, sADC of renal cortex showed higher area under the curve compared to ADC, although the difference was not significant. sADC might be more useful in predicting renal function than ADC.Introduction
Various methods for assessing renal function using MRI have been reported, including contrast-enhanced dynamic MRI1, diffusion-weighted imaging (DWI)2, 3, and blood oxygenation level dependent (BOLD)-MRI4. In recent years, DWI is routinely obtained in abdominal MRI in daily clinical practice, allowing measurement of apparent diffusion coefficient (ADC), and it has been reported that ADC correlates with renal function2, 3. Recently, it has been reported that the shifted ADC (sADC) measured using DWI with b = 200, 1500 correlates with the share modulus of the liver measured by MR elastography and enables the estimation of fibrosis, which is called "virtual elastography”5, 6. sADC is also expected to change in the kidney with renal dysfunction or fibrosis. The purpose of this study was to investigate the correlation between sADC of the renal parenchyma and estimated glomerular filtration rates (eGFR), and compare the diagnostic performance for identifying patients with impaired renal function between ADC and sADC.Methods
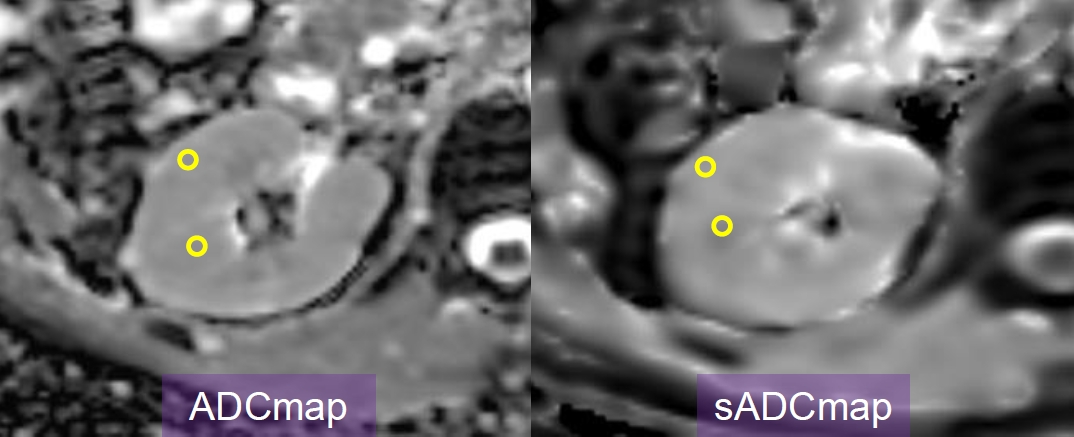
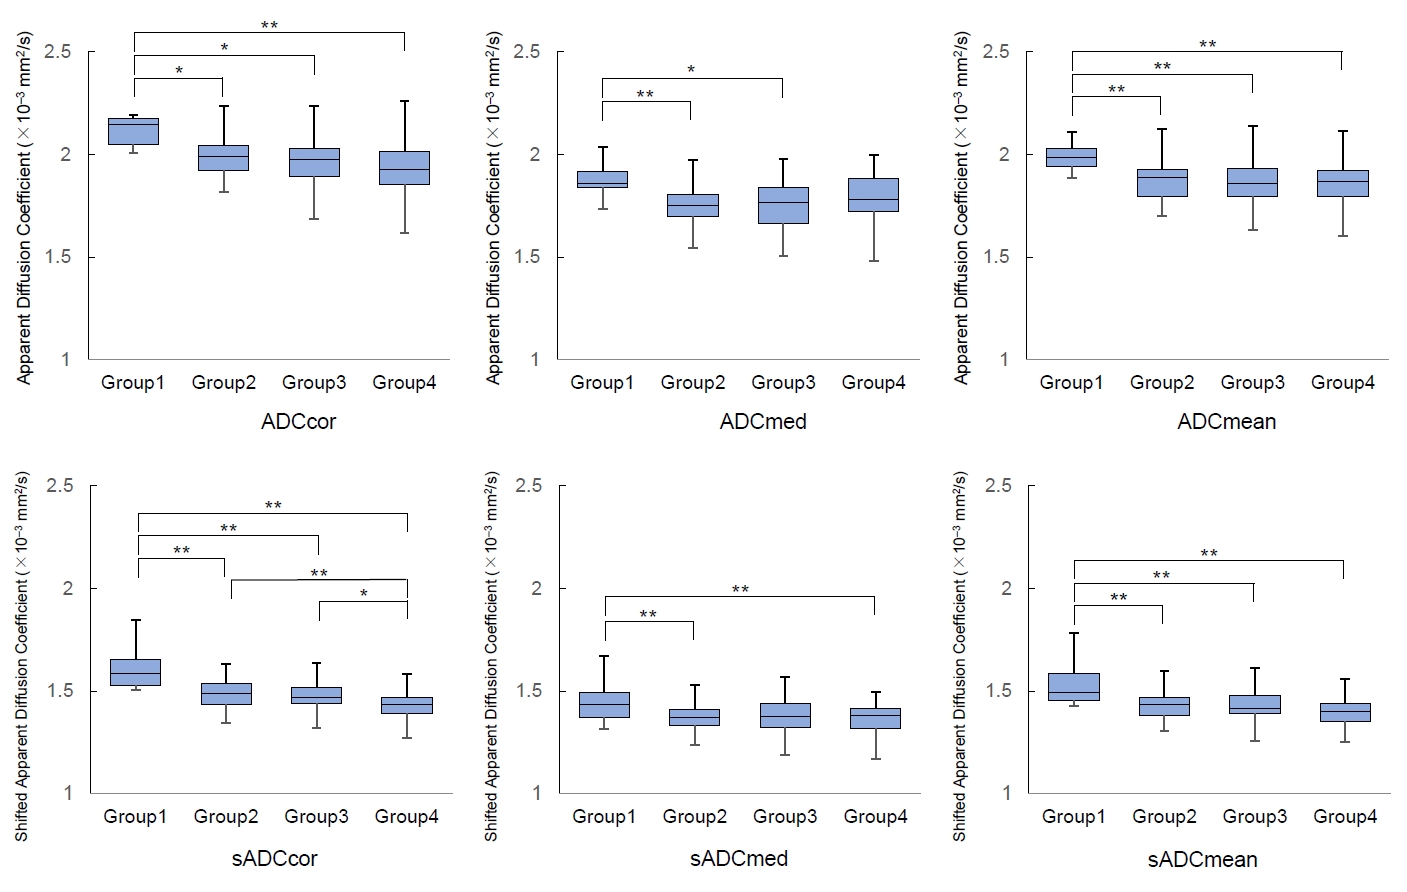
This retrospective study was approved by our institutional review board, and the requirement for the written informed consent was waived. One hundred twenty-three patients who were suspected of having a hepatic disease and underwent abdominal MRI including DWI obtained with 2 different b-value combinations (b = 0, 800 and b = 200, 1500) were enrolled in this study. DWI of b = 0, 800 was acquired using respiratory-triggered technique, with TR/TE of 12000/50 msec, NEX of 3, slice thickness/gap of 5/2 mm, matrix size of 128 × 128, and FOV of 360 × 395 mm. DWI of b = 200, 1500 was acquired using breath-hold technique, with TR/TE of 3500/60 msec, NEX of 1, slice thickness/gap of 7/2 mm, matrix size of 64 × 64, and FOV of 360 × 395 mm. ADC maps and sADC maps were created using DWI (b = 0, 800) and DWI (b = 200, 1500), respectively. In each of the ADC map and sADC map, three ROIs of 10 mm2 were placed on the cortex and medulla of both kidneys, respectively (Figure 1), and the average ADC and sADC values were measured. The correlation with eGFR for each of the following six ADC values was examined using Spearman's rank correlation coefficient; ADC of the cortex (ADCcor), ADC of the medulla (ADCmed), mean ADC for cortex and medulla (ADCmean), sADC of the cortex (sADCcor), sADC of the medulla (sADCmed), and mean sADC for cortex and medulla (sADCmean). Based on eGFR, patients were divided into four groups (Group 1, eGFR> 90; Group 2, eGFR = 90–60; Group 3, eGFR = 60–45; and Group 4, eGFR < 45). ADC and sADC were compared among groups using one-way ANOVA with Bonferroni correction. The receiver operating characteristic (ROC) analyses were performed to evaluate the diagnostic performance to differentiate Group 1 from Groups 2–4, Groups 1/2 from Group 3/4, and Groups 1–3 from Group 4.Results
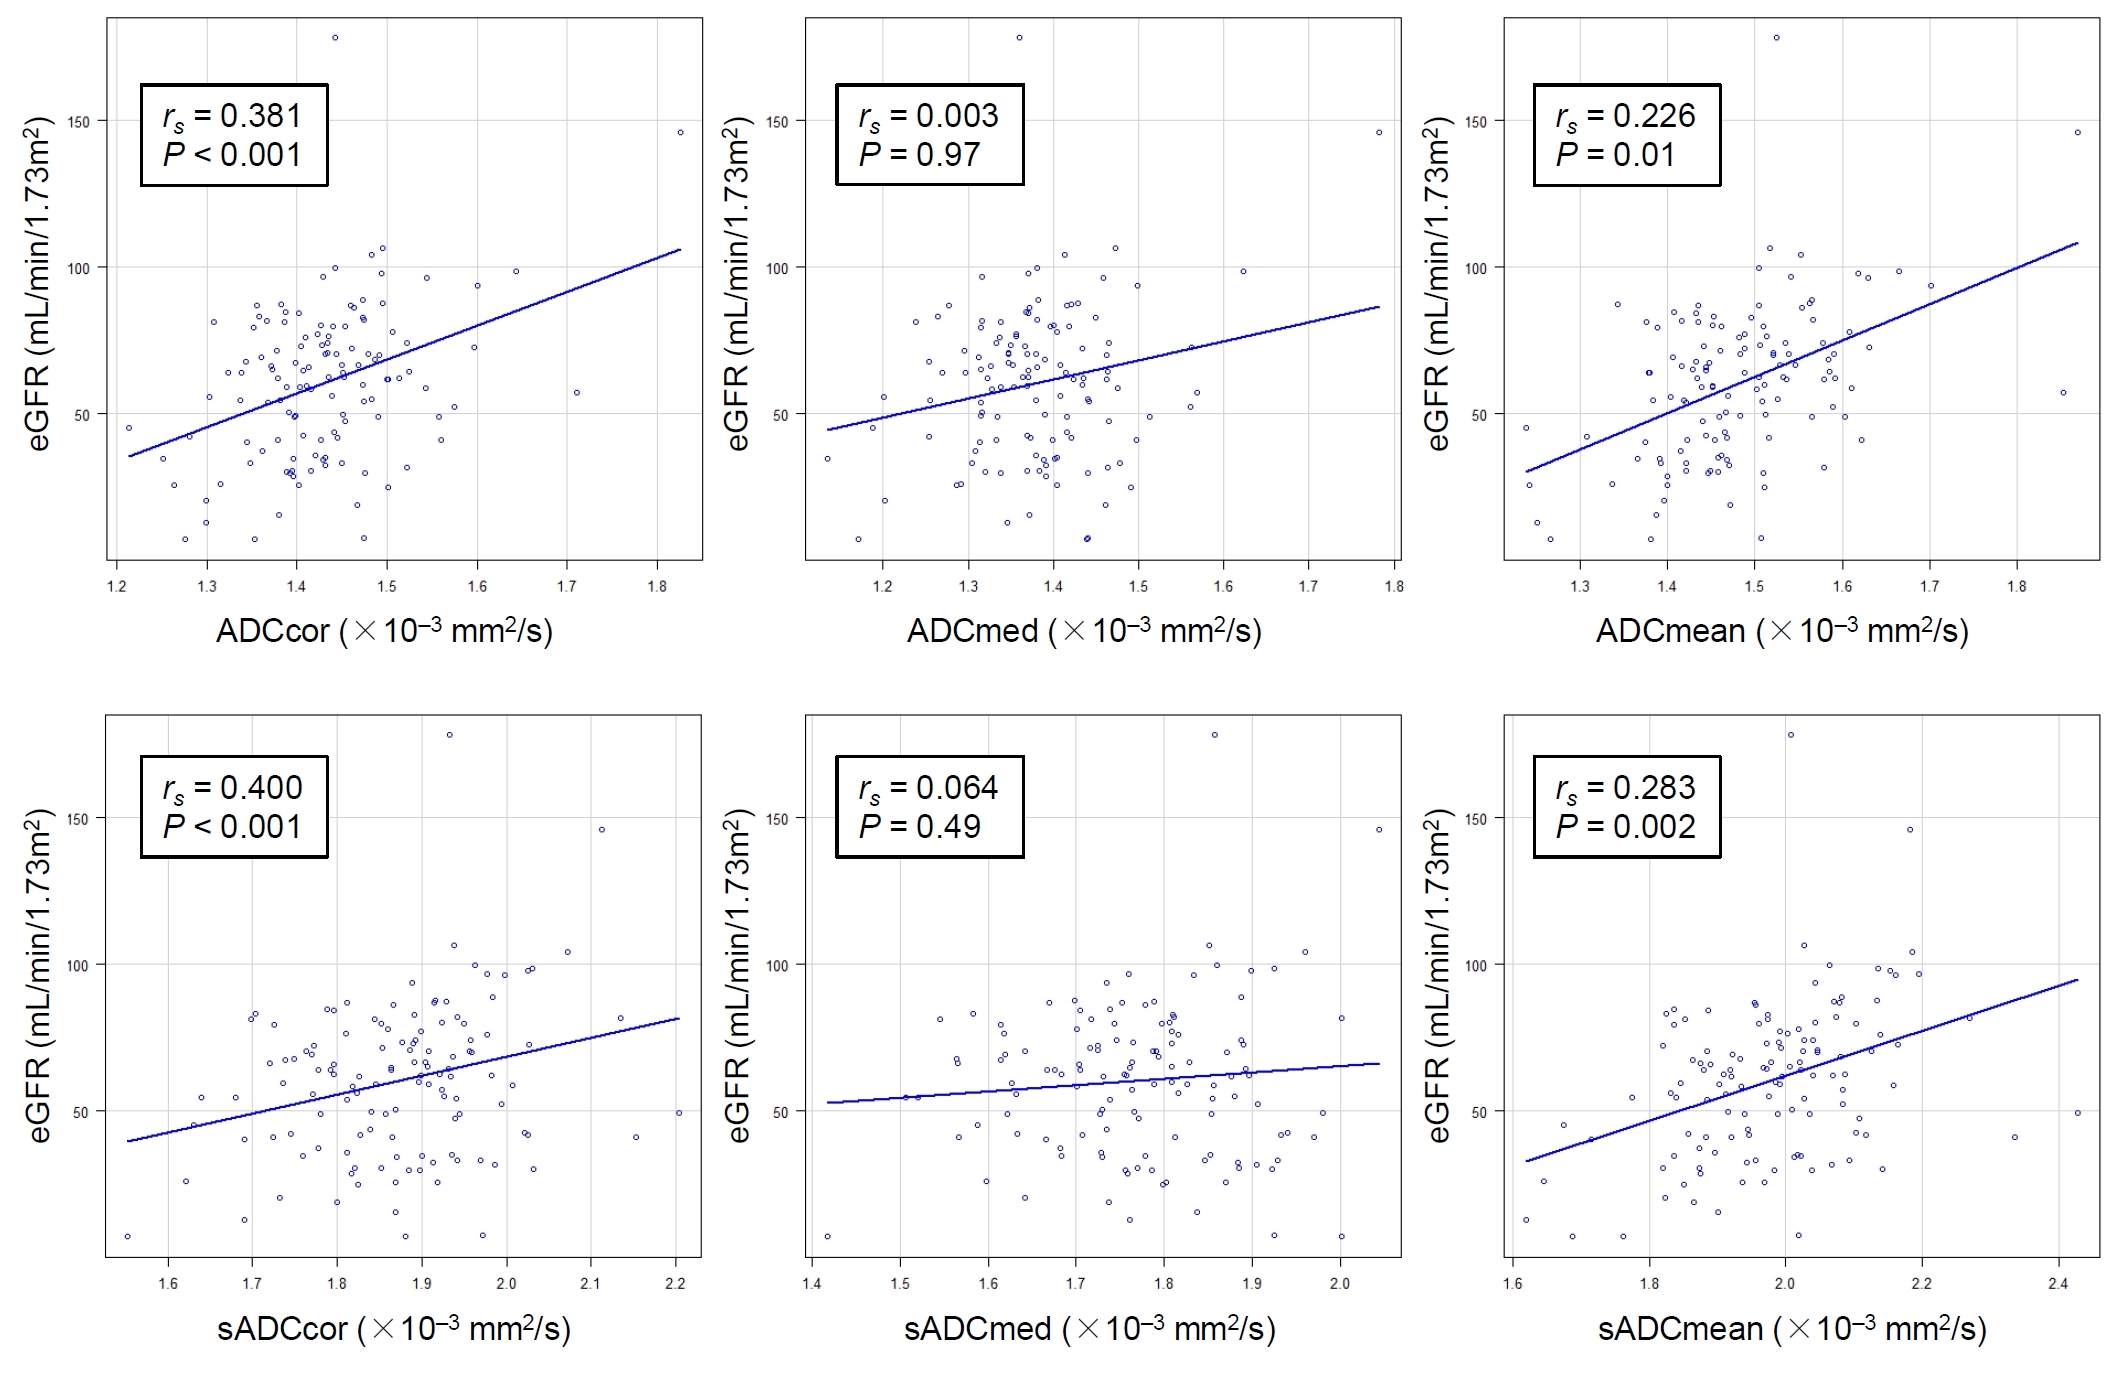
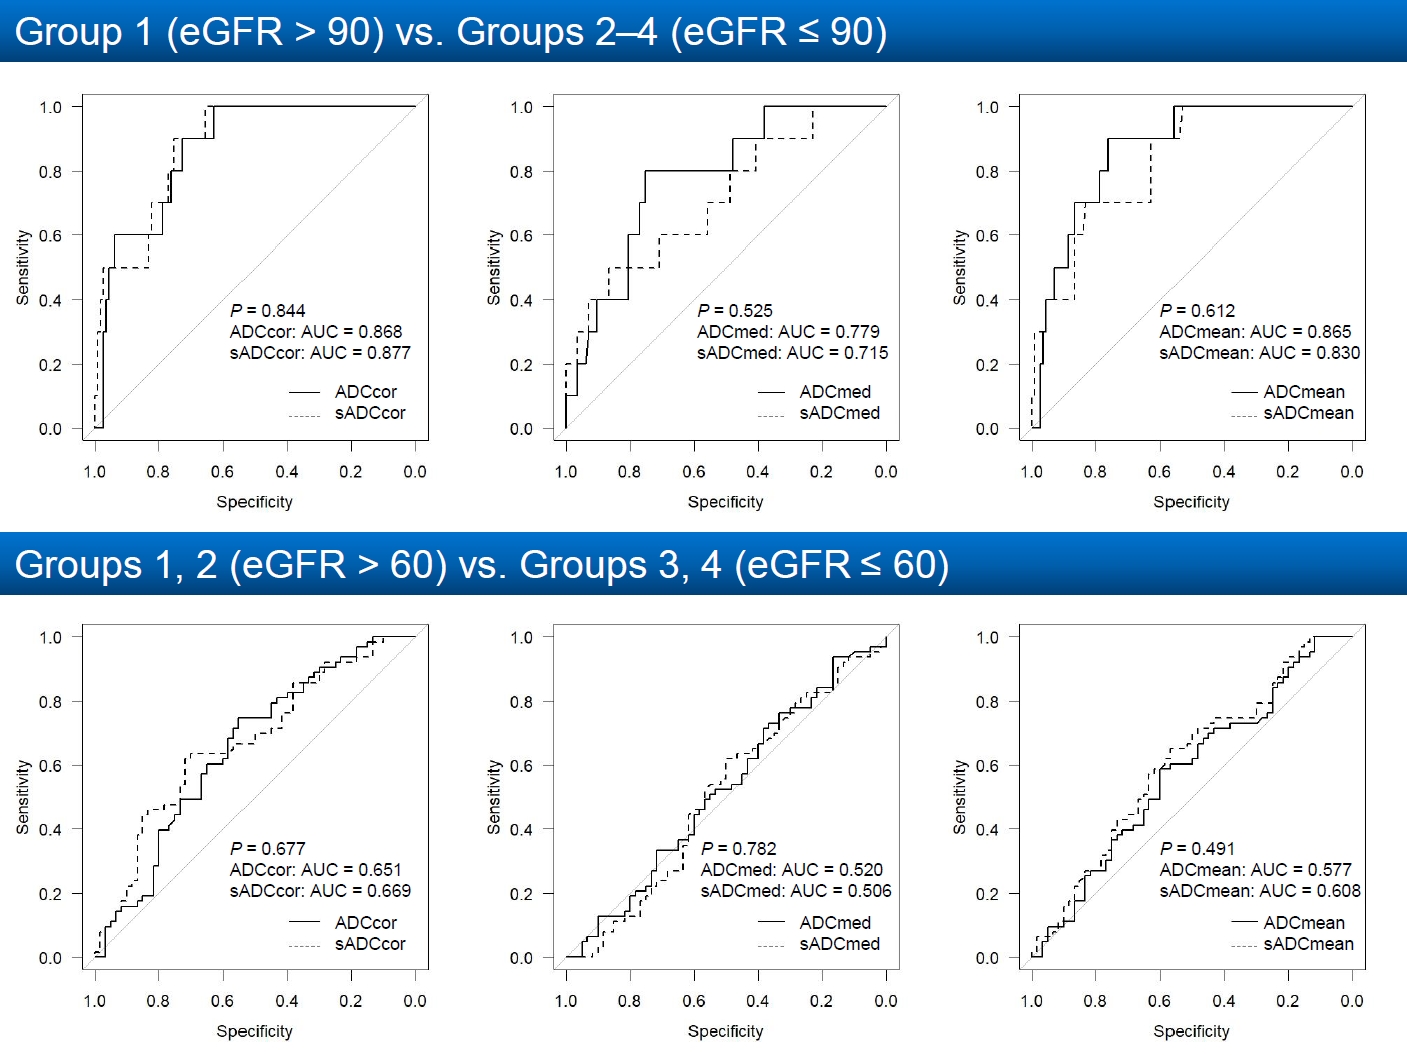
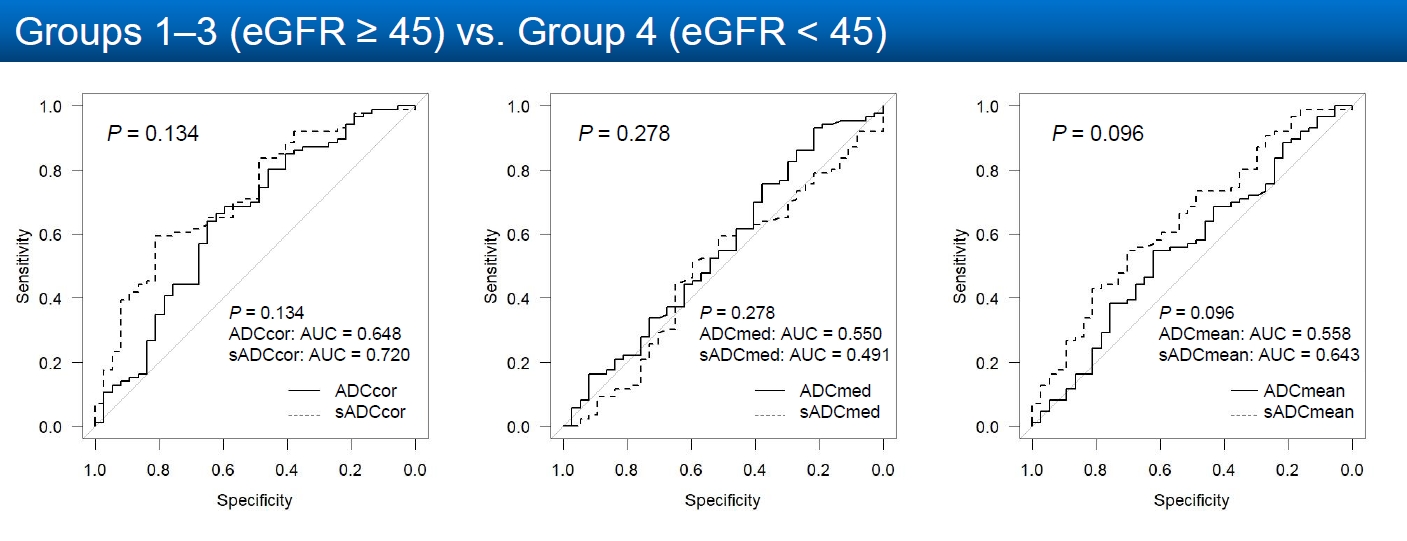
ADCcor, ADCmean, sADCcor, and sADCmean were all significantly correlated with eGFR (P < 0.05), whereas ADCmed and sADCmed were not significantly correlated with eGFR (P = 0.97 and 0.49, respectively) (Figure 2). The correlation coefficient was highest for sADCcor (rs = 0.400), followed by ADCcor (rs = 0.381). ADCcor, ADCmean, sADCcor, and sADCmean were all significantly higher in Group 1 than in any of the other groups (P < 0.05) (Figure 3). sADCcor was significantly lower in Group 4 than in the other groups (P < 0.05). Significant differences were found between Group 1 and Group 2 or 3 in ADCmed and between Group 1 and Group 2 or 4 in sADCmed. sADCcor had the highest area under the curve (AUC) in all the Group 1 vs. Groups 2-4, Groups 1/2 vs. Group 3/4, and Groups 1-3 vs. Group 4 differentiations, although none of the differences in AUC were statistically significant between sADCcor and ADCcor (Figure 4, 5).Discussion
Our results showed that all ADCcor, ADCmean, sADCcor, and sADCmean were significantly correlated with eGFR, with sADCcor demonstrating the highest correlation coefficient. In discriminating cases with eGFR <45, <60, or <90, sADCcor showed higher AUC compared to ADCcor, although the difference was not significant. Therefore, decreased sADCcor might most accurately reflect decreased renal function and is potentially more useful than ADC in predicting renal function. In the present study, both ADCcor and sADCcor showed high AUC in discriminating cases with eGFR <90 (0.868 and 0.877, respectively), suggesting that they may be useful in detecting reduced renal function at an early stage. This was a retrospective study, and the acquisition parameters were different for DWI of b = 0, 800 and b = 200, 1500. Further studies using a larger number of patients with the same acquisition parameters will be needed to validate the usefulness of sADCcor in the evaluation of renal function. The utility of this value in the evaluation of split renal function will also need to be investigated in the future.Conclusion
The correlation coefficient between sADC of the renal cortex and eGFR was higher than that between the ADC of the renal cortex and eGFR, suggesting that sADC may be more useful in predicting renal function than ADC.Acknowledgements
No acknowledgement found.References
1. Buckley DL, Shurrab AE, Cheung CM, Jones AP, Mamtora H, Kalra PA. Measurement of single kidney function using dynamic contrast-enhanced MRI: comparison of two models in human subjects. J Magn Reson Imaging. 2006 24:1117-1123.
2. Toya R, Naganawa S, Kawai H, Ikeda M. Correlation between estimated glomerular filtration rate (eGFR) and apparent diffusion coefficient (ADC) values of the kidneys. Magn Reson Med Sci. 2010 9:59-64.
3. Thiravit S, Suwanchatree P, Skulratanasak P, Thiravit P, Suvannarerg V. Correlation Between Apparent Diffusion Coefficient Values of the Renal Parenchyma and Estimated Glomerular Filtration Rates on 3-T Diffusion-Weighted Echo-Planar Magnetic Resonance Imaging. J Comput Assist Tomogr. 2019 43:780-785.
4. Li C, Liu H, Li X, Zhou L, Wang R, Zhang Y. Application of BOLD-MRI in the classification of renal function in chronic kidney disease. Abdom Radiol. 2019 44:604-611.
5. Le Bihan D, Ichikawa S, Motosugi U. Diffusion and Intravoxel Incoherent Motion MR Imaging-based Virtual Elastography: A Hypothesis-generating Study in the Liver. Radiology. 2017 285:609-619.
6. Kromrey ML, Le Bihan D, Ichikawa S, Motosugi U. Diffusion-weighted MRI-based Virtual Elastography for the Assessment of Liver Fibrosis. Radiology. 2020 295:127-135.
Figures