3801
Three-Dimensional Multifrequency MR Elastography: clinical application for Chronic Kidney Disease
Shan Pi1, Jonathan M. Scott2, Yin Li3, Huiquan Wen1, Matthew C. Murphy2, Jingbiao Chen1, Meng Yin2, Jun Chen4, Kevin J Glaser2, Richard L Ehman2, Hui Peng3, and Jin Wang1
1Department of Radiology, the Third Affiliated Hospital, Sun Yat-sen University, Guangzhou, China, 2Department of Radiology, Mayo Clinic, Rochester, MN, United States, 3Department of Nephrology, the Third Affiliated Hospital, Sun Yat-sen University, Guangzhou, China, 4Department of Radiology, The Third Affiliated Hospital, Sun Yat-sen University (SYSU), Guangzhou, China
1Department of Radiology, the Third Affiliated Hospital, Sun Yat-sen University, Guangzhou, China, 2Department of Radiology, Mayo Clinic, Rochester, MN, United States, 3Department of Nephrology, the Third Affiliated Hospital, Sun Yat-sen University, Guangzhou, China, 4Department of Radiology, The Third Affiliated Hospital, Sun Yat-sen University (SYSU), Guangzhou, China
Synopsis
Keywords: Kidney, Elastography
Chronic kidney disease (CKD) is increasing in incidence and prevalence worldwide around the world, and early detection of CKD is a major challenge. MR elastography (MRE) is a noninvasive technique capable of quantifying the mechanical properties of tissue that has shown potential for assessing kidney diseases. Our results showedthe stiffness and damping ratio were significantly correlated with eGFR and biopsy score in CKD patients. The stiffness and damping ratio also decreased along with the progression of CKD. MRE using 60-Hz and 90-Hz vibration frequencies can provide potential quantitative biomarkers for evaluating kidney function and pathological injury in CKD patients.Introduction
Chronic kidney disease (CKD) is a global public health problem and the global prevalence of CKD is estimated at 10%(1).Early diagnosis ofCKD is a major challenge andhaving noninvasive medical imaging modalities sensitive to changes in renal function and anatomical fibrosis would benefit the clinical practice. Magnetic resonance elastography (MR) shows promise in evaluating patients with renal tumor, lupus nephritis, diabetic nephropathy and kidney transplant(2-5). These studies suggested that the renal stiffness is associated with blood perfusion state and renal fibrosis. The purpose of this study was to evaluate the diagnostic efficiency of 3D multi-frequency MRE in assessing the renal function and pathological injury in patients with CKD.Methods
Thirty-eight CKD patients were enrolled in the study after approval by the ethics committee and waiver of the informed consent requirement. The renal MRI and 3D multi-frequency MRE exams were performed on a 3.0T MR system (Discovery MR750, GE Healthcare) before a renal biopsy procedure. The MRE passive drivers were a standard 19-cm diameter liver drum driver under each kidney and were developed by Mayo Clinic, and multifrequency coronal MRE acquisitions with 60-Hz and 90-Hz vibration frequencies were performed. Stiffness and damping ratio estimates were generated using neural network inversions trained on masked data (6)(using whole kidney segmentations from this cohort) and applied to masked wave data to reduce the bias contributed by kidney volume changes that occur with CKD progression. The histology analysis was performed on 31 patients based on a uniform, semiquantitative approach to assessing change (including glomerulosclerosis, tubular atrophy, interstitial fibrosis, and arteriosclerosis) followed by biopsy grading between 1 and 4(7). The scores are then added (total renal chronicity score) to grade the overall severity of the chronic lesions into Grade 1: minimal (0–1 total score), Grade 2: mild (2–4 total score), Grade 3: moderate (5–7 total score), and Grade 4: severe (≥8 total score)(7). The grade 1 defined as minimal renal injury, grade 2-4 defined as mild-severe renal injury. Renal function was determined using the estimated glomerular filtration rate (eGFR), which was calculated from blood creatinine levels using the Chronic Kidney Disease Epidemiology Collaboration equation. The total imaging time for MRE was about 64 seconds, performed in six 11-second breathe-holds and at the end of expiration. The acquisitionparametersfor MRE were as follows: single-shot, flow-compensated, spin-echo, echo-planar imaging pulse sequence; TR=1300ms, TE = 55.8ms; FOV = 36×36 cm; acquisition matrix = 96×96; number of excitations = 1; bandwidth = 250 kHz; number of slices = 32; slice thickness = 3.5 mm with 0.5-mm gap.Stiffness maps were obtained using a previously described direct inversion algorithm(8,9). Renal regions of interest (ROIs) were drawn in the parenchyma of the left and right kidney. The diagnostic performance for the differentiation between minimal and mild-moderate renal injury was assessed with the area under the receiver operating characteristic curve (AUROC). The relationship between the stiffness, damping ratio and eGFR and biopsy scores were analyzed by Pearson correlations. Statistical significance was defined as P<0.05.Results
Baseline variables, including age, sex, eGFR, biopsy score, stiffness and damping ratio in the 31 CKD patients are shown in Table 1. The 60- and 90-Hz stiffness, damping ratio diagnostic values are shown in Table 2. The stiffness cutoff value at 60 Hz and 90 Hz for discriminating minimal from mild-severe renal injury was 5.47 kPa and 7.18 kPa with 62.5% and 68.8% sensitivity, and 86.7% and 86.7% specificity, giving an AUROC of 0.767 and 0.792(Figure 2). The damping ratio cutoff value at 60 Hz and 90 Hz for discriminating minimal from mild-severe renal injury was 0.133 and 0.122 with 50% and 75% sensitivity, and 100% and 46.7% specificity, giving an AUROC of 0.721 and 0.575(Figure 2). MRE shear stiffness was positively correlated with eGFR levels (60 Hz, r=0.565, P<0.001; 90 Hz, r=0.519, P<0.001)(Figure 3), and was negatively correlated with biopsy score (60 Hz, r =-0.670, P<0.001; 90 Hz, r=-0.574,P<0.001)(Figure 4). The damping ratio was positively correlated with eGFR levels (60 Hz, r=0.493, P=0.002; 90 Hz, r=0.380, P=0.019)(Figure 3), and was negatively correlated with biopsy score (60 Hz, r =-0.494,P=0.005; 90 Hz, r=-0.409, P=0.022)(Figure 4).Discussion
In this study, it was shown that kidney stiffness and damping ratio using 60-Hz and 90-Hz vibration frequencies can be used to evaluate kidney function and pathological damage, and the stiffness was significantly correlated with eGFR and biopsy score in patients with CKD. The stiffness and damping ratio also decreased along with the progression of CKD. Possible explanations for these observations are that the stiffness reflects the lower perfusion and fibrosis in the renal tissue, and that the decreasing renal perfusion factor has more of a contribution to the observed renal stiffness than renal fibrosis in advanced-stage CKD. Further multicenter, large-sample studies are needed to investigate these findings.Conclusion
Our findings suggest that 3D MRE is a promising and useful technique for predicting renal function and pathological damage.Acknowledgements
National Natural Science Foundation of China grant 91959118 (JW) and 82271973(JW), Key Research and Development Program of Guangdong Province 2019B020235002 (JW), Guangdong Basic and Applied Basic Research Foundation, 2021A1515010582 (JW), SKY Radiology Department International Medical Research Foundation of China Z-2014-07-2101 (JW) and Clinical Research Foundation of the 3rd Affiliated Hospital of Sun Yat-sen University YHJH201901 (JW).References
- 1.Thomas, B., K. Matsushita, K.H. Abate, et al., Global Cardiovascular and Renal Outcomes of Reduced GFR. J Am Soc Nephrol, 2017. 28(7): p. 2167-2179.
- 2. Prezzi D, Neji R, Kelly-Morland C, et al. Characterization of Small Renal Tumors With Magnetic Resonance Elastography: A Feasibility Study. Invest Radiol 2018;53(6):344-351
- 3. Marticorena Garcia SR, Grossmann M, Bruns A, et al. Tomoelastography Paired With T2* Magnetic Resonance Imaging Detects Lupus Nephritis With Normal Renal Function. Invest Radiol 2019;54(2):89-97
- 4. Brown RS, Sun MRM, Stillman IE, et al. The utility of magnetic resonance imaging for noninvasive evaluation of diabetic nephropathy. Nephrol Dial Transplant 2019
- 5. Marticorena Garcia SR, Fischer T, Durr M, et al. Multifrequency Magnetic Resonance Elastography for the Assessment of Renal Allograft Function. Invest Radiol 2016;51(9):591-595
- 6. Murphy MC, Cogswell PM, Trzasko JD, Manduca A, Senjem ML, Meyer FB, Ehman RL, Huston J 3rd. Identification of Normal Pressure Hydrocephalus by Disease-Specific Patterns of Brain Stiffness and Damping Ratio. Invest Radiol. 2020 Apr;55(4):200-208.
- 7. Sethi S, D'Agati VD, Nast CC, et al. A proposal for standardized grading of chronic changes in native kidney biopsy specimens. Kidney Int 2017;91(4):787-789
- 8. Shi Y, Glaser KJ, Venkatesh SK, et al. Feasibility of using 3D MR elastography to determine pancreatic stiffness in healthy volunteers. J Magn Reson Imaging 2015;41(2):369-375
- 9. Wang J, Shan Q, Liu Y, et al. 3D MR Elastography of Hepatocellular Carcinomas as a Potential Biomarker for Predicting Tumor Recurrence. J Magn Reson Imaging 2018
Figures
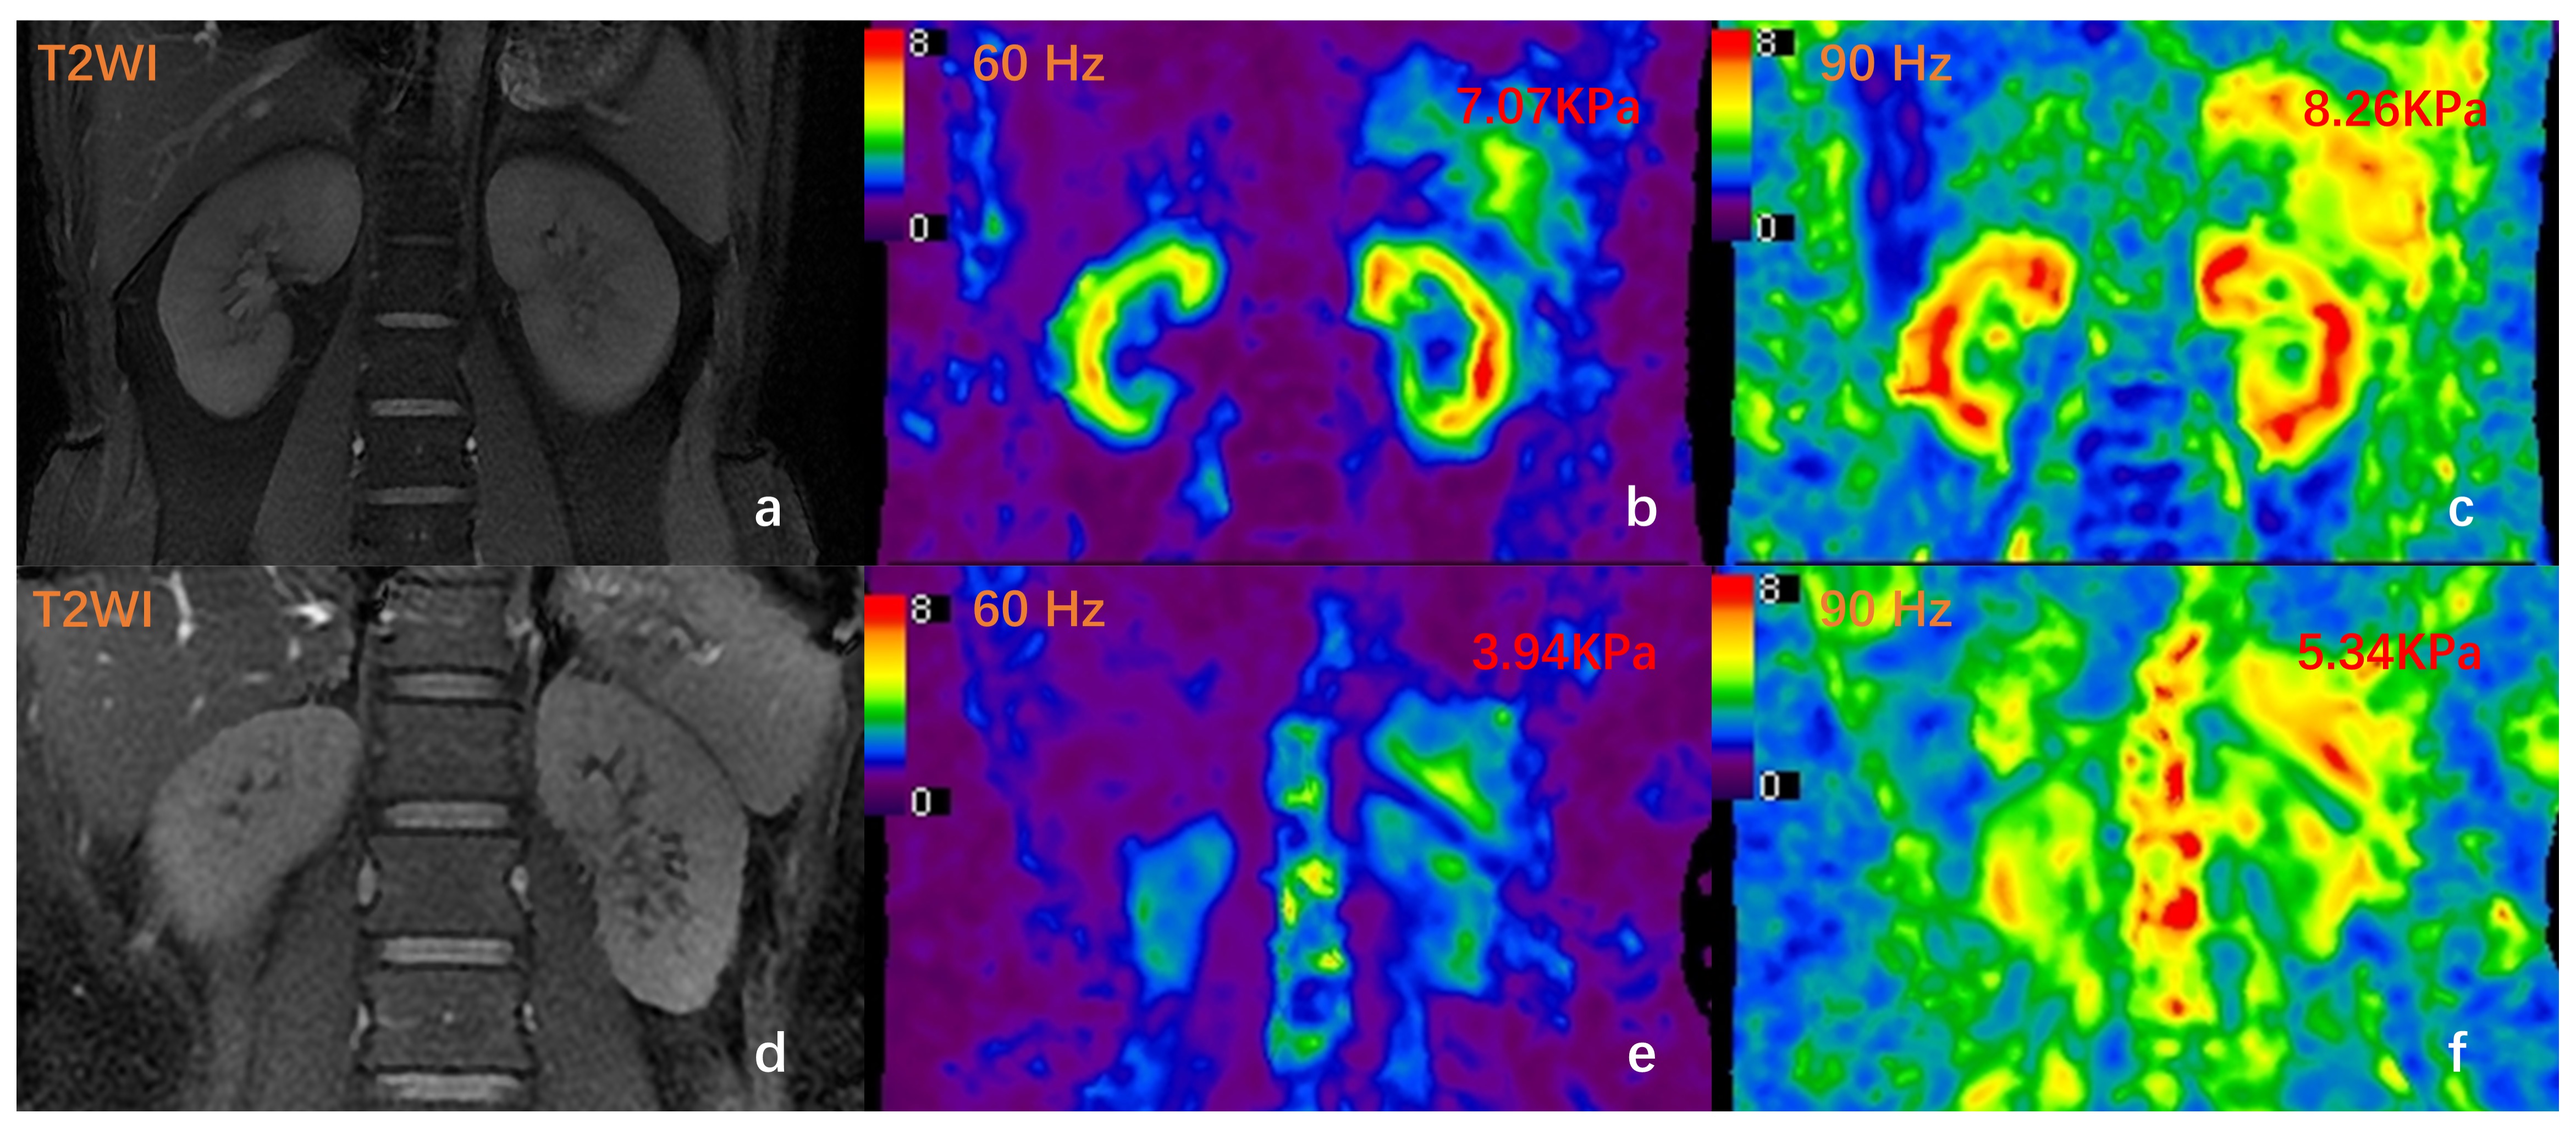
Figure 1. T2-weighted image (T2WI) (a) and MRE stiffness images (b, c) of a 31-year-old patientwith IgA nephropathy and normal renal function (CKD stage 1, eGFR: 122ml/min/1.73m2).The recorded stiffness was 7.07 kPa at 60 Hz (b) and 8.26 kPa at 90 Hz (c). T2WI (d), MRE images (e, f) of a 39-year-old patient with IgA nephropathy showing compromised renal function (CKD stage 3, eGFR: 36ml/min/1.73m2). The recorded stiffness at 60 Hz (e) was 3.94 kPa and 5.34 kPa at 90 Hz (f).
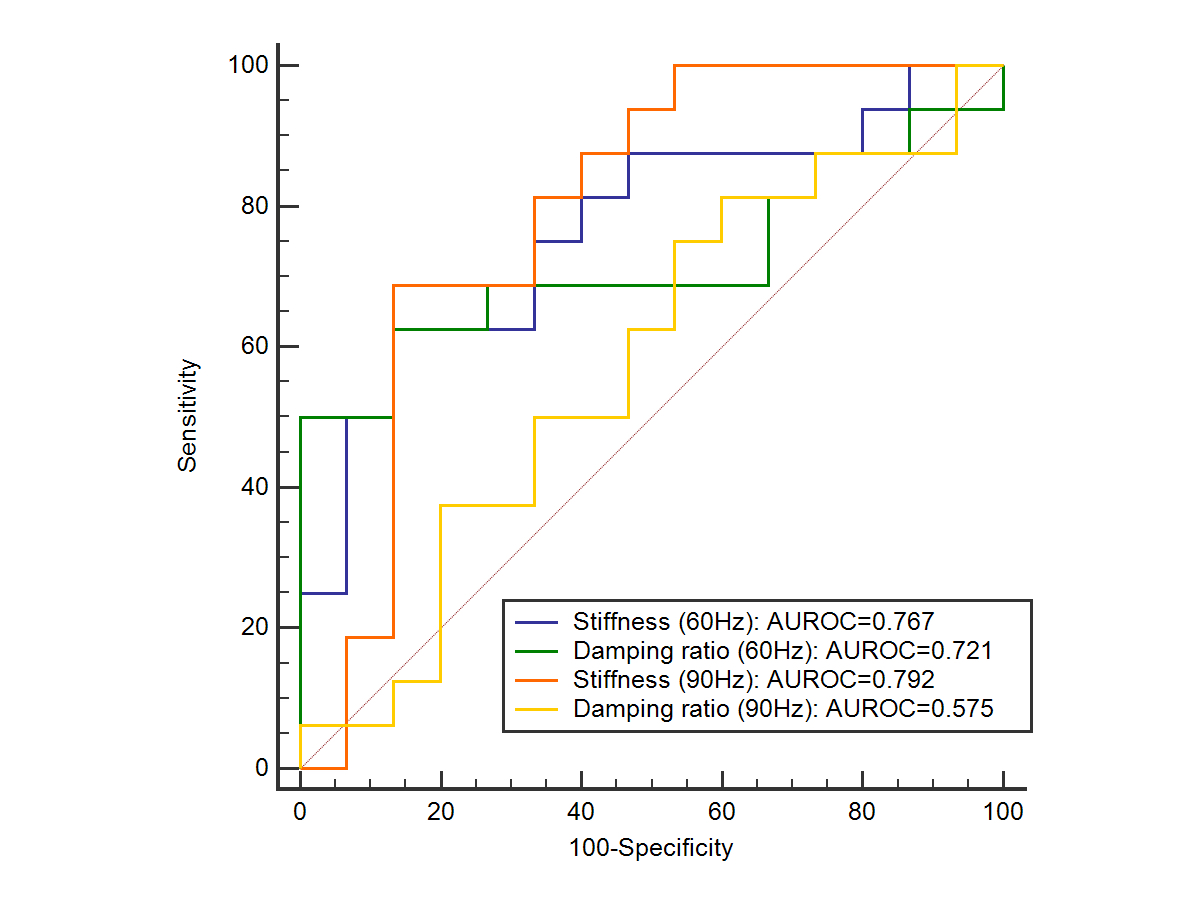
Figure 2. Receiver operating characteristic curves using 90-Hz stiffness (red), 90-Hz damping ratio (yellow), 60-Hz stiffness (blue) and 60-Hz damping ratio (green)to discriminate minimal from mild-severe renal injury.
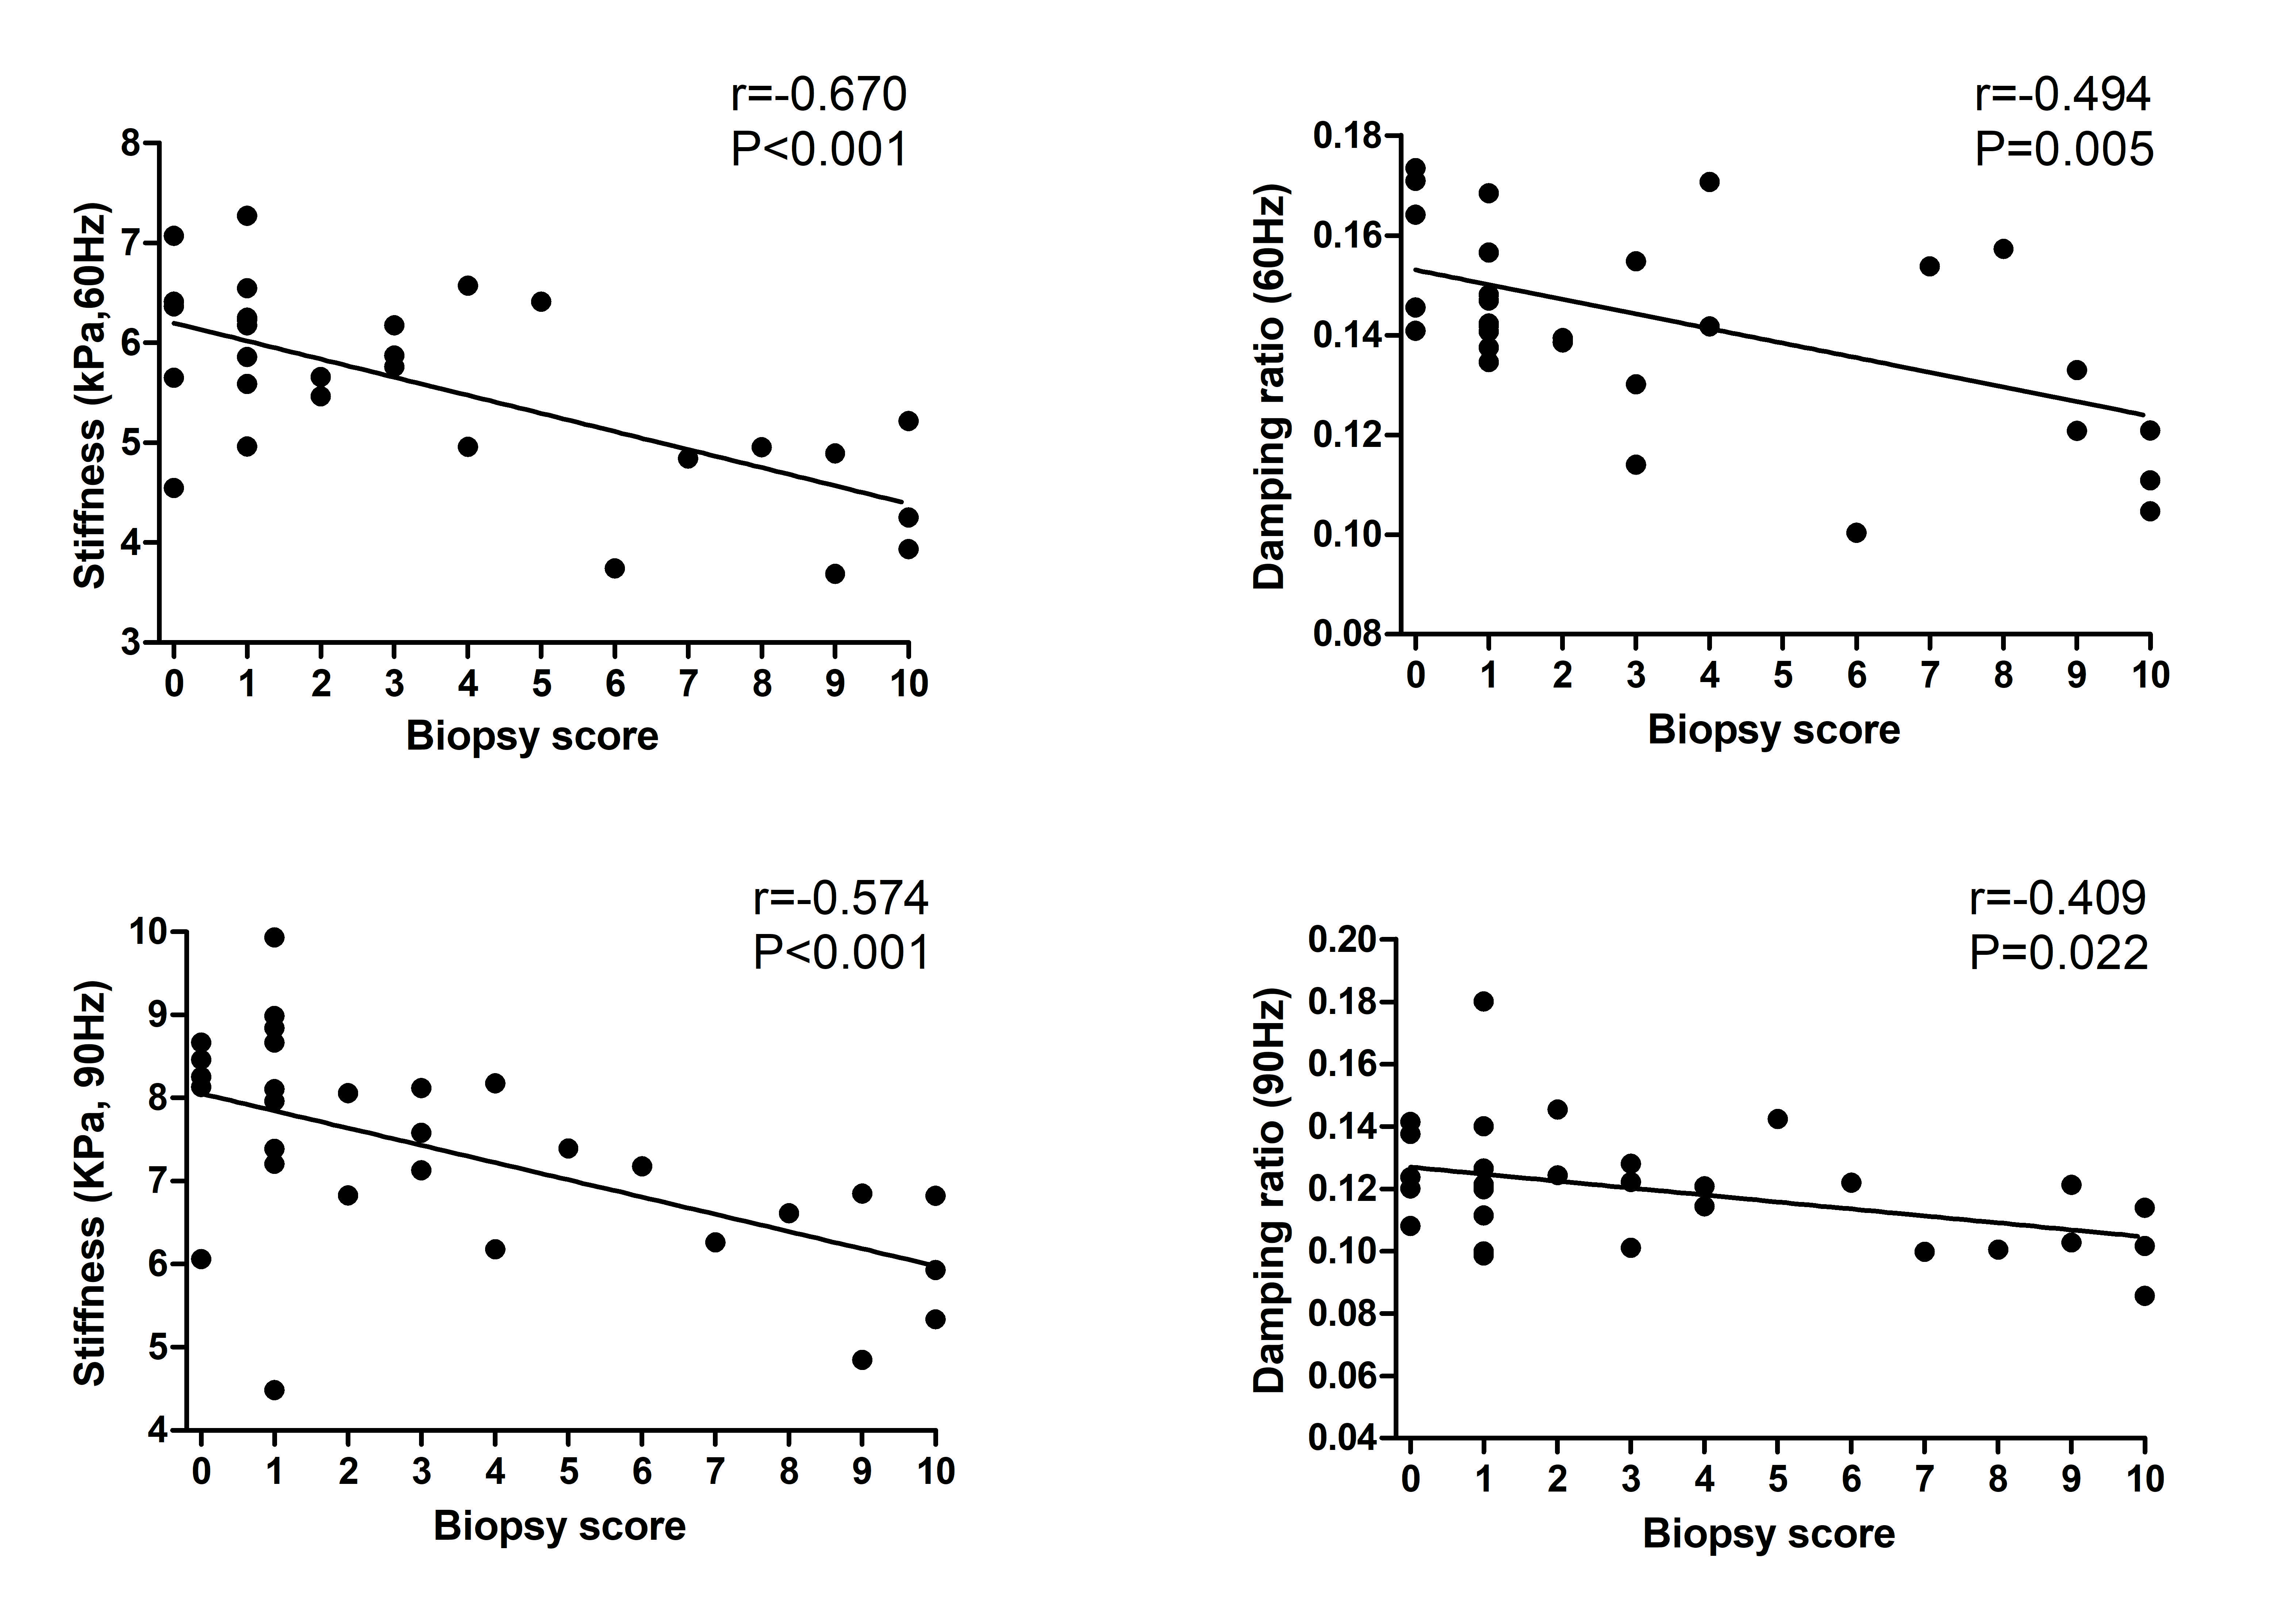
Figure 3. Pearson correlations between stiffness (60 Hz left, 90 Hz right) and eGFR.
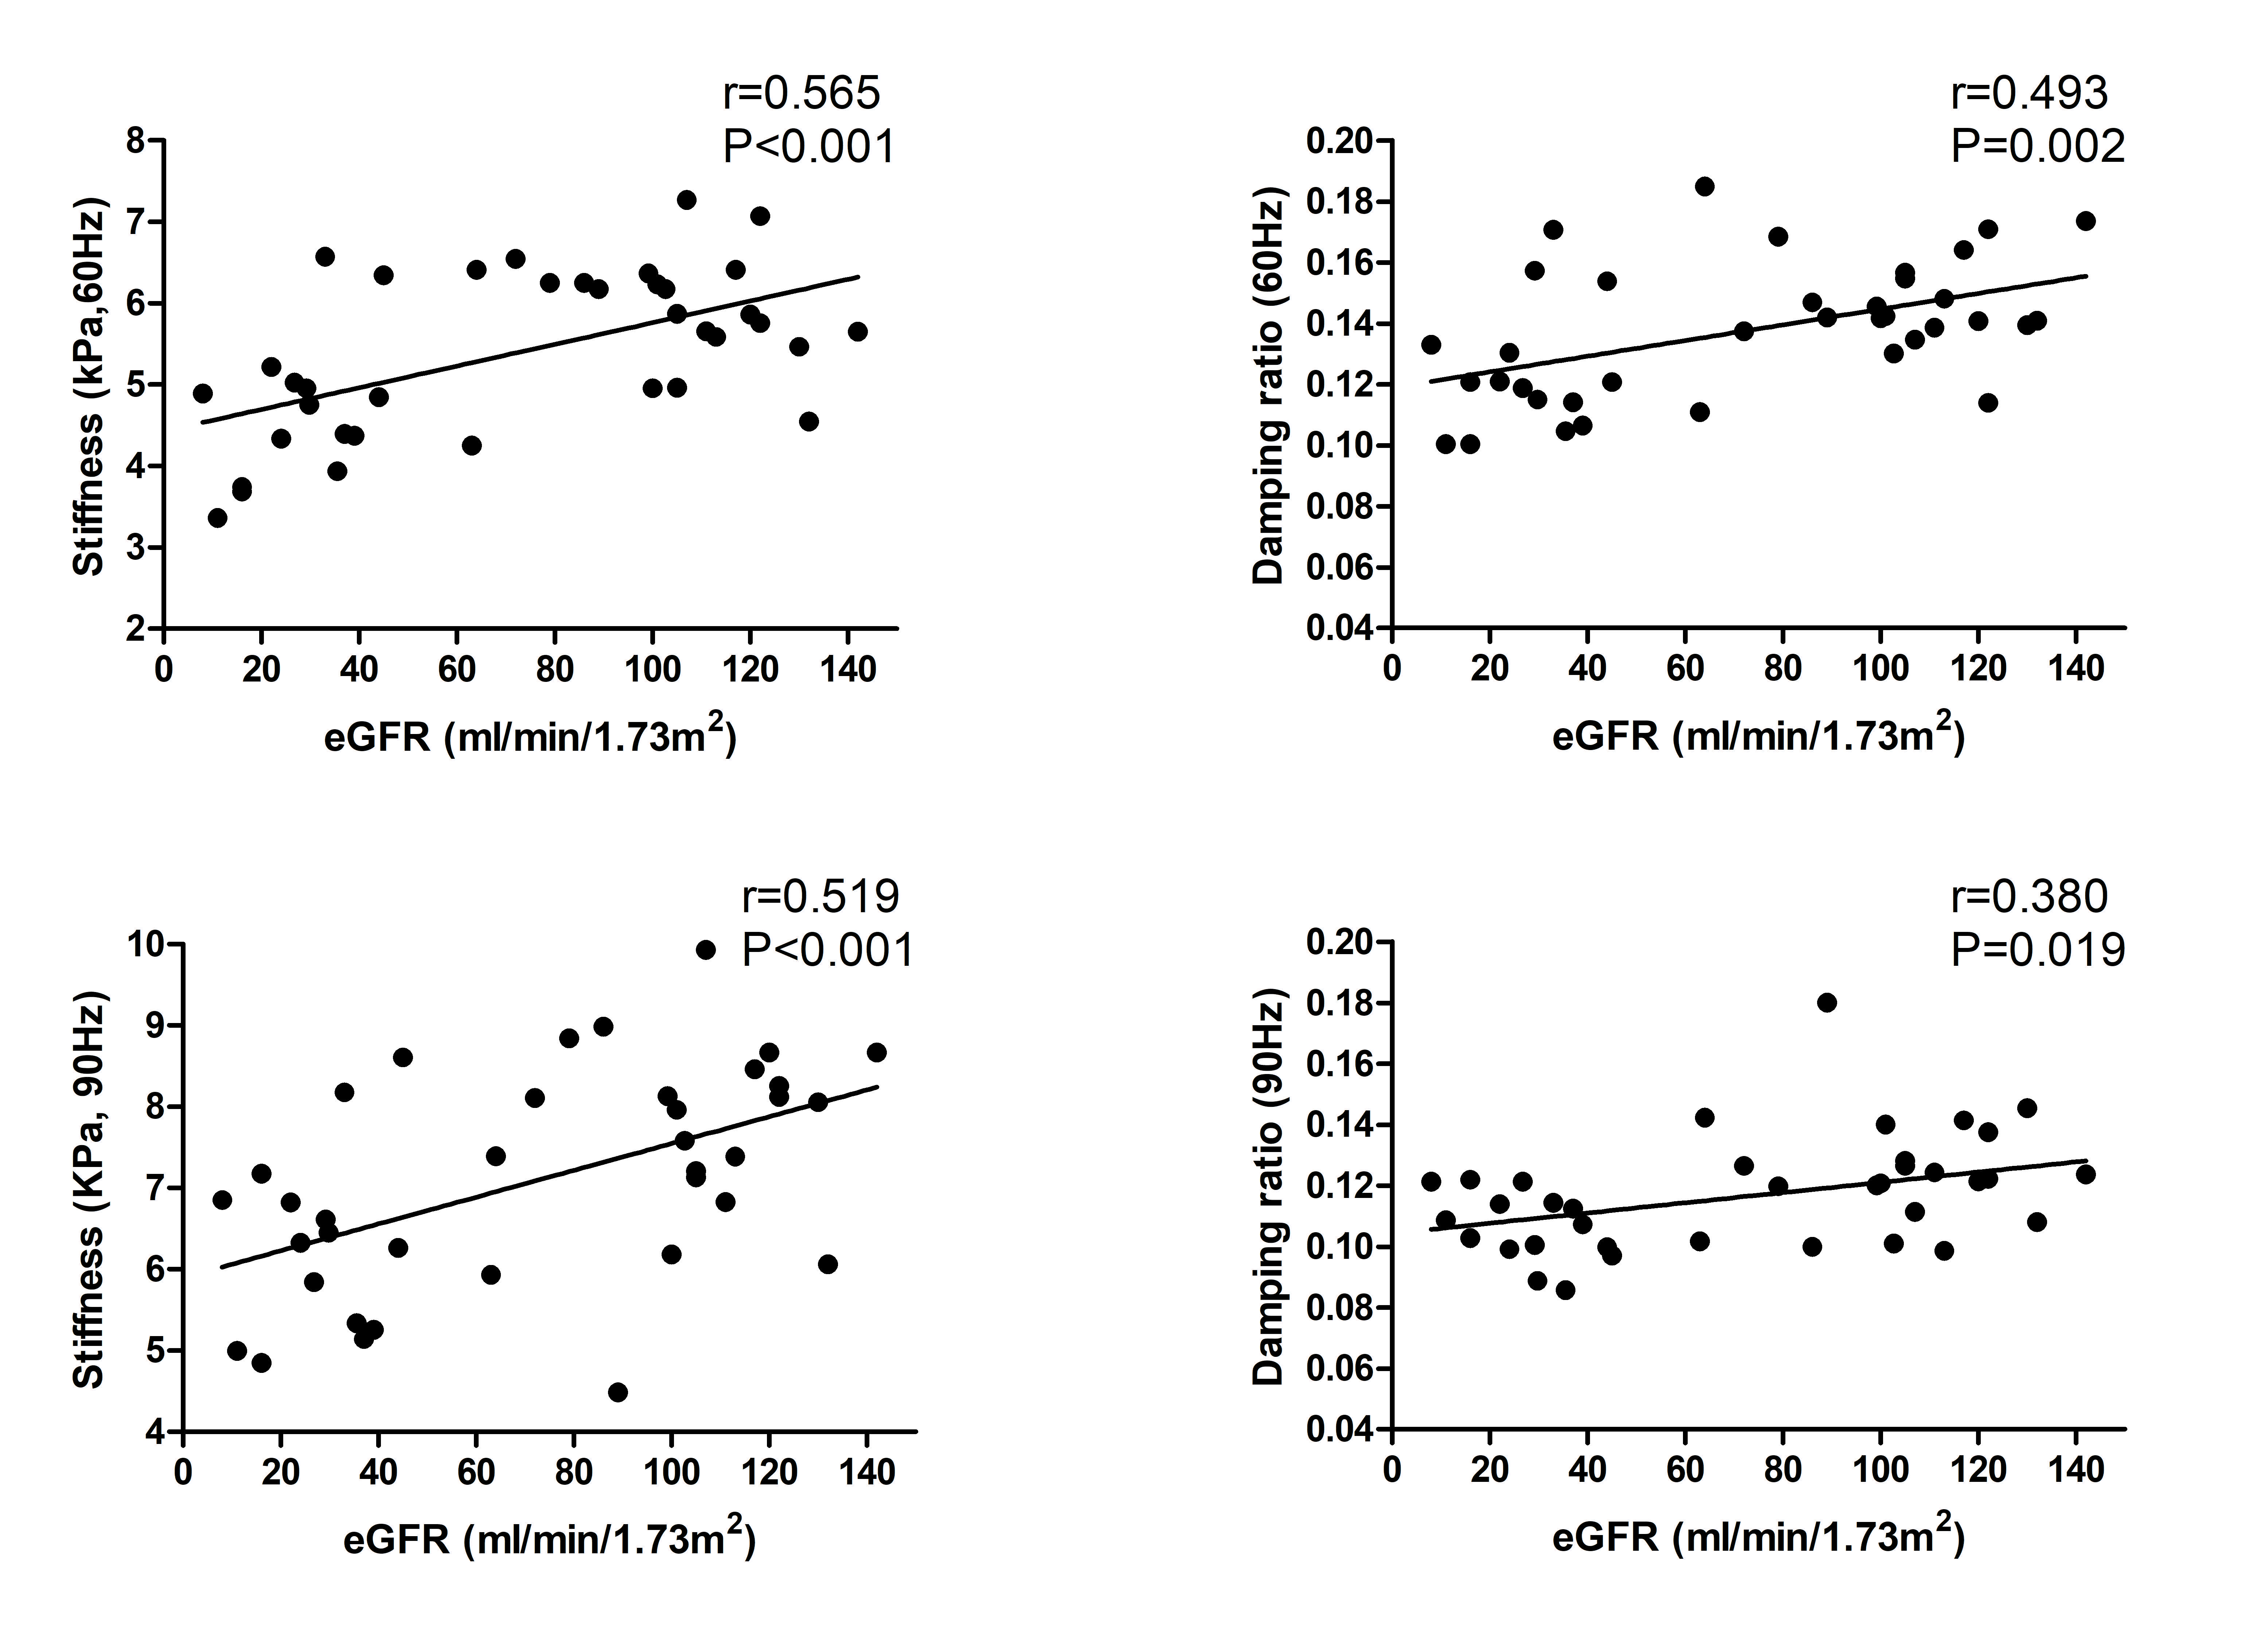
Figure 4. Pearson correlations between renal stiffness (60 Hz top left, 90 Hz bottom left), damping ratio (60 Hz top right, 90 Hz bottom right) and biopsy scores.
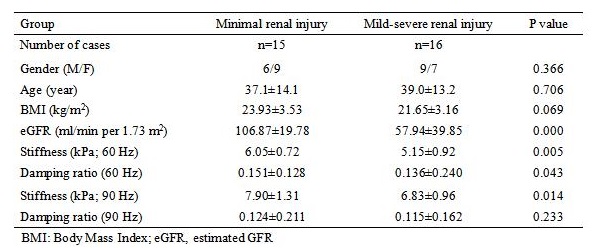
Table 1. Patient characteristics for the 31 CKD patients
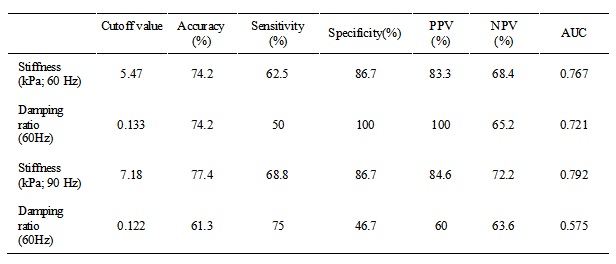
Table 2. Diagnostic performance of 60-Hz and 90-Hz kidney stiffness and damping ratio for discriminating minimal renal injury from mild-severe renal injury
DOI: https://doi.org/10.58530/2023/3801