3800
Exploration of interstitial fibrosis in chronic kidney disease by diffusion-relaxation correlation spectrum MR imaging1Department of Radiology, Renji Hospital, School of Medicine, Shanghai Jiao Tong University, Shanghai, China, 2MR Collaboration, Central Research Institute, United Imaging Healthcare, Shanghai, China, 3Department of Nephrology, Renji Hospital, School of Medicine, Shanghai Jiao Tong University, Shanghai, China
Synopsis
Keywords: Kidney, Diffusion/other diffusion imaging techniques
Non-invasive evaluation of interstitial renal fibrosis would help monitoring chronic kidney disease (CKD) progression and prognosis prediction. This study was aimed to evaluate renal interstitial fibrosis by diffusion relaxation correlated spectrum imaging (DR-CSI). Correlation was found between DR-CSI volume fractions and interstitial fibrosis level (IFL). VB illustrated best diagnostic performance among MRI indicators. We suggest DR-CSI is of potential value in the evaluation of renal interstitial fibrosis.
INTRODUCTION
Renal interstitial fibrosis is one of the most common pathways in the progression of chronic kidney disease (CKD). Non-invasive evaluation of interstitial fibrosis would help monitoring CKD progression and prognosis prediction.Among different MRI-based approaches, diffusion-weighted imaging (DWI) has demonstrated merit for the assessment of renal fibrosis. On the other hand, T2 relaxation times could help to discriminate between different components and microenvironments. However, conventional apparent diffusion coefficient (ADC) and T2 measurements may be limited due to the following problem: water diffusivity/relaxometry in human tissue is quite heterogeneous at a scale of micrometers, while ADC/apparent T2 only provides information about weighted average characteristics in a millimeter-scaled voxel.
Recently, a new MRI technology named diffusion-relaxation correlation spectrum imaging (DR-CSI) has been introduced, able to separate compartments with different diffusivity or T2 1,2. This study is aimed to evaluate the severity of renal interstitial fibrosis in CKD by DR-CSI.
METHODS
Forty patients with CKD and 10 healthy controls (average age 49.2±14.8 years, 18 females) were enrolled in this prospective study and all underwent DR-CSI scan (6 b-values, 6 echo times) at 3.0 T MRI scanner. Interstitial fibrosis level (IFL) was assessed from biopsy results (IFL=1, fibrosis percentage <25%, defined as mild; IFL=2, 25%~50%, moderate; IFL=3, >50%, severe). IFL of healthy control was defined as 0. Estimated glomerular filtration rate (eGFR) was calculated using serum creatinine.The regions of interest (ROIs) included cortex on all 6 slices of both kidneys. The diffusivity-T2 spectrum was assessed considering three compartments (threshold: T2 30 ~ 40ms, diffusivity 5 ~ 9μm2/ms, according to visible peaks): A (low diffusivity, short T2), B (low diffusivity, long T2), and C (high diffusivity). Volume fractions Vi (i=A, B, C) were calculated for each voxel.
Intra-class coefficient (ICC, >0.6 as good) was used to assess the inter-reader agreement of DR-CSI Vi. Spearman’s correlation was used to assess the relationship of Vi to IFL and eGFR. Receiver operating characteristic (ROC) analyses with the area under the curve (AUC) to discriminate patients with moderate-severe fibrosis from mild ones. The statistical significance criteria was p-value <0.05.
RESULTS
After percutaneous biopsy, 31, 6, and 3 patients were classified into IFL=1 (mild), 2 (moderate), and 3 (severe).Generally, three or four peaks could be distinguished in the cortical D-T2 spectrum (Figure 1, 2). Typical One or two peaks could be observed at high-diffusivity area. In most cases, a widespread peak existed at the middle-bottom of the spectrum (center: diffusivity 1 ~ 2 μm2/ms, T2 60 ~ 80 ms). On the left part of the spectrum resided another peak (center: diffusivity 1 ~ 2 μm2/ms, T2 10 ~ 20 ms), displaying a slightly blurred boundary from the top-left peak.
DR-CSI volume fraction maps were obtained (Figure 2). Inter-reader agreement was all good for VA (ICC=0.857), VB (ICC=0.857) and VC (ICC=0.886). Correlations were found between IFL and VB (r=0.424, significant) and VC (r=−0.400, significant), and between eGFR and VB (r=−0.303, p=0.058) and VC (r=0.487, significant). Regarding VB and VC, the AUCs were 0.903 and 0.824. VB illustrated best diagnostic performance among MRI indicators (Figure 3). Histograms of voxel-percentage distributions of DR-CSI VA, VB, and VC were plotted in the mild and moderate-severe groups (Figure 4).
DISCUSSION
This study evaluated renal interstitial fibrosis by DR-CSI in terms of microenvironment analysis. Specifically, characteristic peaks have been observed. The high-diffusivity peaks (compartment C) may represent perfusion contribution, which is related to local blood and tubular flow 3, while the peaks in low-diffusivity regions (compartment A and B) are likely associated with the pure molecular diffusion. The short T2 components (compartment A) most likely refer to the intra-cellular microenvironment, while long T2 components (compartment B) should associate with the extra-cellular microenvironment 4,5. This can be explained by the difference between the extra-cellular and the intra-cellular microenvironment, where the former holds larger macro-molecular water and free water content, resulting in a relatively longer T2. The decrease of peritubular capillary density could reduce the blood perfusion and lead to the decrease of volume fraction in DR-CSI compartment C. Another possible reason for the decrease of VC is tubular atrophy, which could relate to a reduction in tubular flow. Our study suggests a higher VB for the moderate-severe group of patients. The reason might be that the deposition of collagen fibers hinders more fast-moving extra-cellular molecules, capturing their contribution from the recognized high-diffusivity components.CONCLUSION
DR-CSI help distinguish patients with moderate or severe renal interstitial fibrosis from mild ones. Our findings may illustrate the potential of applying an in-vivo DR-CSI method for the evaluation of renal interstitial fibrosis. Specifically, DR-CSI could differentiate signal contributions from diverse compartments with different diffusion and relaxation properties.Acknowledgements
This work was supported by National Natural Science Foundation of China (Grant No. 81901693, 82001457, and 82171885), Shanghai Science and Technology Committee Project (Natural Science Funding: Grant No. 20ZR1433200), Shanghai Science and Technology Committee Project (Explorer Project Funding: Grant No. 21TS1400700), Shanghai "Rising Stars of Medical Talent" Youth Development Program, Youth Medical Talents-Medical Imaging Practitioner Program (Grant No. SHWRS(2020)_087) and Clinical Skill and Innovation Project of Shanghai ShenKang Hospital Development Center (Grant No. SHDC2020CR6017) .
References
1. Kim D, Doyle EK, Wisnowski JL, et al. Diffusion-relaxation correlation spectroscopic imaging: A multidimensional approach for probing microstructure. Magn Reson Med. 2017;78(6):2236-2249.
2. Benjamini D, Basser PJ. Multidimensional correlation MRI. NMR Biomed. 2020;33(12):e4226.
3. Zhao J, Wang ZJ, Liu M, et al. Assessment of renal fibrosis in chronic kidney disease using diffusion-weighted MRI. Clin Radiol.2014;69(11):1117-1122.
4. Warner J, Donell S, Wright K, et al. The characterisation of mammalian tissue with 2D relaxation methods. Magn Reson Imaging. 2010;28(7):971-981.
5. Cole WC, Leblanc AD, Jhingran SG. The Origin of Biexponential T2 Relaxation in Muscle Water. Magn Reson Med.1993;29(1):19-24.
Figures
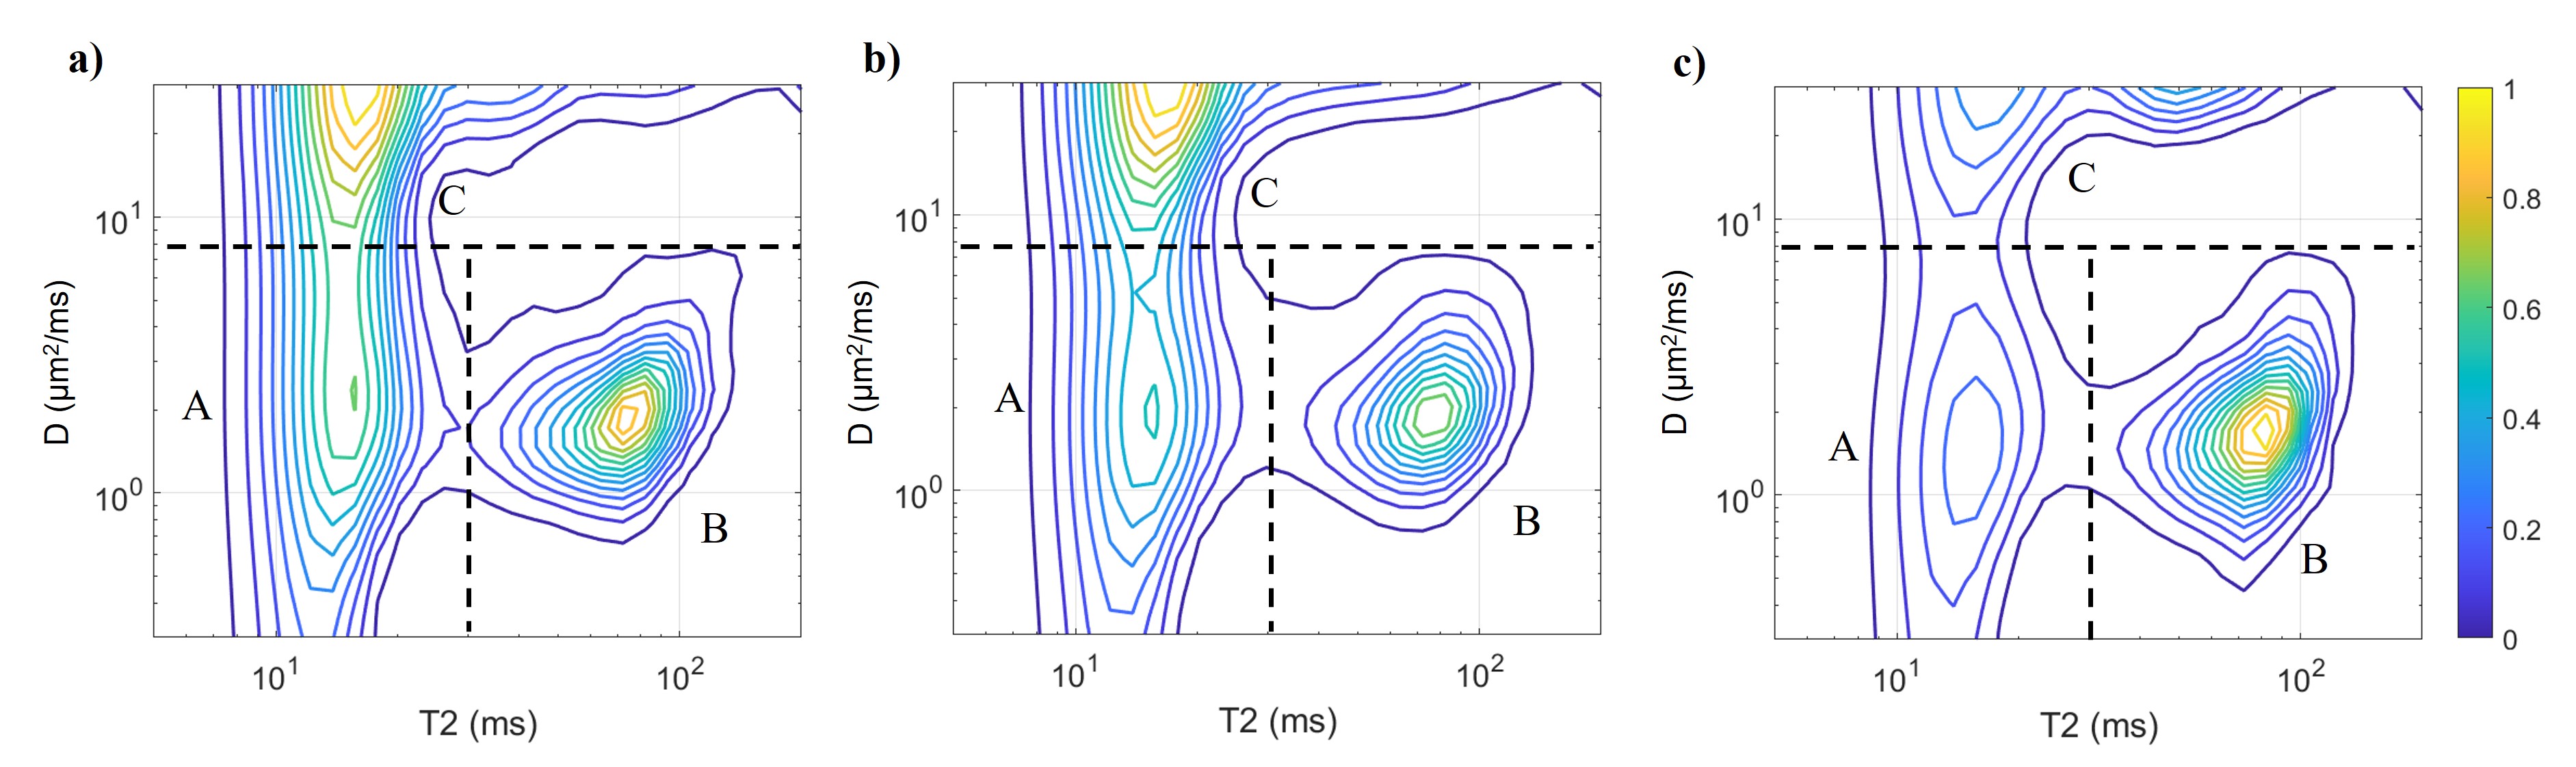
Figure 1: Average spectra from a) all 10 healthy volunteers; b) all 31 patients with mild renal interstitial fibrosis; c) all 9 patients with moderate or severe renal interstitial fibrosis. All spectra are after normalization. The spectra were divided by dash lines into three compartments to illustrate different microenvironments suggested in this work. Threshold illustrated was 8 μm2/ms for D and 30 ms for T2. Smaller peaks A and C and larger peak B could be clearly observed in spectra by the moderate-severe group than the mild group.
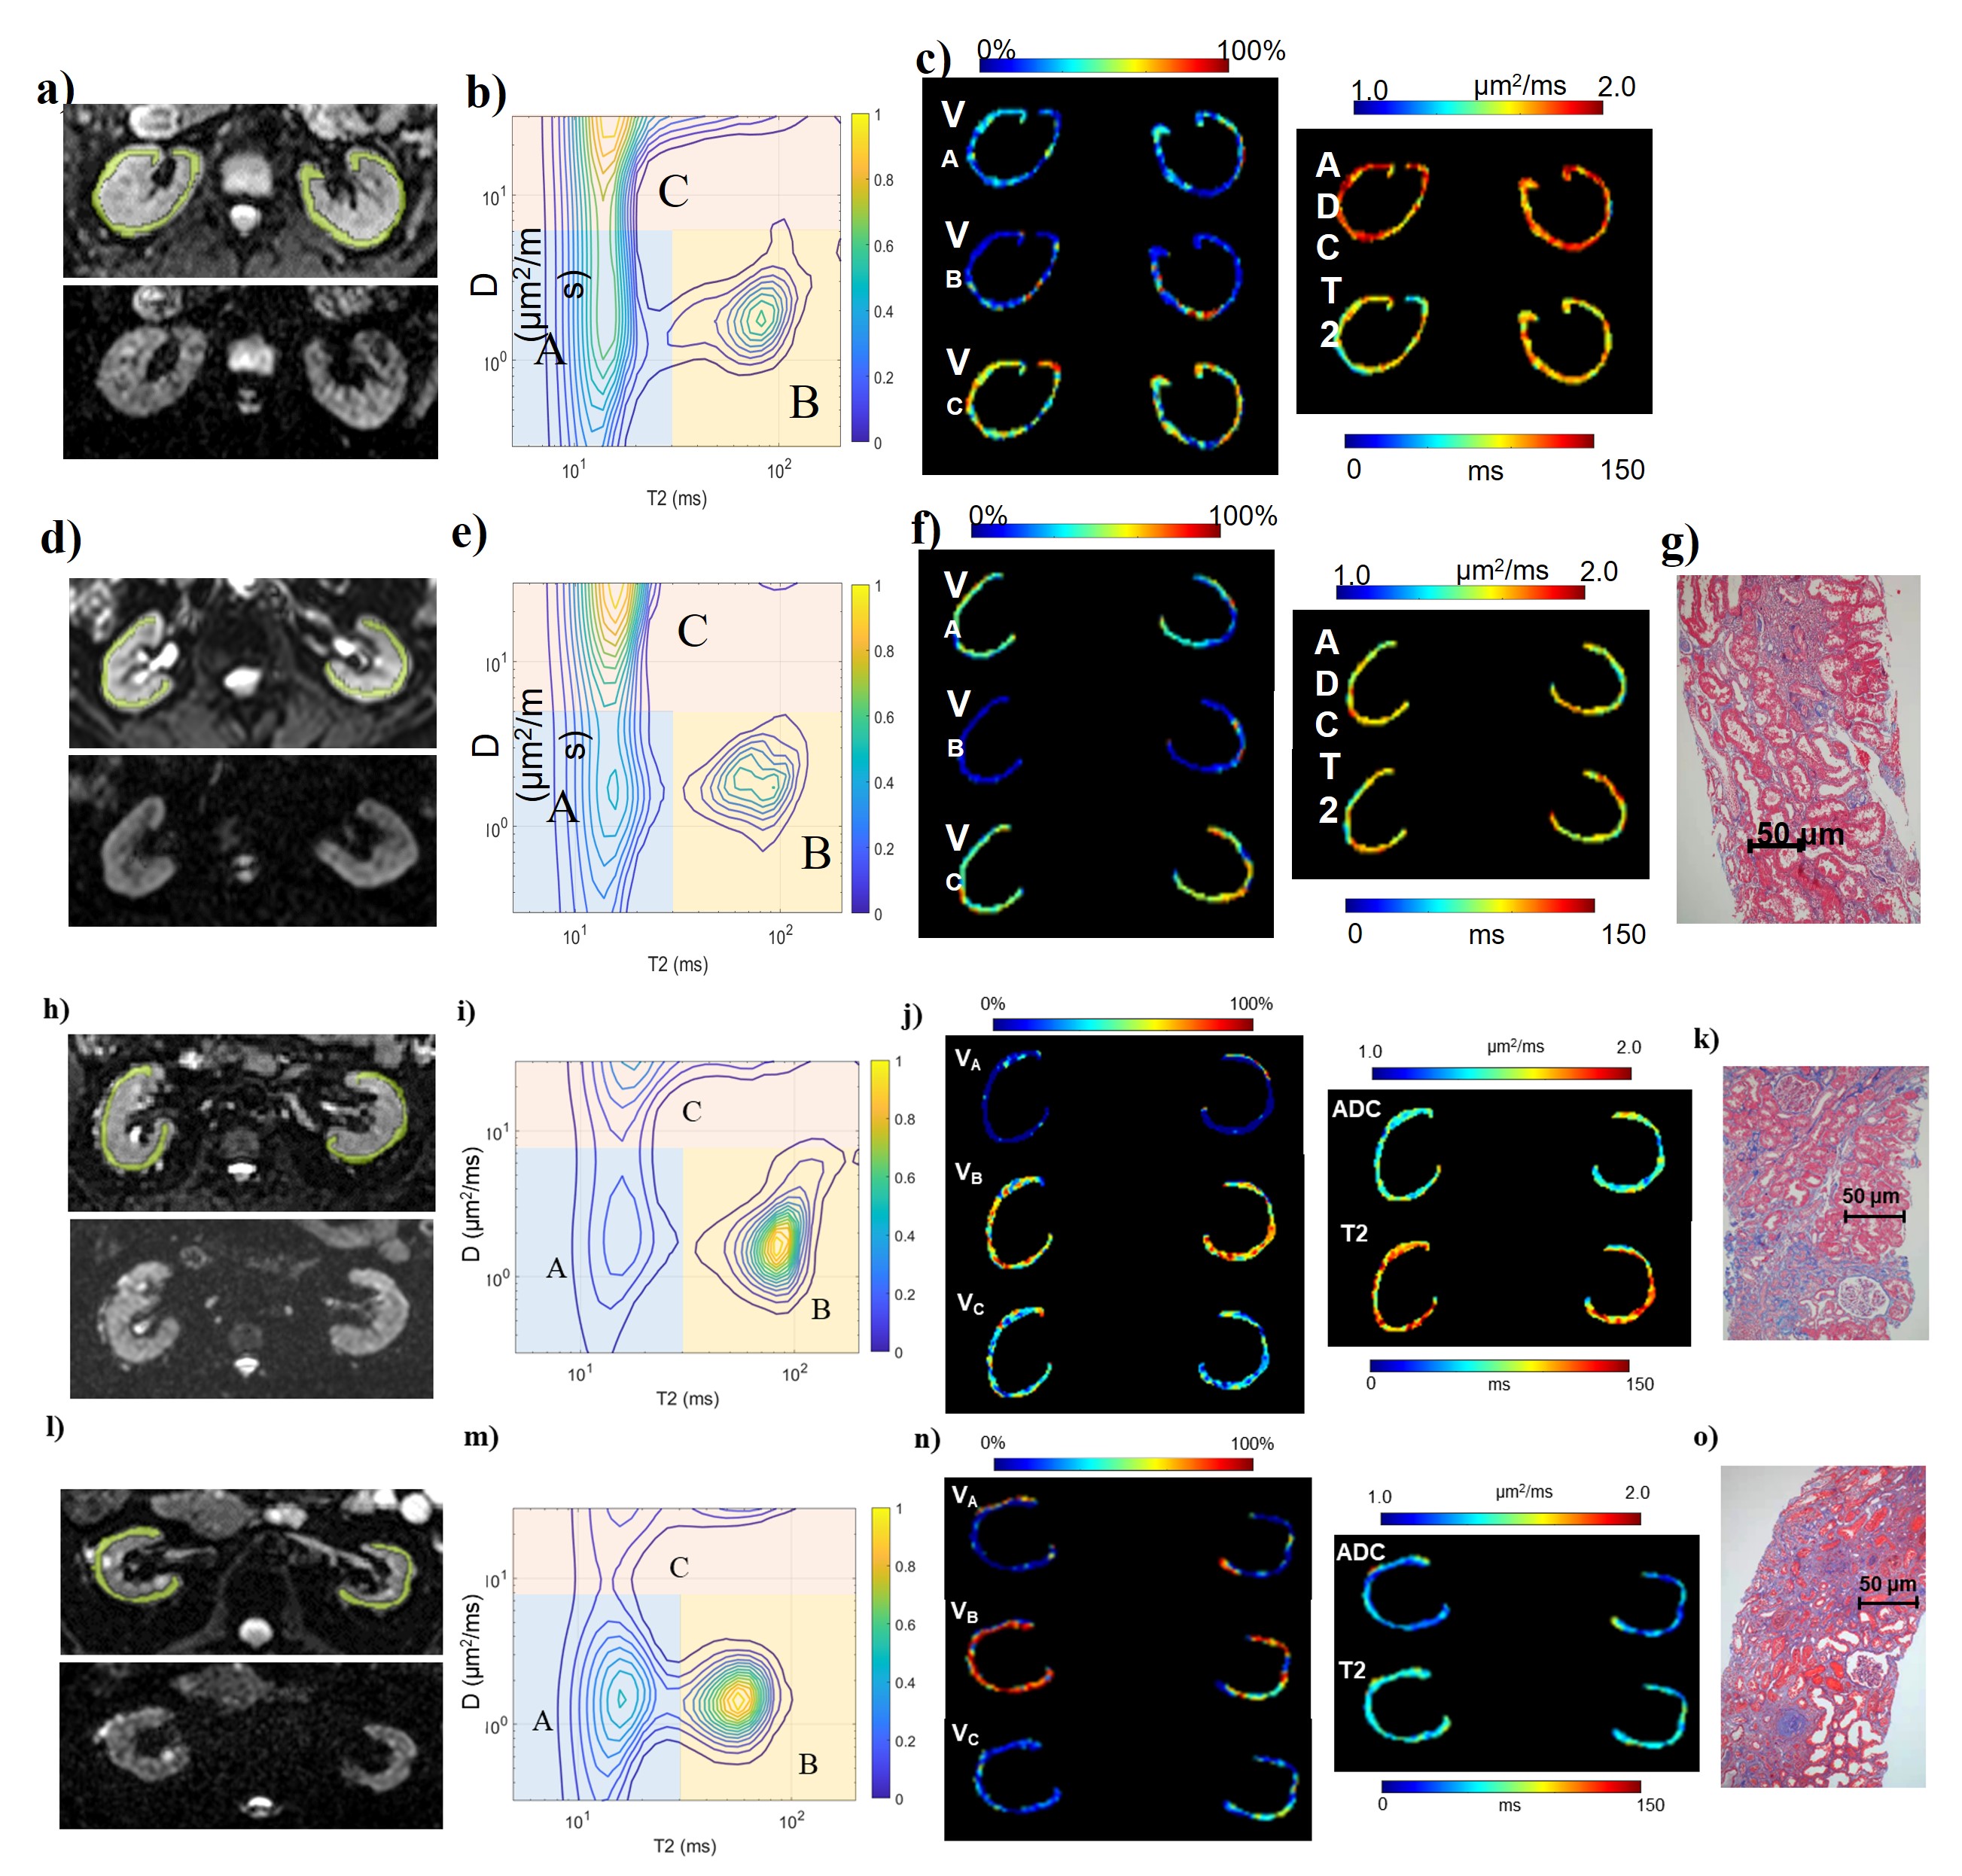
Figure 2: An 18 years healthy male; d)-g) A 59 years female with mild renal fibrosis (IFL=1); h)-k) A 55 years female with moderate renal fibrosis (IFL=2); l)-o) A 41 years male with severe renal fibrosis (IFL=3). a), d), h), l) Original DR-CSI images (upper: b=0, TE=50, with ROI labelled; lower: b=400, TE=110), zoomed in to display both kidneys. b), e), i), m) Diffusivity-T2 spectra. c), f), j), n) DR-CSI volume fraction maps, ADC maps and apparent T2 maps of cortex. g), k), o) Masson trichrome stained pathology slides in which area of fibrosis was blue.
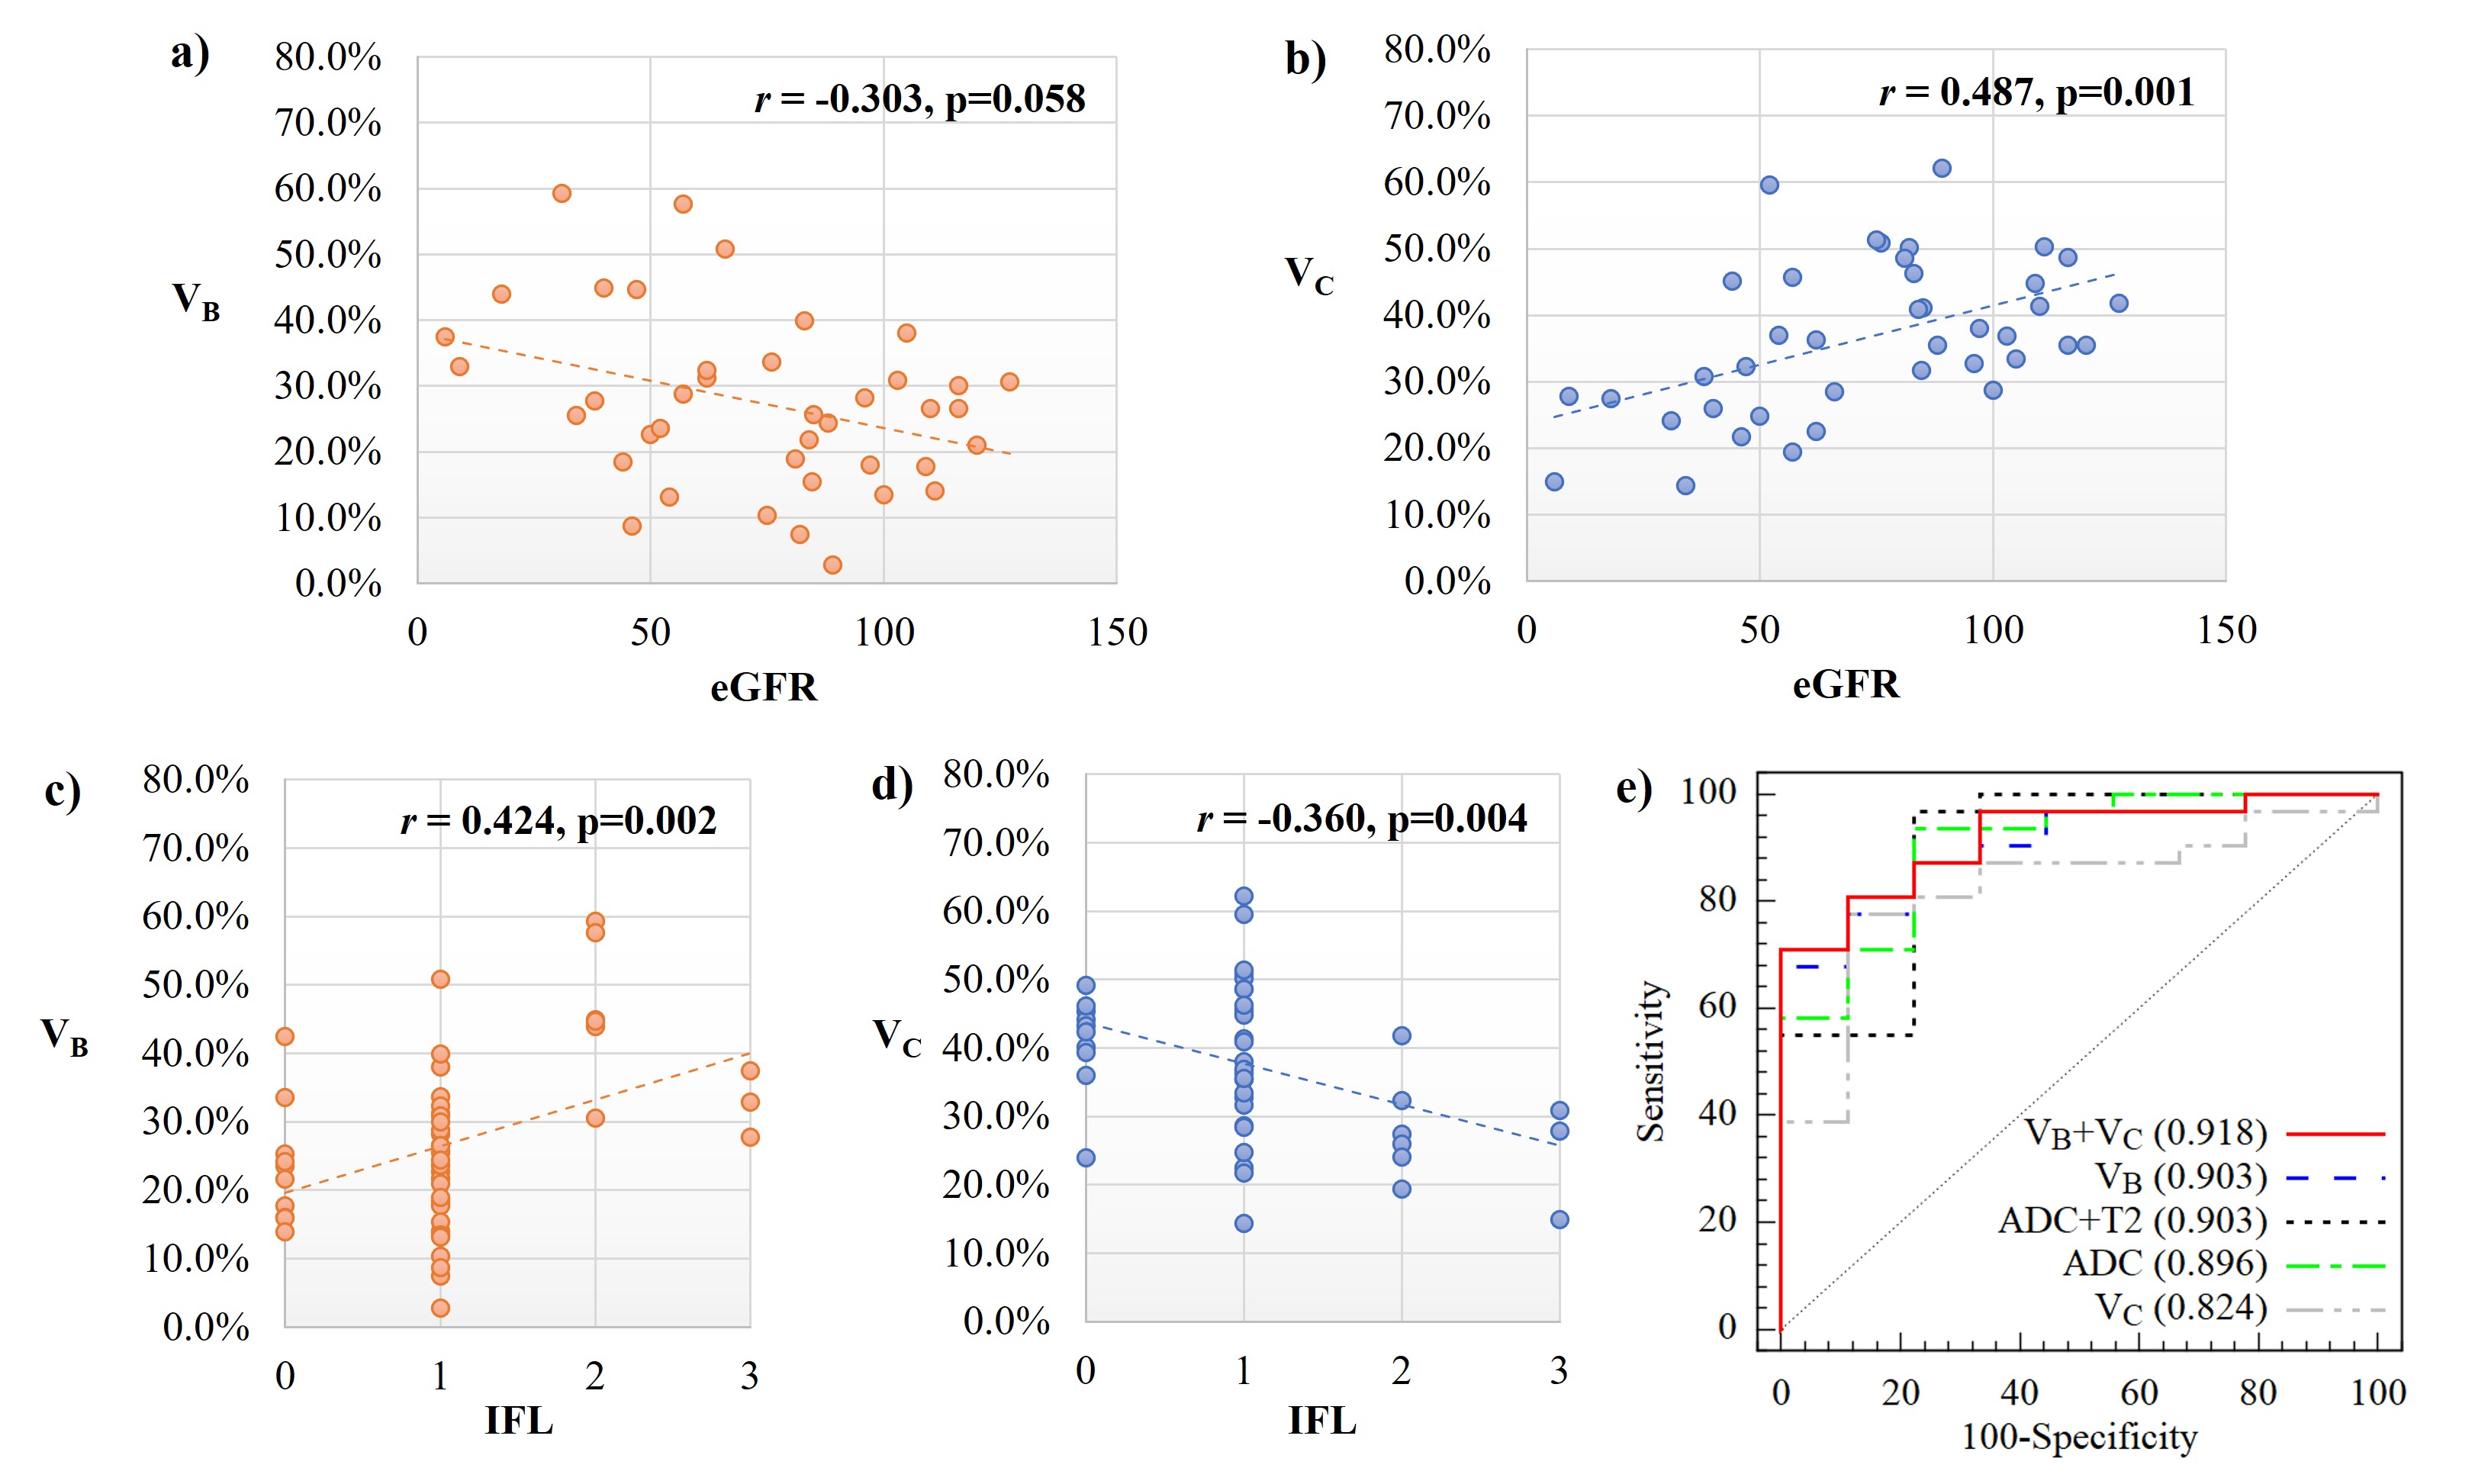
Figure 3: a, b) Spearman’s correlation analysis between eGFR and a) DR-CSI VB; b) DR-CSI VC. c, d) Spearman’s correlation analysis between interstitial fibrosis level and a) DR-CSI VB; (b) DR-CSI VC; e) ROCs to evaluate the diagnostic effect of discriminating patients with moderate-severe fibrosis from mild ones, separately by DR-CSI VB, VC, VB combining VC, ADC and ADC combining T2.
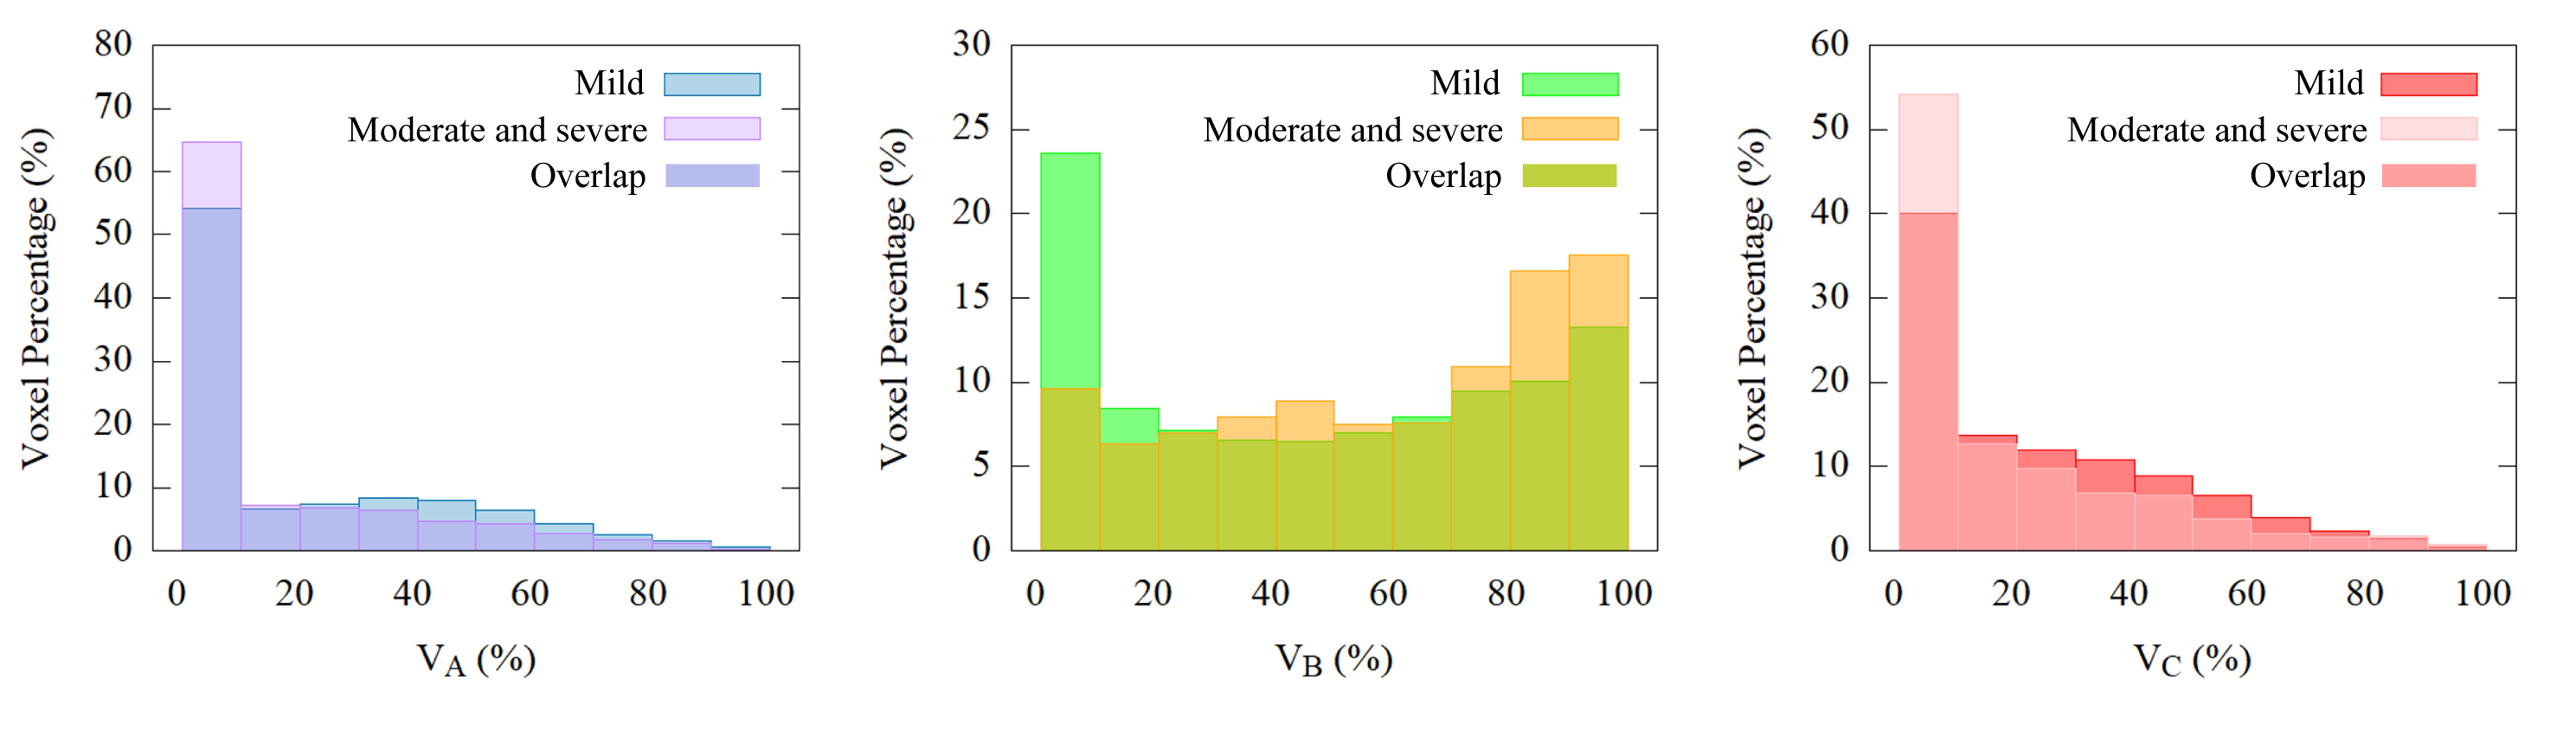
Figure 4: Histograms of voxel-percentage distribution for different DR-CSI compartment volume fractions. Clear difference could be directly observed in distribution of compartment B between mild and moderate-severe group.