3799
Application of machine learning with Tract-Based Spatial Statistics in the diagnosis of pediatric autism1Third Affiliated Hospital of Zhengzhou University, zhengzhou, China, 2Zhengzhou University People’s Hospital, zhengzhou, China, 3MR Research China, GE Healthcare, Beijing 100000, PR China, Beijing, China
Synopsis
Keywords: Machine Learning/Artificial Intelligence, Diffusion/other diffusion imaging techniques, Tract-Based Spatial Statistics
Early and accurate diagnosis of pediatric autism was difficult for clinicians, which hindered the timely treatment of patients.This study aimed to explore the applicability of machine learning models of diffusion kurtosis imaging (DKI) based on Tract-Based Spatial Statistics to diagnose pediatric autism. Results showed that DKI parameter was potential for differentiating early autism from the normal. And the machine learning models can be used for early detection of pediatric autism with high accuracy and sensitivity.
INTRODUCTION
Autism spectrum disorder (ASD) is a specific type of pervasive developmental disorder characterized by deficits in social and verbal communication skills and restricted repetitive behaviors[1]. It has been reported that appropriate systematic rehabilitation interventions in the early stage of autism could improve the symptoms of most patients [2,3]. Therefore, it is particularly important for clinicians to make early and accurate diagnosis of pediatric autism. However, the early diagnosis is mainly based on the clinical symptoms and most pediatric autism have no typical clinical manifestations, which makes early diagnosis very difficult. Diffusion kurtosis imaging (DKI) is one of the state-of-the-art techniques that could be utilized to describe and sensitively detect microstructural changes of the complex brain tissues based on the non-Gaussian diffusion theory of water molecule[4].In this study, we used DKI to explore the differences in brain regions and used its derived parameters as features in machine learning models to make an early diagnosis of ASD through a multidisciplinary perspective.MATERIALS AND METHODS
A total of 59 participants were retrospectively included into the study, including 32 first-diagnosed children with ASD and 27 healthy children. MRI acquisition was performed on 3T MR scanner (GE Signa Pioneer 3.0T). The scanning parameters of DKI were as follows: TR/TE = 8200 ms /2.3 ms, FOV = 200 mm×200 mm, acquisition matrix = 256×256, NEX =1, slices thickness = 4 mm, number of slices = 27; gradient b values of 0, 1000 and 2000 s/mm2; scanning time = 7 min 23 s. All subjects showed no apparent structural damage on conventional MRI images.The maps of fractional anisotropy (FA), mean diffusivity (MD), axial diffusivity (DA), Radial diffusivity (DR), Kurtosis fractional anisotropy (FAK), mean kurtosis (MK), radial kurtosis (KR), axial kurtosis (KA) were automatically derived from DKI on the vendor-supplied software. Voxel-wise statistical analyses of these maps were performed by using Tract-Based Spatial Statistics (TBSS)[5] on the FSL( http://www.fmrib.ox.ac.uk/fsl). The white matter lateralization index (LI) was also calculated based on the formula, $$$LI = (symmetrised_skeletonised– flipped) ÷ (symmetrised_skeletonised + flipped)$$$. Threshold-free cluster enhancement (TFCE) was used to calculate the significant differences between the two groups with an initial threshold of p < 0.05. Then we extracted the clusters detected in TBSS analysis and calculated the values of their DKI derived parameter as the raw features. Thereafter, Principal Component Analysis (PCA) was used to select valid features.The back-propagation neural network (BPNN) model used in our study is mainly a four-layer model, including one input layer, two hidden layers, and one output layer (Figure 1). To compare the network with traditional classifiers, two models of support vector machine (SVM) with radial basis function (RBF) and with linear kernel, and a model of Logistic Regression (LR) were built. The leave-one-out cross validation (LOOCV) was adopted to estimate the performance of total four classifiers (Figure 2). The receiver operating characteristic (ROC) analyses were used to quantify the performance of the models. The McNemar’s test was used to compare the differences of their accuracy, sensitivity, and specificity. The Delong’s test was used to compare the differences of area under the curve (AUC).RESULTS
Significantly reduced FAK was observed in the bilateral Anterior thalamic radiation, Corticospinal tract, cingulate gyrus, hippocampus, Inferior fronto-occipital fasciculus, Inferior longitudinal fasciculus, Superior longitudinal fasciculus, Uncinate fasciculus, the temporal part of Superior longitudinal fasciculus, as well as the Forceps major and Forceps minor in ASD group in comparison with the healthy control group. We also found significantly decreased KA in the bilateral Anterior thalamic radiation, Corticospinal tract, Inferior fronto-occipital fasciculus and the left Superior longitudinal fasciculus, Inferior longitudinal fasciculus, Uncinate fasciculus, as well as the left temporal part of Superior longitudinal fasciculus in the ASD group. The ASD group also showed significantly decreased DA in Forceps major and the right Inferior fronto-occipital fasciculus, Inferior longitudinal fasciculus, Superior longitudinal fasciculus, Anterior thalamic radiation, and the right temporal part of Superior longitudinal fasciculus (Figure 3). In addition, the LI of ASD group in the left Superior longitudinal fasciculus showed significant increase in comparison with that of the controls.In Table 1, the accuracy and sensitivity of BPNN were the highest among the four models with a value of 86.44% and100%, respectively, although there was no significant difference in specificity, sensitivity, and accuracy between models except for BPNN and LR in accuracy (p<0.05). The AUC of BPNN was 0.78, which was lower than that of other three models (for SVM with RBF, SVM with linear kernel, and LR 0.86, 0.88, 0.84, respectively), indicating that all the four models have good classification performance(Figure 4). Delong test showed no statistical differences in AUC between different models.
CONCLUSIONS
Our study shows that machine learning models of DKI based on TBSS are effective in discriminating ASD children from health controls. In addition, DKI derived parameters FAK, KA, and DA and LI values are potential biomarkers for differentiating early ASD from the normal. Future studies with larger and multi-center samples may be helpful to give more robust verification and further elucidate the underlying neurobiological mechanisms.Acknowledgements
None.References
[1]. Battle, D. E., Diagnostic and Statistical Manual of Mental Disorders (DSM). Codas,(2013.) 25(2): p. 191-2.doi: 10.1590/s2317-17822013000200017.
[2]. Dean, D. C., 3rd, A. Freeman, and J. Lainhart, The development of the social brain in baby siblings of children with autism. Curr Opin Psychiatry,(2020.) 33(2): p. 110-116.doi: 10.1097/YCO.0000000000000572.
[3]. Sen, B., N. C. Borle, R. Greiner, and M. R. G. Brown, A general prediction model for the detection of ADHD and Autism using structural and functional MRI. PLoS One,(2018.) 13(4): p. e0194856.doi: 10.1371/journal.pone.0194856.
[4]. Umesh Rudrapatna, S., T. Wieloch, K. Beirup, K. Ruscher, W. Mol, P. Yanev, A. Leemans, A. van der Toorn, and R. M. Dijkhuizen, Can diffusion kurtosis imaging improve the sensitivity and specificity of detecting microstructural alterations in brain tissue chronically after experimental stroke? Comparisons with diffusion tensor imaging and histology. Neuroimage,(2014.) 97: p. 363-73.doi: 10.1016/j.neuroimage.2014.04.013.
[5]. Smith, S. M., M. Jenkinson, M. W. WooLRich, C. F. Beckmann, T. E. Behrens, H. Johansen-Berg, P. R. Bannister, M. De Luca, I. Drobnjak, D. E. Flitney, R. K. Niazy, J. Saunders, J. Vickers, Y. Zhang, N. De Stefano, J. M. Brady, and P. M. Matthews, Advances in functional and structural MR image analysis and implementation as FSL. Neuroimage,(2004.) 23 Suppl 1: p. S208-19.doi: 10.1016/j.neuroimage.2004.07.051.
Figures
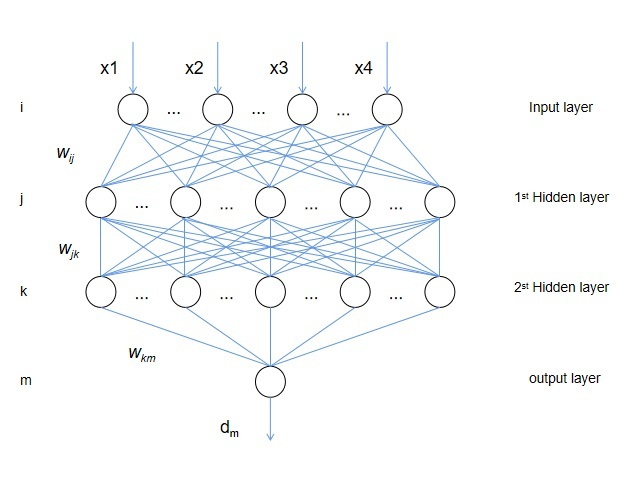
Figure 1: structure diagram of four-layer BPNN
Abbreviations: BPNN = Back propagation neural network.
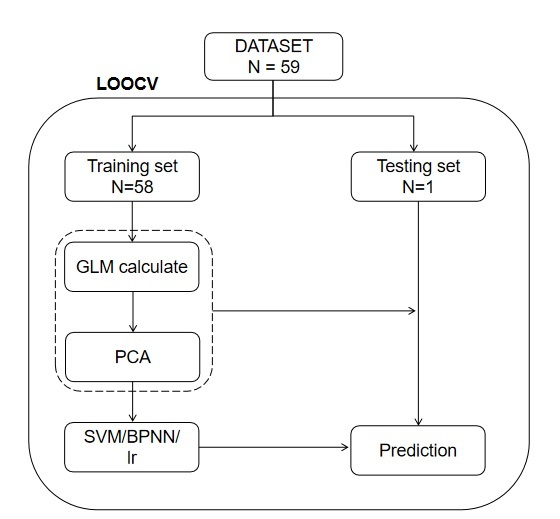
Figure 2: The flowchart of leave-one-out cross validation.
Abbreviations: PCA = principal component analysis; SVM = Support vector machine; LR = logistic regression.
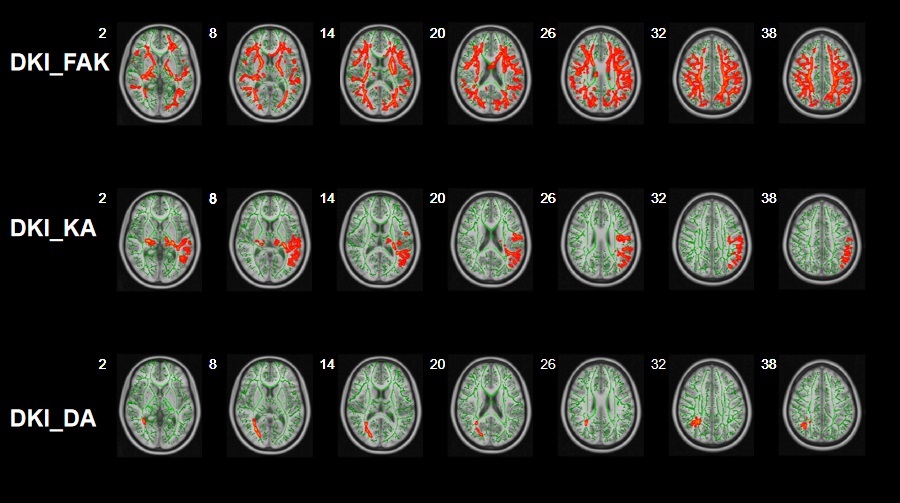
Figure 3: Group differences of TBSS in FAK,KA and DA on the brains of ASD children. Green represents mean white matter skeleton of all participants; red denotes parameter reduction in ASD children.
Abbreviations: DKI = diffusion kurtosis imaging; HCs = healthy controls; KFA = kurtosis FA; DA = axial diffusivity; KA = axial kurtosis.
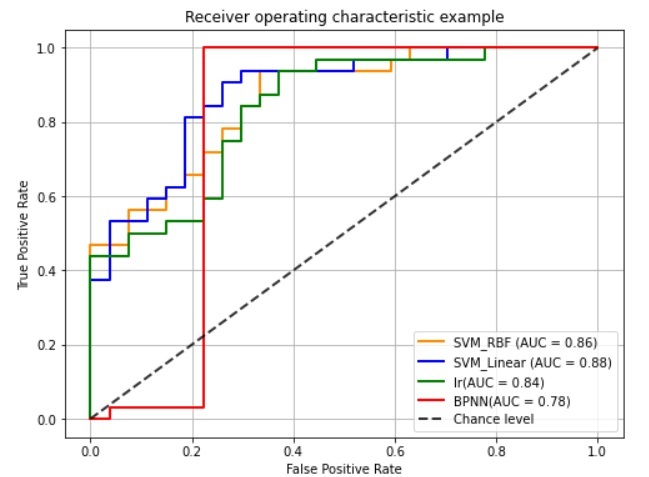
Figure 4: The receiver operating characteristic curves of different models.
Notes: The orange curves, blue curves, green curves and red curves represented the curve of SVM (RBF Kernel), SVM (linear Kernel), Logistic Regression (LR) model, and back-propagation neural network (BPNN) model, respectively.
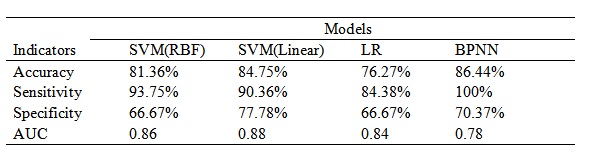
Table 1 The comparison of accuracy, sensitivity, specificity and AUC of SVM (linear), SVM(RBF), BPNN and LR.
Abbreviations: SVM = support vector machine; RBF = radial basis function; BPNN = back-propagation neural network; LR = Logistic Regression; AUC = area under the curve.