3795
Iterative model-based Rician bias correction and its application to denoising in diffusion MRI1Biomedical Engineering, School of Biomedical Engineering and Imaging Sciences, King's College London, London, United Kingdom, 2Centre for the Developing Brain, School of Biomedical Engineering and Imaging Sciences, King's College London, London, United Kingdom, 3imec-Vision Lab, Department of Physics, University of Antwerp, Antwerp, Belgium, 4Lab for Equilibrium Investigations and Aerospace, Department of Physics, University of Antwerp, Antwerp, Belgium, 5Medical Imaging Research Center, KU Leuven, Leuven, Belgium, 6Department of Electrical Engineering, ESAT/PSI, KU Leuven, Leuven, Belgium
Synopsis
Keywords: Data Analysis, Diffusion/other diffusion imaging techniques
Rician bias is a long-standing problem in diffusion MRI. We propose a simple iterative strategy to mitigate the problem when a voxel-wise model of the signal is available, and demonstrate its efficacy when fitting spherical harmonics and when included in a denoising strategy.Introduction
The Rician bias1 introduced into the MR signal by taking the magnitude of the complex signal is a long-standing problem for diffusion MRI due to its low SNR and the instability of the phase of the signal. Many approaches have been proposed to mitigate its effects, either by correcting the raw magnitude signal2–4, or by accounting for the bias when estimating parameters of interest4–7.Here we propose to correct the MR signals based on the availability of a voxel-wise model, and assess its performance when included as part of an established denoising method.
Methods
The method requires a suitable over-determined model $$$H(c) = m$$$ that can be used to fit and predict the expected signals $$$p = H(H^{-1}(m))$$$ (the Spherical Harmonic transform, for example). Starting with initial measurements $$$m_0$$$, the approach iterates over the following steps:- Obtain predictions of the true signals $$$\mathbf{p}_n = \mathbf{H}(\mathbf{H}^{-1}(\mathbf{m}_{n-1}))$$$ using the model $$$\mathbf{H}$$$ with the current estimate of the corrected signals $$$\mathbf{m}_{n-1}$$$:
- Compute the expectation value $$$\mathbf{q}_n$$$ and standard deviation $$$\mathbf{s}_n$$$ of each measurement assuming a Rician noise model with true signals $$$\mathbf{p}_n$$$ and noise $$$\sigma_n$$$ (see below)
- Compute the residuals between the measurement expectation values $$$\mathbf{q}_n$$$ and the original measurements $$$\mathbf{m}_0$$$ as $$$\mathbf{r}_n = \mathbf{m}_0 - \mathbf{q}_n$$$
- Compute the corrected measurements by scaling each of the residuals $$$\mathbf{r}_n$$$ according to their corresponding standard deviation $$$\mathbf{s}_n$$$, and adding these back to the predicted signals $$$\mathbf{p}_n$$$: $$$\mathbf{m}_n = \mathbf{p}_n + \sigma_n \mathbf{r}_n/\mathbf{s}_n$$$ (with element-wise division in this case).
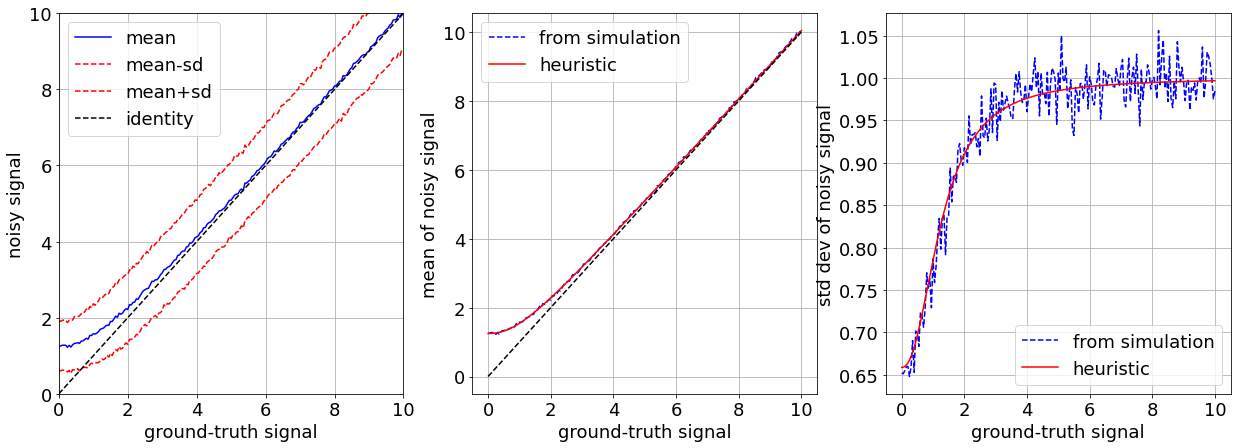
Computing the expectation value and standard deviation of the magnitude signals can be done using several approaches. Here, we employ simple heuristic equations that have been manually tuned to match simulated data. The specific equations are: $$$q = (p^r +1.65)^{1/r}$$$ and $$$s = (p^r+1.12)/(p^r/1.7)$$$, with $$$r=2.25$$$ (assuming unit standard deviation). The accuracy of these equations can be gauged from Fig 1.
This approach also requires an estimate of the noise level $$$\sigma_n$$$ (which may evolve as the algorithm iterates). A number of approaches have been proposed for this8,9, one of which is the Marchenko-Pastur PCA denoising technique10. The latter is particularly compelling since the truncated PCA decomposition can also serve as the model $$$\mathbf{H}$$$, making it an ideal fit to the proposed approach.
We therefore propose to incorporate Rician bias correction into the MP-PCA denoising framework, by feeding (corrected) inputs $$$\mathbf{m}_{n-1}$$$ into MP-PCA to provide both the predictions $$$\mathbf{p}_n$$$ and the noise level $$$\sigma_n$$$ in step 1 of the iterative scheme above.
Results & Discussion
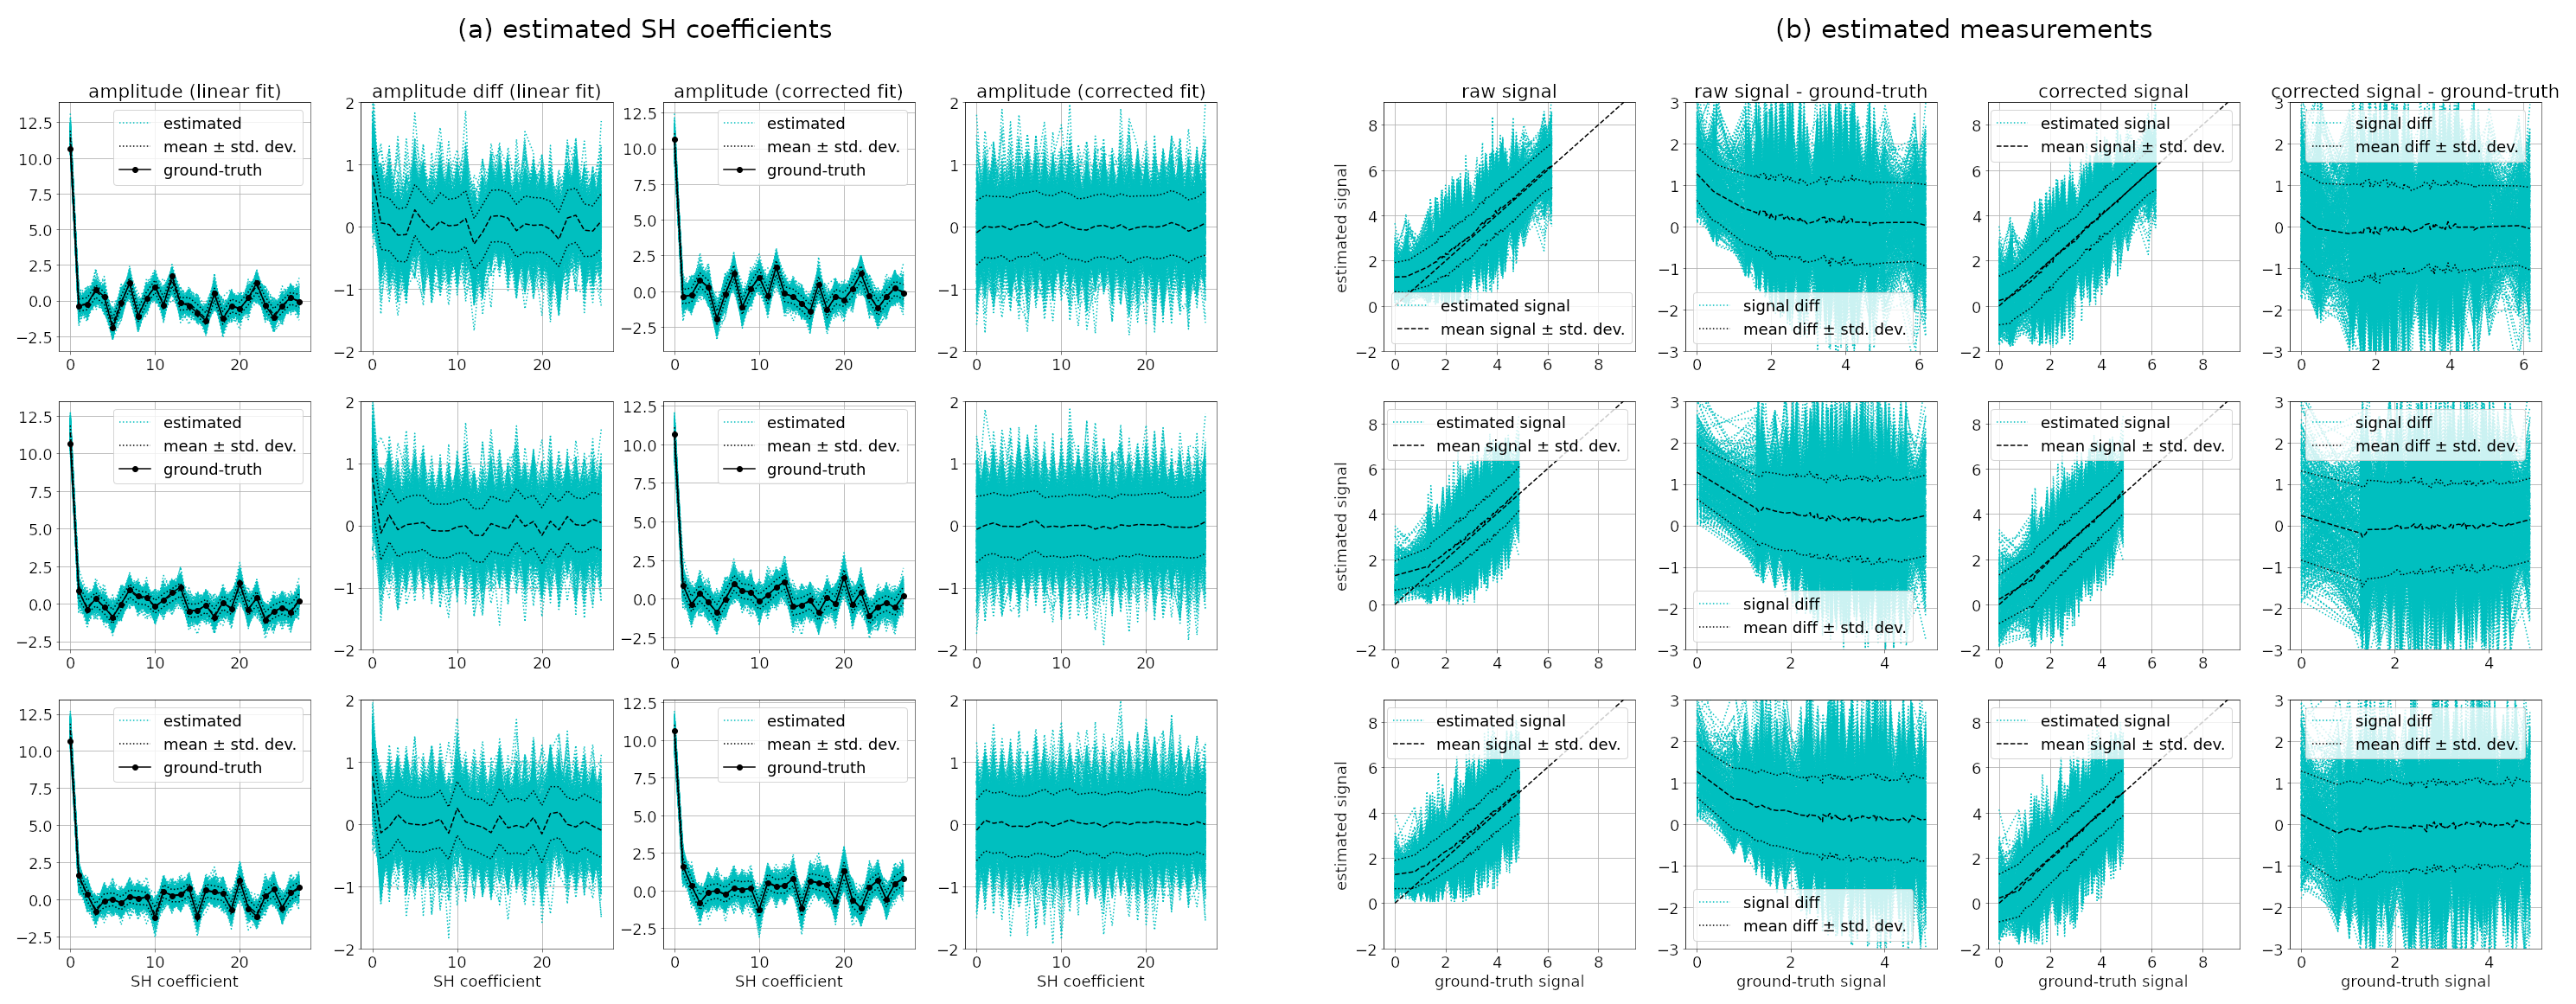
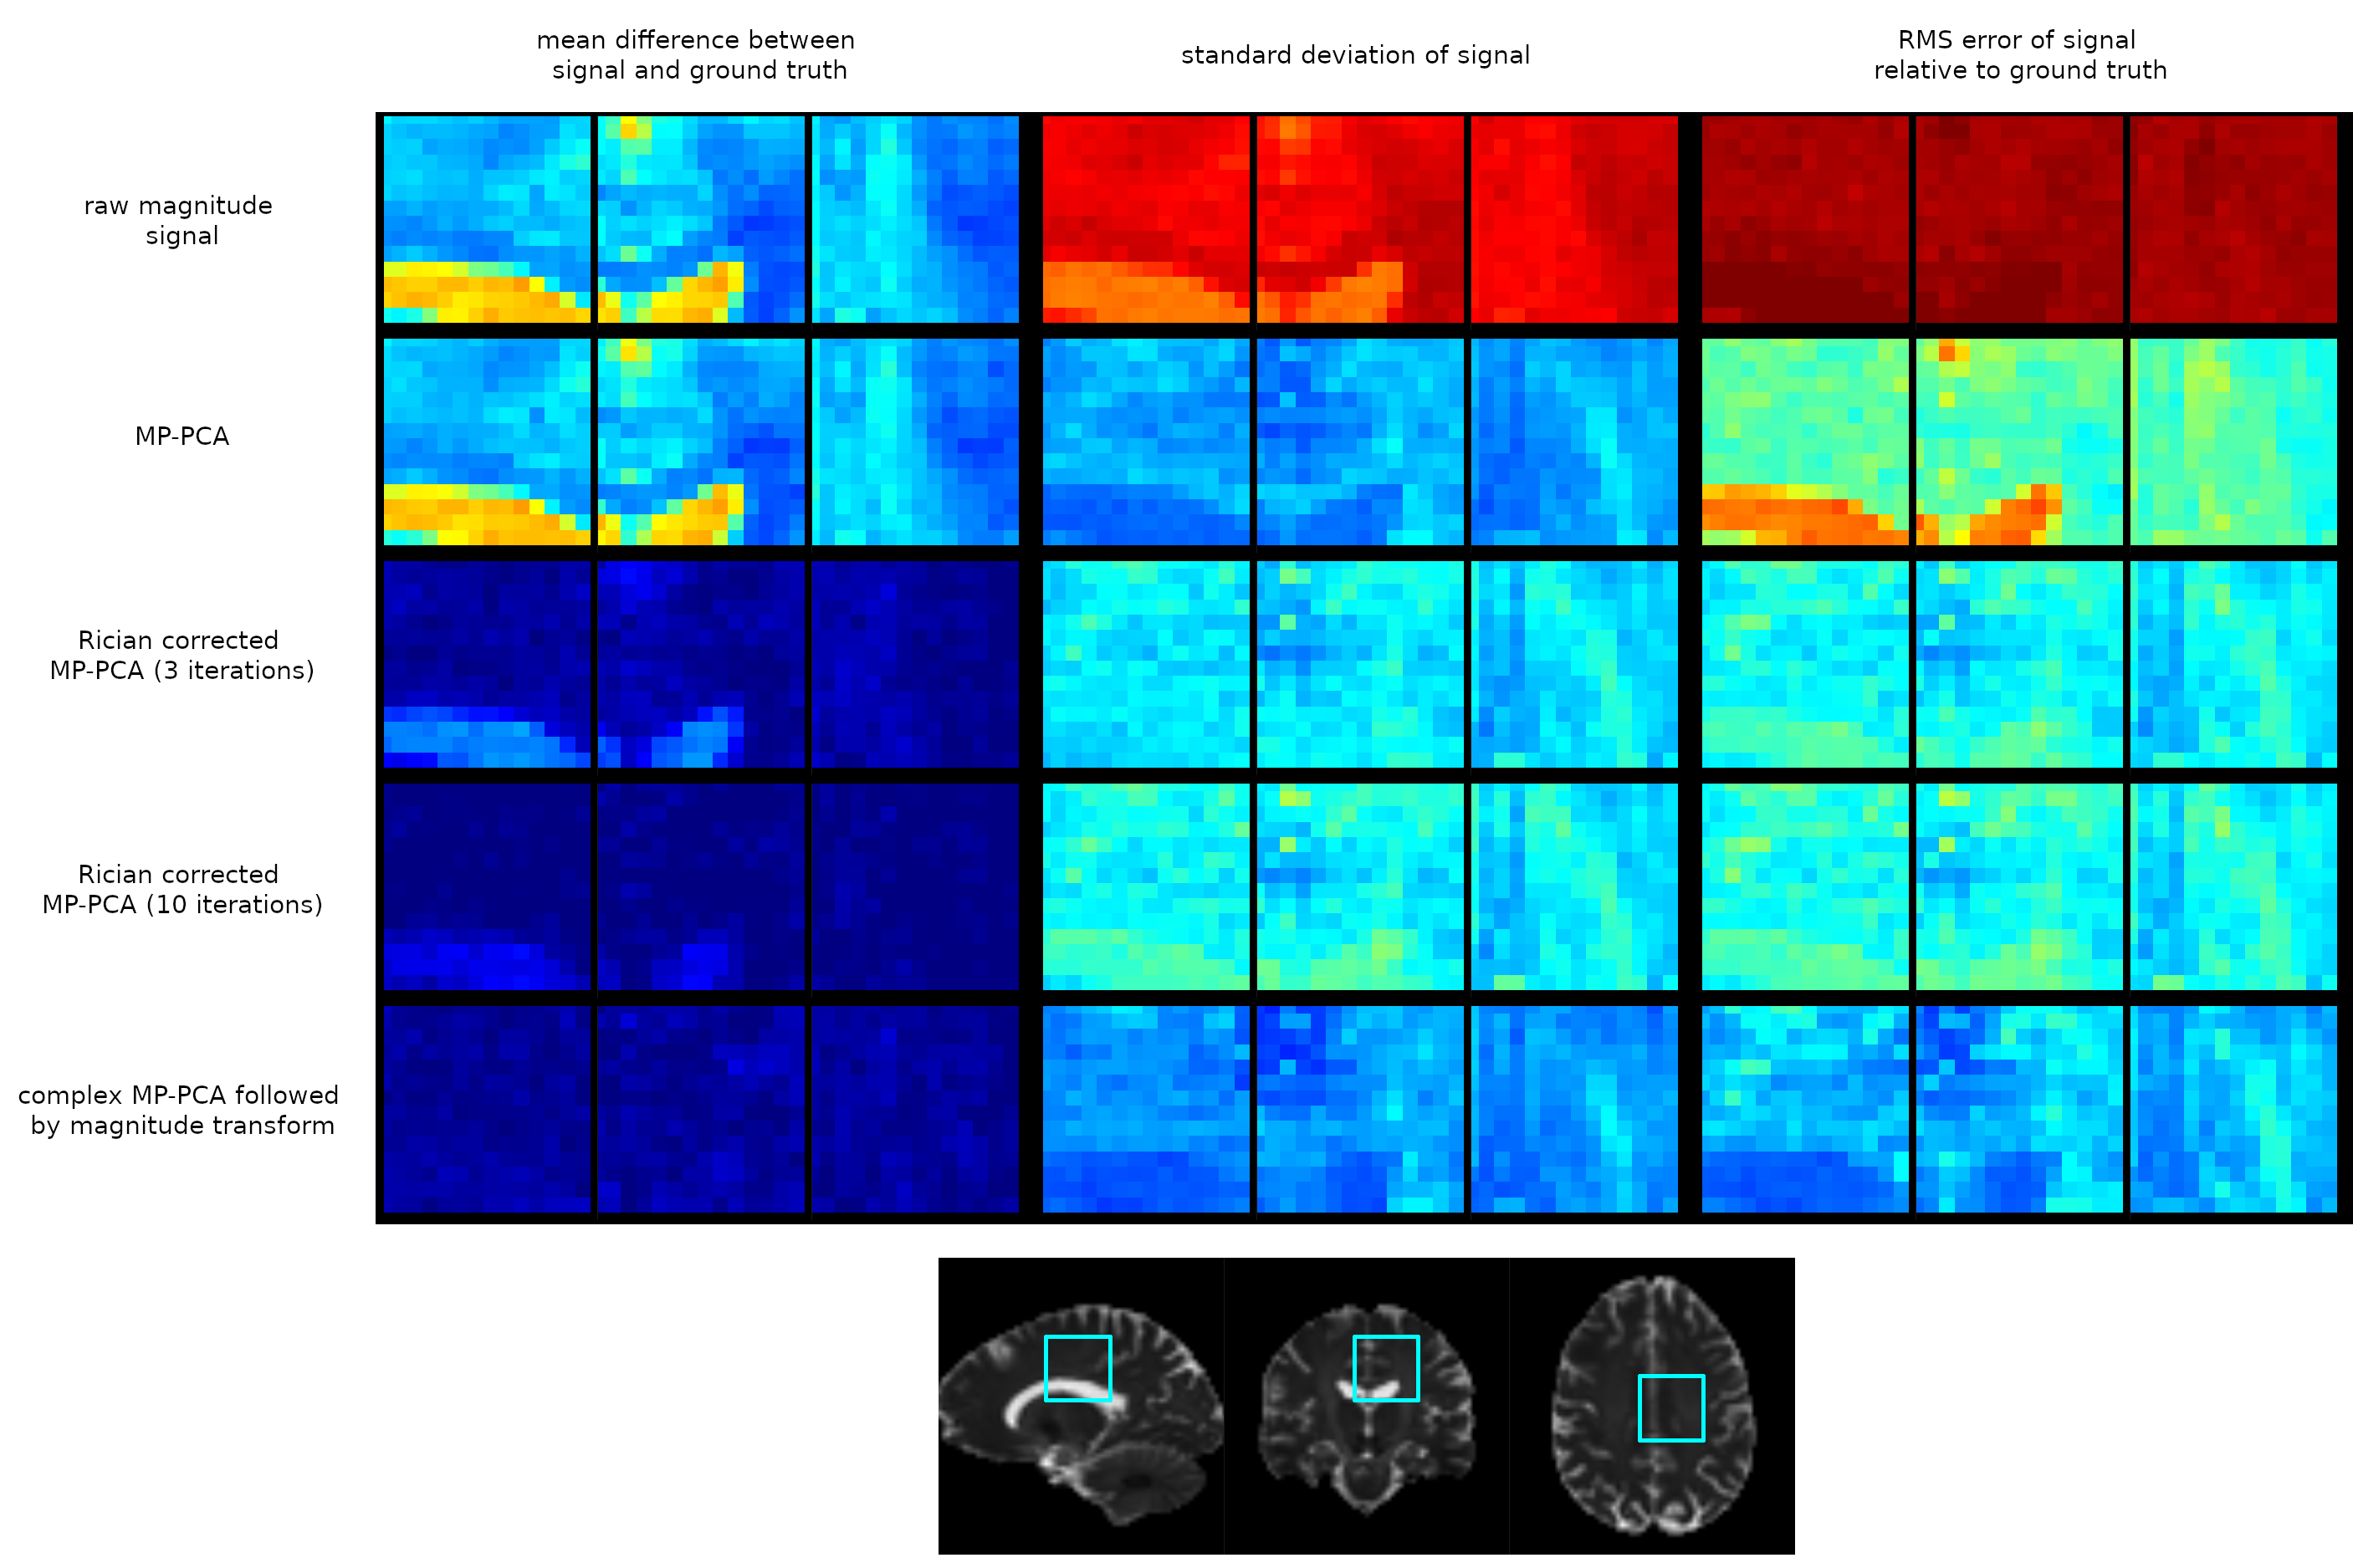
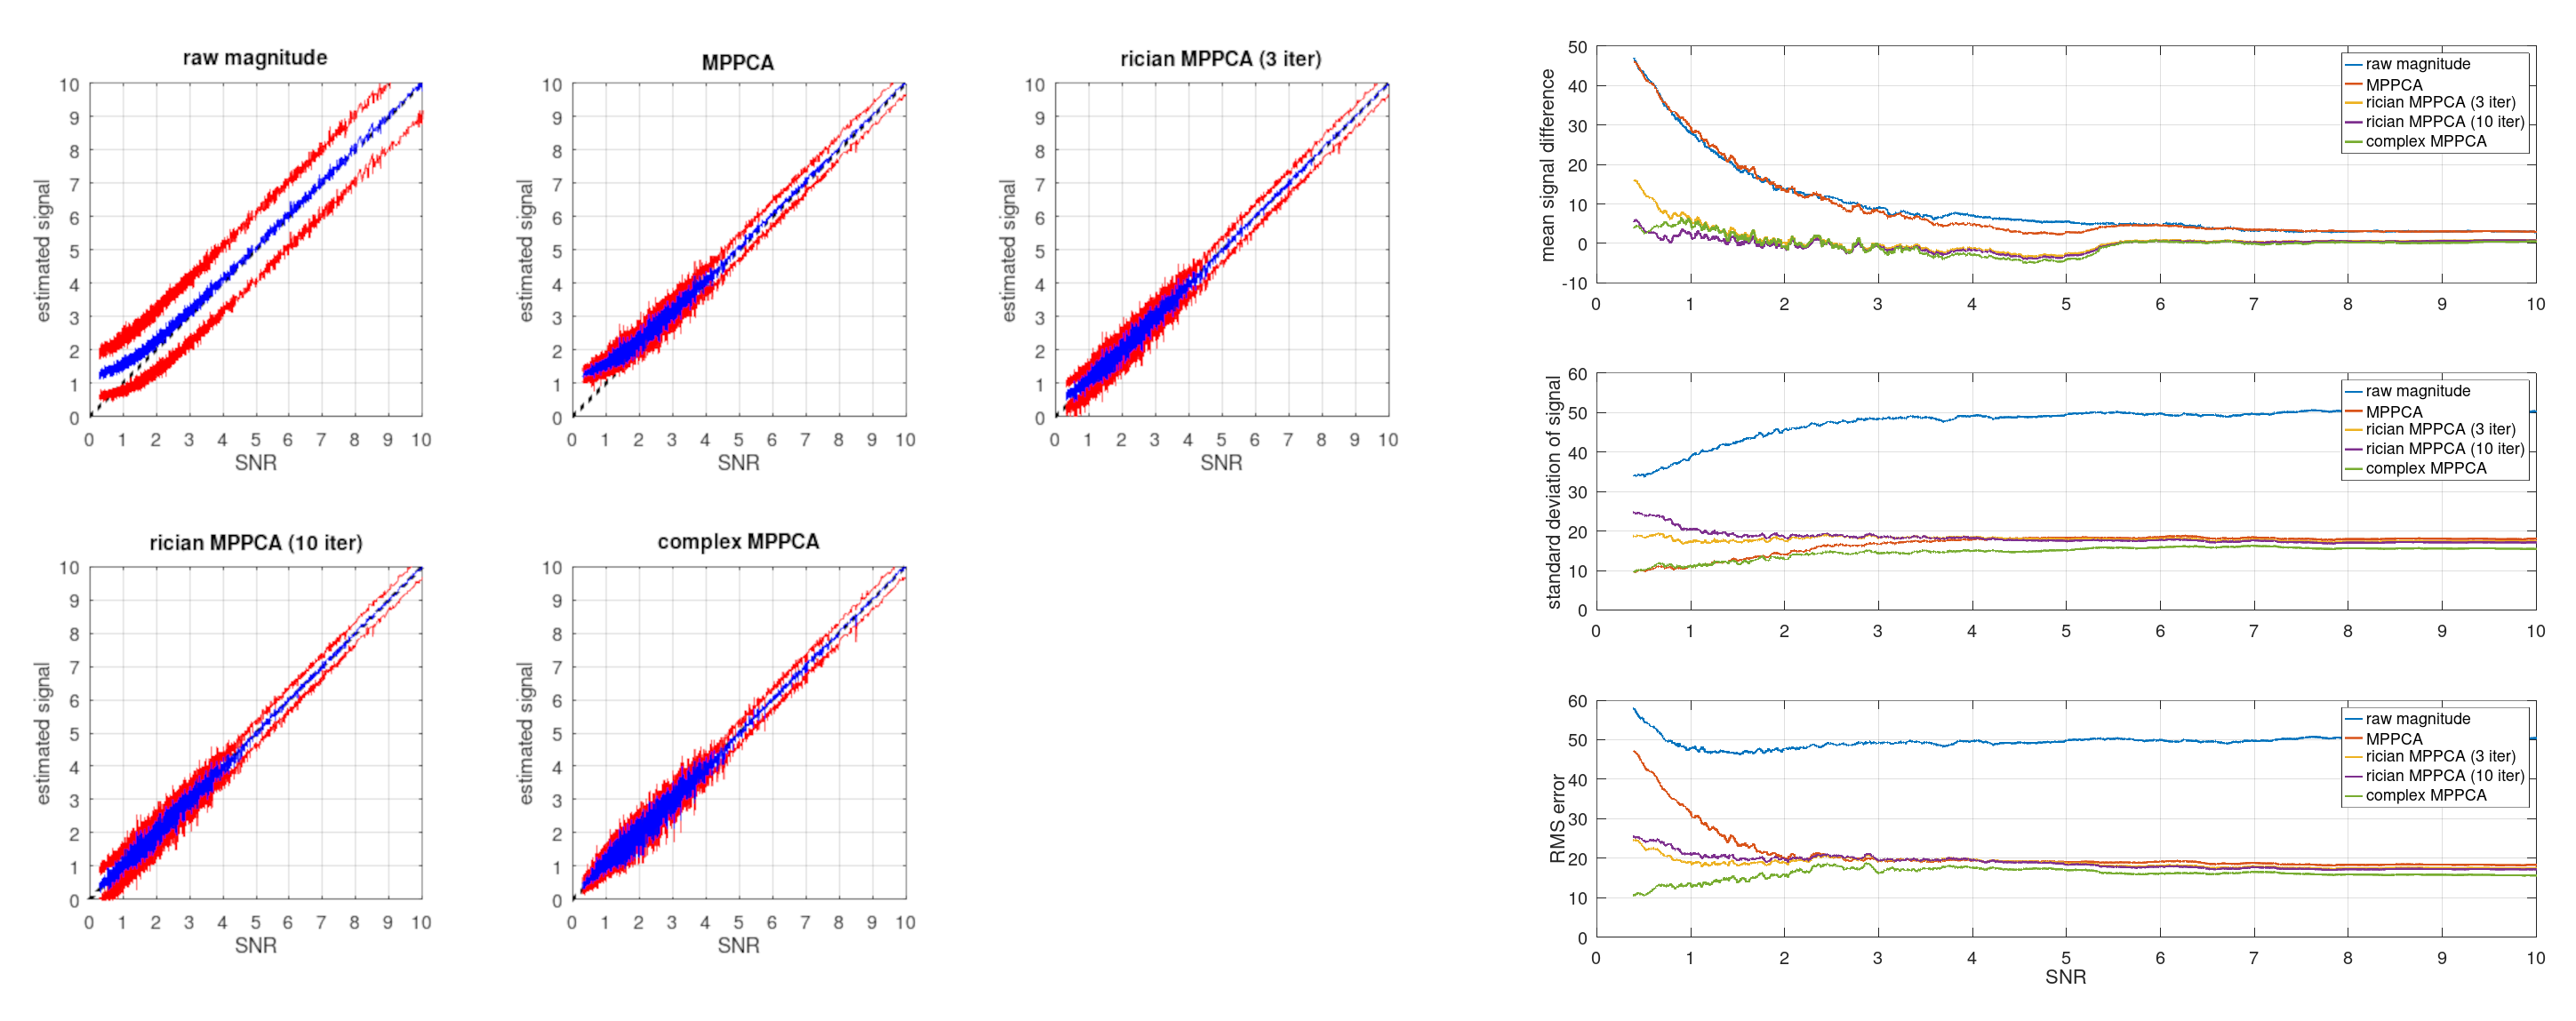
We assess the correction approach first on a single dMRI shell using a spherical harmonic fit as the model, assuming a known constant noise level $$$\sigma$$$ (SNR=3) with randomly generated SH coefficients. Fig 2(a) shows the estimated SH coefficients (i.e. the parameters $$$\mathbf{c}$$$ after 3 iterations of the proposed approach, for 500 different noise realisations, applied to 3 distinct sets of simulated signals. In each case, the proposed Rician bias correction provides SH coefficient estimates that show a much lower average bias compared to the uncorrected case. Fig 2(b) shows the corrected measurements compared to their ground truth values. We can see that the bias is on average largely eliminated, with some residual bias remaining at the very low end of the range for SNR < 0.5.The Rician bias corrected MP-PCA approach was assessed by generating ‘ground-truth’ measurements obtained by forward-modelling a multi-shell multi-tissue CSD11 fit applied to the BATMAN dataset12, then adding complex noise of known standard deviation and taking their magnitude, for an effective SNR=8 at b=0 (measured in the periventricular WM). For comparison, the complex and magnitude data were both denoised using the regular MP-PCA approach. The results of 100 different noise realisations performed on a small region of interest are shown in Fig 3, and show a clear reduction in bias, and a reduction in RMS error compared to regular magnitude MP-PCA. This is also evident from Fig 4, showing the corrected measurements plotted against their corresponding ‘ground-truth’ for the same simulations, for each approach tested. Using more iterations of the Rician bias correction can be seen to further reduce the bias at the low SNR range, at the expense of a moderate increase in standard deviation, with little to no gain in terms of RMS error relative to ground-truth.
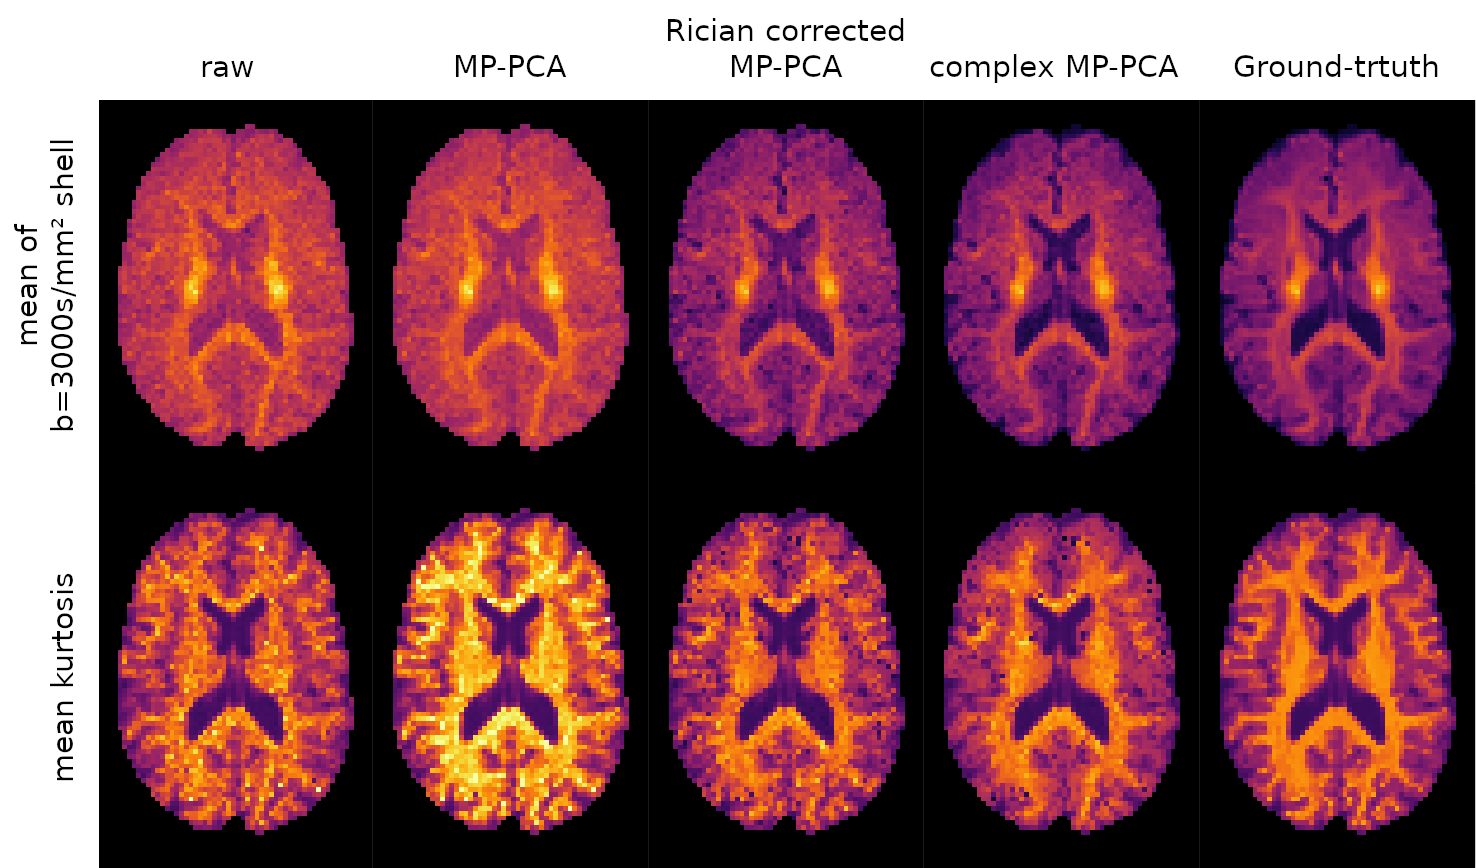
Fig 5 shows the mean signal for highest shell, and the mean kurtosis (MK) estimated from a constrained weighted linear least-squares fit13,14 to the data, for each approach tested. The proposed Rician bias corrected MP-PCA approach clearly reduces the bias compared to the ground-truth values.
These results also show that denoising in the complex domain is clearly superior and should be employed whenever complex data are available.
Conclusion
The proposed approach provides a simple and effective strategy to mitigate the effects of Rician bias in diffusion MRI when complex data are not available.Acknowledgements
This work was supported by ERC grant agreement no. 319456, by core funding from the Wellcome/EPSRC Centre for Medical Engineering [WT203148/Z/16/Z] and by the National Institute for Health Research (NIHR) Biomedical Research Centre based at Guy’s and St Thomas’ NHS Foundation Trust and King’s College London and/or the NIHR Clinical Research Facility. The views expressed are those of the author(s) and not necessarily those of the NHS, the NIHR or the Department of Health and Social Care. BJ gratefully acknowledges support from Belgian Science Policy Prodex (Grant ISLRA 2009–1062).References
1. Gudbjartsson, H. & Patz, S. The Rician distribution of noisy MRI data. Magn. Reson. Med. 34, 910–914 (1995).
2. Koay, C. G. & Basser, P. J. Analytically exact correction scheme for signal extraction from noisy magnitude MR signals. J. Magn. Reson. 179, 317–322 (2006).
3. Koay, C. G., Özarslan, E. & Basser, P. J. A signal transformational framework for breaking the noise floor and its applications in MRI. J. Magn. Reson. 197, 108–119 (2009).
4. Varadarajan, D. & Haldar, J. P. A majorize-minimize framework for Rician and non-central chi MR images. IEEE Trans. Med. Imaging 34, 2191–2202 (2015).
5. Andersson, J. L. R. Maximum a posteriori estimation of diffusion tensor parameters using a Rician noise model: why, how and but. NeuroImage 42, 1340–1356 (2008).
6. Kaden, E. & Kruggel, F. Nonparametric Bayesian inference of the fiber orientation distribution from diffusion-weighted MR images. Med. Image Anal. (2012) doi:10.1016/j.media.2012.01.004.
7. Clarke, R. A. et al. Noise correction on Rician distributed data for fibre orientation estimators. IEEE Trans. Med. Imaging 27, 1242–1251 (2008).
8. Manjón, J. V., Coupé, P. & Buades, A. MRI noise estimation and denoising using non-local PCA. Med. Image Anal. 22, 35–47 (2015).
9. Coupé, P. et al. Robust Rician noise estimation for MR images. Med. Image Anal. 14, 483–493 (2010).
10. Veraart, J. et al. Denoising of diffusion MRI using random matrix theory. NeuroImage 142, 394–406 (2016).
11. Jeurissen, B., Tournier, J.-D., Dhollander, T., Connelly, A. & Sijbers, J. Multi-tissue constrained spherical deconvolution for improved analysis of multi-shell diffusion MRI data. NeuroImage 103, 411–426 (2014).
12. Tahedl, M. B.A.T.M.A.N.: Basic and Advanced Tractography with MRtrix for All Neurophiles. (2017) doi:10.17605/OSF.IO/FKYHT.
13. Veraart, J., Sijbers, J., Sunaert, S., Leemans, A. & Jeurissen, B. Weighted linear least squares estimation of diffusion MRI parameters: strengths, limitations, and pitfalls. NeuroImage 81, 335–346 (2013).
14. Tabesh, A., Jensen, J. H., Ardekani, B. A. & Helpern, J. A. Estimation of tensors and tensor-derived measures in diffusional kurtosis imaging. Magn. Reson. Med. 65, 823–836 (2011).
Figures