3794
Higher-order diffusion MRI data acquired in clinical settings: what are the pitfalls, and how to correct them?
Jenny Chen1, Benjamin Ades-Aron1, Saurabh Maithani1, Yvonne Lui1, Dmitry S. Novikov1, Jelle Veraart1, and Els Fieremans1
1New York University Grossman School of Medicine, New York, NY, United States
1New York University Grossman School of Medicine, New York, NY, United States
Synopsis
Keywords: Data Acquisition, Diffusion/other diffusion imaging techniques, Clinical Translation, DKI
Multi-shell diffusion MRI (dMRI) opens up the opportunity for microstructure mapping, but is not routinely acquired in clinics. This study retrospectively analyzed a large diffusion kurtosis imaging (DKI) dataset (N=7984) acquired as multi-series in the clinic and proposes a workflow to inspect the data before preprocessing. Automated analysis of dicom headers shows about 36% with incomplete acquisition, likely due to time constraints and patient discomfort, and 32% with image discrepancies. Finally, we show that signal variations between series occur and need to be corrected for in preprocessing. Our results indicate higher-order dMRI in the clinical setting is feasible.Introduction
Multi-shell diffusion MRI (dMRI) opens up the opportunity for more biophysical modeling of tissue microstructure [1,2]. Acquiring such data in a clinical setting, while not commonplace [3,4], creates an unprecedented opportunity to evaluate microstructure mapping in a wide range of patients. In this study, we report on the retrospective analysis of a large (N=7984) dataset of multi-shell dMRI acquired in clinic, the encountered pitfalls, and how to correct them.Methods
Clinical Data: A retrospective, HIPAA compliant study, approved by the local institutional Internal Review Board (IRB), included a cohort of 7984 patients (mean age = 50.95± 20.76-year-old, range = 1-day to 102-year-old; 3272 male, 4712 female), who presented for clinical brain MRI in an outpatient center and were scanned on a Siemens Magnetom Prisma 3T or Skyra 3T between October 2014 and June 2020. The dMRI protocol was split into three subsequent sequences: (1) a clinical DTI sequence labeled as Meso (3 b=0, 20 b=1000 s/mm2) that is used for clinical read and to create DTI maps; (2) a high b-value sequence labeled as Meso_Research (2 b=0, 4 b=250, 60 b=2000 s/mm2) that combined with (1) can create DKI [1] or other microstructure maps [5], and; (3) a reversed-encoding Posterior-Anterior (PA) sequence labeled as Meso_PA (1b=0) for distortion correction [15]. Imaging parameters were: TE=70–96ms and TR=3200–4000ms on Prisma, TE = 95–100ms and TR=3500–4300ms on Skyra, 50 slices, resolution=1.7x1.7x3mm3, 6/8 partial Fourier, for a total acquisition time of about 6 minutes.STEP 1: Automatic analysis of dMRI dicom headers (figure 1) to detect discrepancies and determine datasets for preprocessing [6]:
Stage 1: Searching dicom header series descriptions for labels “Meso”, “Meso_Research”, and “Meso_PA”, to determine which preprocessing to run:
(a) DKI: all three series available;
(b) DKI wo (without) PA: PA series missing;
(c) DTI (diffusion tensor imaging): Research series missing;
(d) DTI wo PA: only Meso series available.
Stage 2: Checking for incomplete sequences: Meso series were labeled incomplete if they had <6 b=1000 s/mm2 (minimum number required to calculate diffusion tensor [7]) and Research series were labeled incomplete if they had <15 b=2000 s/mm2 (minimum number required for kurtosis tensor [1]). Scans with incomplete Meso series were omitted while incomplete Research series were recategorized as DTI or DTI wo PA.
Stage 3: Detection of discrepancies in image parameters:
(a) Ok for automatic preprocessing;
(b) Fixable without image quality loss, e.g. different number of slices among series, resolved by padding image matrices; or partial Fourier 7/8 or no partial Fourier, resolved by adjusting Gibb’s correction;
(c) Fixable with degraded image quality, e.g. matrix reconstructed with interpolation, handled by downsampling and leaving out denoising from preprocessing;
(d) Not fixable, e.g. series with inconsistent voxel dimensions, which were omitted from preprocessing (N=10 in total).
STEP 2 Preprocessing (figure 2): DESIGNER preprocessing pipeline consists of: (a) MP-PCA nonuniform-patch denoising [8,9] with eigenvalue shrinkage [10], (b) Removal of Partial Fourier induced Gibbs (RPG) [11], (c) EPI distortion correction, (d) Eddy current and motion correction [12], (e) b=0 normalization, and (f) Rician bias correction [13]. b=0 normalization involves voxelwise rescaling with b=0 ratio (ratio of Gaussian smoothed (3 sigma) b=0s from each series). After preprocessing, DTI/DKI maps were extracted using weighted linear least squares fit [14].
Results
Figure 3 shows the classification after running stages 1,2 of the automated analysis to check for series completeness. The largest group was 64% of 7984 patients that had all three series from which distortion-corrected DKI maps can be derived. Since the PA was acquired after the Research series, the 2nd largest group was 29% with only Meso series that can be used to create DTI maps without distortion correction. Only 1% of 7894 were omitted.Figure 4 shows the further classification after running stage 3 to check for image discrepancies, revealing that 67.79% is suitable for automated processing, while 13.12% could be fixed without quality loss, and 19.09% with quality loss.
Figure 5 shows scatterplots of mean b=0 of the two series (Meso and Research), illustrating the prevalence of signal variations between series, which may be caused by slightly different MRI settings (e.g. shimming). Representative DKI parametric maps with and without b=0 rescaling demonstrate the change in overall contrast due to signal variations, particularly in MD and MK, highlighting the need to correct for it.
Discussion and Conclusion
We retrospectively analyzed DKI data acquired in a routine clinical setting. While the overall scan time was within 6 minutes, the protocol was set-up as multi-series to accommodate clinical reads (splitting b=1000 from b=2000 s/mm2) and obtain a separate PA-acquisition. Consequently, series were missing and incomplete, with an overall success rate of acquiring all series in about 64% (figure 3). Furthermore, image discrepancies between series need to be detected and rectified during preprocessing, with 19% of datasets resulting in quality loss (figure 4). Finally, signal variation from series to series becomes an issue, but can be corrected with b=0-normalization (figure 5). Overall, clinically acquired higher-order dMRI data comes with certain pitfalls, but is well within reach.Future work may include grouping scans by year, patient status, etc. to investigate their effect on acquisition quality.
Acknowledgements
Research was supported by the National Institute of Neurological Disorders and Stroke of the NIH under awards R01 NS088040 and R01 EB027075, and by the Hirschl foundation and was performed at the Center of Advanced Imaging Innovation and Research (CAI2R, www.cai2r.net), a Biomedical Technology Research Center supported by NIBIB with the award P41 EB017183.References
- Jensen JH, Helpern JA. MRI quantification of non-Gaussian water diffusion by kurtosis analysis. NMR Biomed. 2010;23(7):698-710. doi:10.1002/nbm.15182.
- Zhang H, Schneider T, Wheeler-Kingshott CA, Alexander DC. NODDI: Practical in vivo neurite orientation dispersion and density imaging of the human brain. NeuroImage. 2012;61(4):1000-1016. doi:https://doi.org/10.1016/j.neuroimage.2012.03.0723.
- Rosenkrantz AB, Padhani AR, Chenevert TL, et al. Body diffusion kurtosis imaging: Basic principles, applications, and considerations for clinical practice. J Magn Reson Imaging. 2015;42(5):1190-1202. doi:https://doi.org/10.1002/jmri.249854.
- Michailovich O, Rathi Y. Fast and accurate reconstruction of HARDI data using compressed sensing. Med Image Comput Comput-Assist Interv MICCAI Int Conf Med Image Comput Comput-Assist Interv. 2010;13(Pt 1):607-614. doi:10.1007/978-3-642-15705-9_745.
- Novikov DS, Fieremans E, Jespersen SN, Kiselev VG. Quantifying brain microstructure with diffusion MRI: Theory and parameter estimation. NMR Biomed. 2019;32(4):e3998. doi:https://doi.org/10.1002/nbm.39986.
- Ades-Aron B, Veraart J, Kochunov P, et al. Evaluation of the accuracy and precision of the diffusion parameter EStImation with Gibbs and NoisE removal pipeline. NeuroImage. 2018;183:532-543. doi:https://doi.org/10.1016/j.neuroimage.2018.07.0667.
- Ni H, Kavcic V, Zhu T, Ekholm S, Zhong J. Effects of Number of Diffusion Gradient Directions on Derived Diffusion Tensor Imaging Indices in Human Brain. Am J Neuroradiol. 2006;27(8):1776-1781.8.
- Veraart J, Fieremans E, Novikov DS. Diffusion MRI noise mapping using random matrix theory. Magn Reson Med. 2016;76(5):1582-1593. doi:https://doi.org/10.1002/mrm.260599.
- Cordero-Grande L, Christiaens D, Hutter J, Price AN, Hajnal JV. Complex diffusion-weighted image estimation via matrix recovery under general noise models. NeuroImage. 2019;200:391-404. doi:https://doi.org/10.1016/j.neuroimage.2019.06.03910.
- Gavish M, Donoho DL. Optimal Shrinkage of Singular Values. IEEE Trans Inf Theor. 2017;63(4):2137-2152. doi:10.1109/TIT.2017.265380111.
- Lee HH, Novikov DS, Fieremans E. Removal of partial Fourier-induced Gibbs (RPG) ringing artifacts in MRI. Magn Reson Med. 2021;86(5):2733-2750. doi:10.1002/mrm.2883012.
- Andersson JLR, Sotiropoulos SN. An integrated approach to correction for off-resonance effects and subject movement in diffusion MR imaging. NeuroImage. 2016;125:1063-1078. doi:10.1016/j.neuroimage.2015.10.01913.
- Koay CG, Basser PJ. Analytically exact correction scheme for signal extraction from noisy magnitude MR signals. J Magn Reson San Diego Calif 1997. 2006;179(2):317-322. doi:10.1016/j.jmr.2006.01.01614.
- Veraart J, Sijbers J, Sunaert S, Leemans A, Jeurissen B. Weighted linear least squares estimation of diffusion MRI parameters: strengths, limitations, and pitfalls. NeuroImage. 2013;81:335-346. doi:10.1016/j.neuroimage.2013.05.028
- Andersson JLR, Skare S, Ashburner J. How to correct susceptibility distortions in spin-echo echo-planar images: application to diffusion tensor imaging. NeuroImage. 2003;20(2):870-888. doi:10.1016/S1053-8119(03)00336-7
Figures
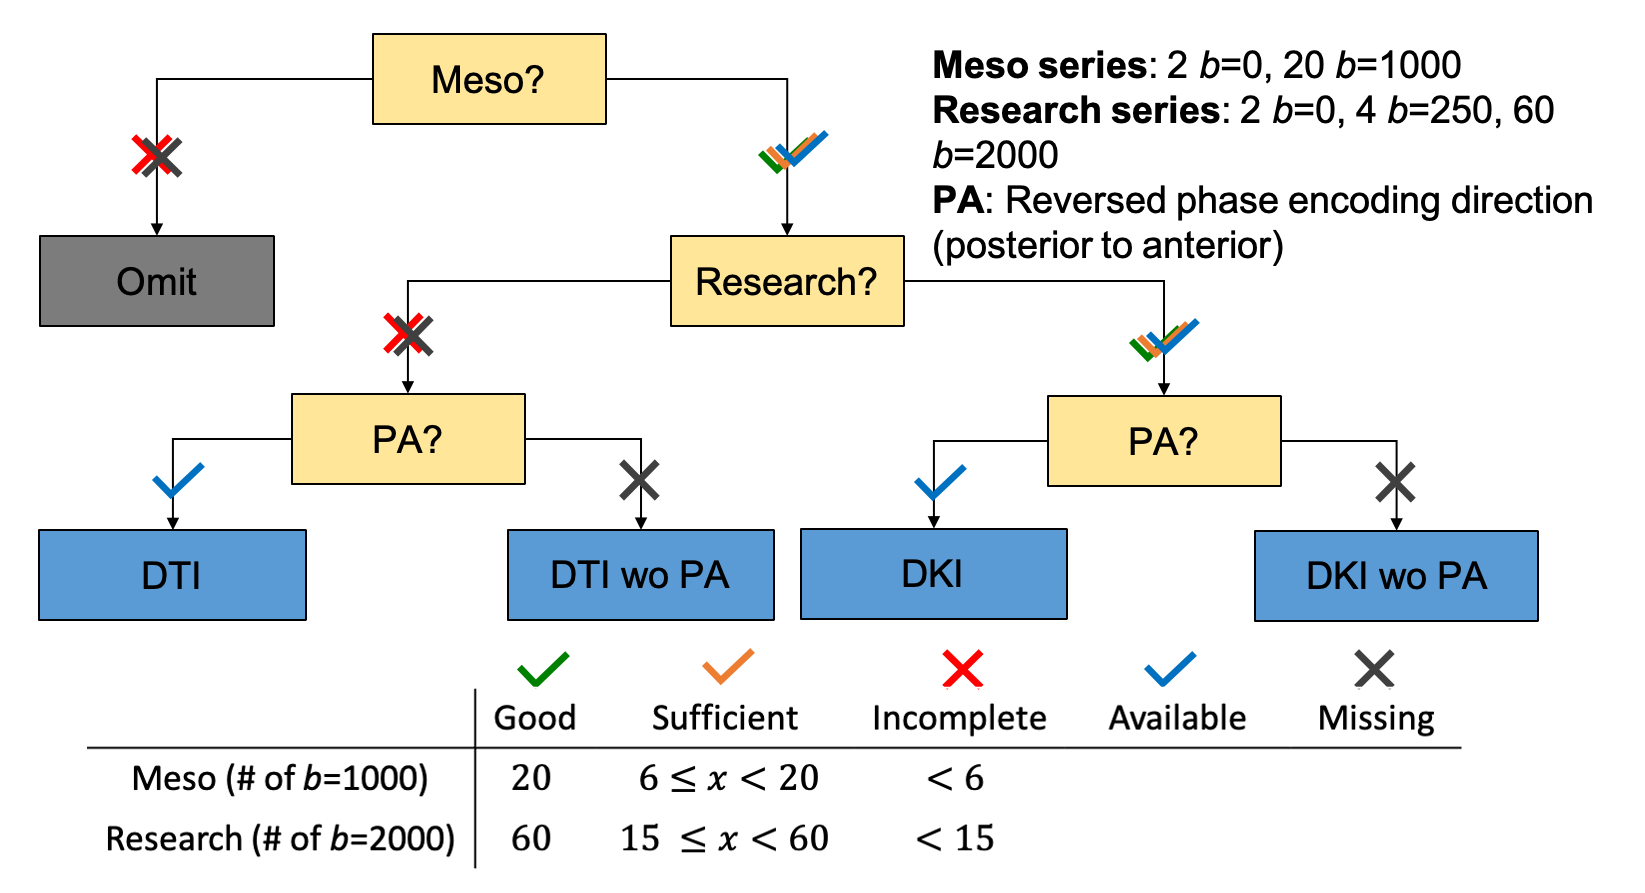
Figure 1. Flow diagram of initial check on acquired dMRI data to detect missing series and incomplete sequences. The data were categorized into four groups: DTI with and without PA and DKI or higher-order modeling with and without PA. wo = without
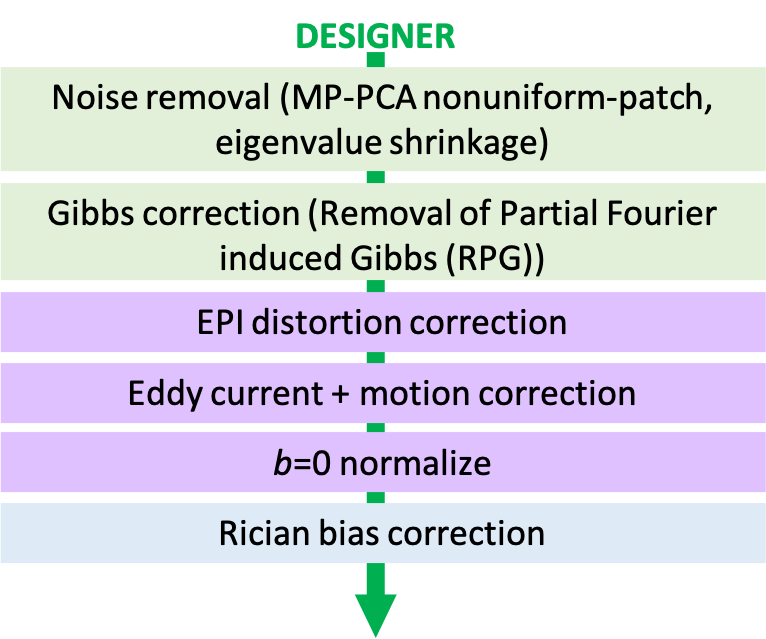
Figure 2. Flow diagram of DESIGNER preprocessing pipeline for standard clinical dMRI data.
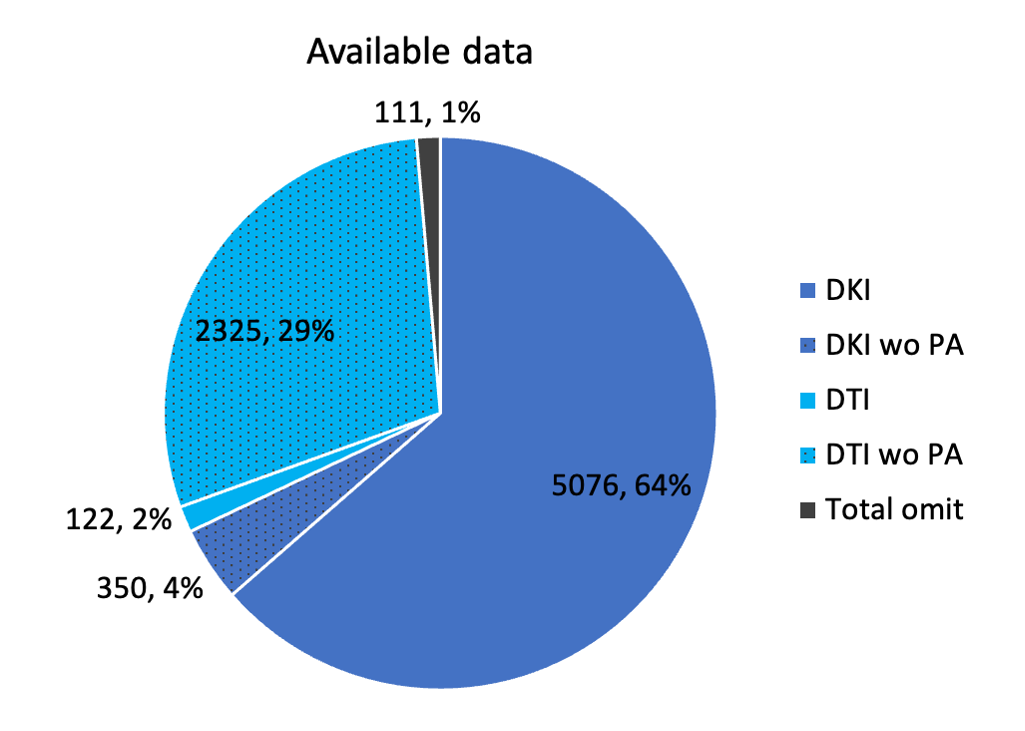
Figure 3. Breakdown of diffusion parameter estimation that can be done with available acquired data from 7984 scans. wo = without.
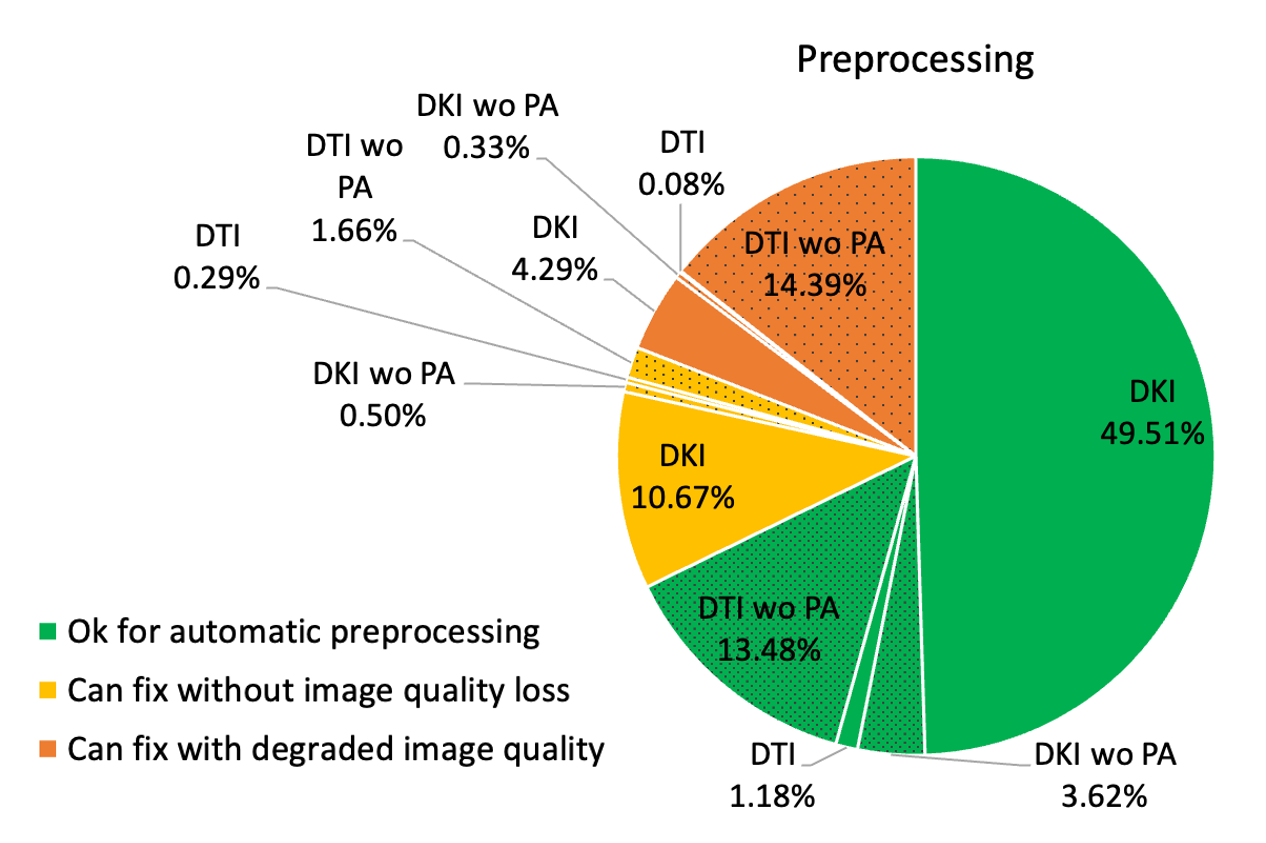
Figure 4. Breakdown of 7873 scan’s dMRI preprocessing image status based on discrepancies in image specifications such as partial Fourier and interpolation. wo = without.
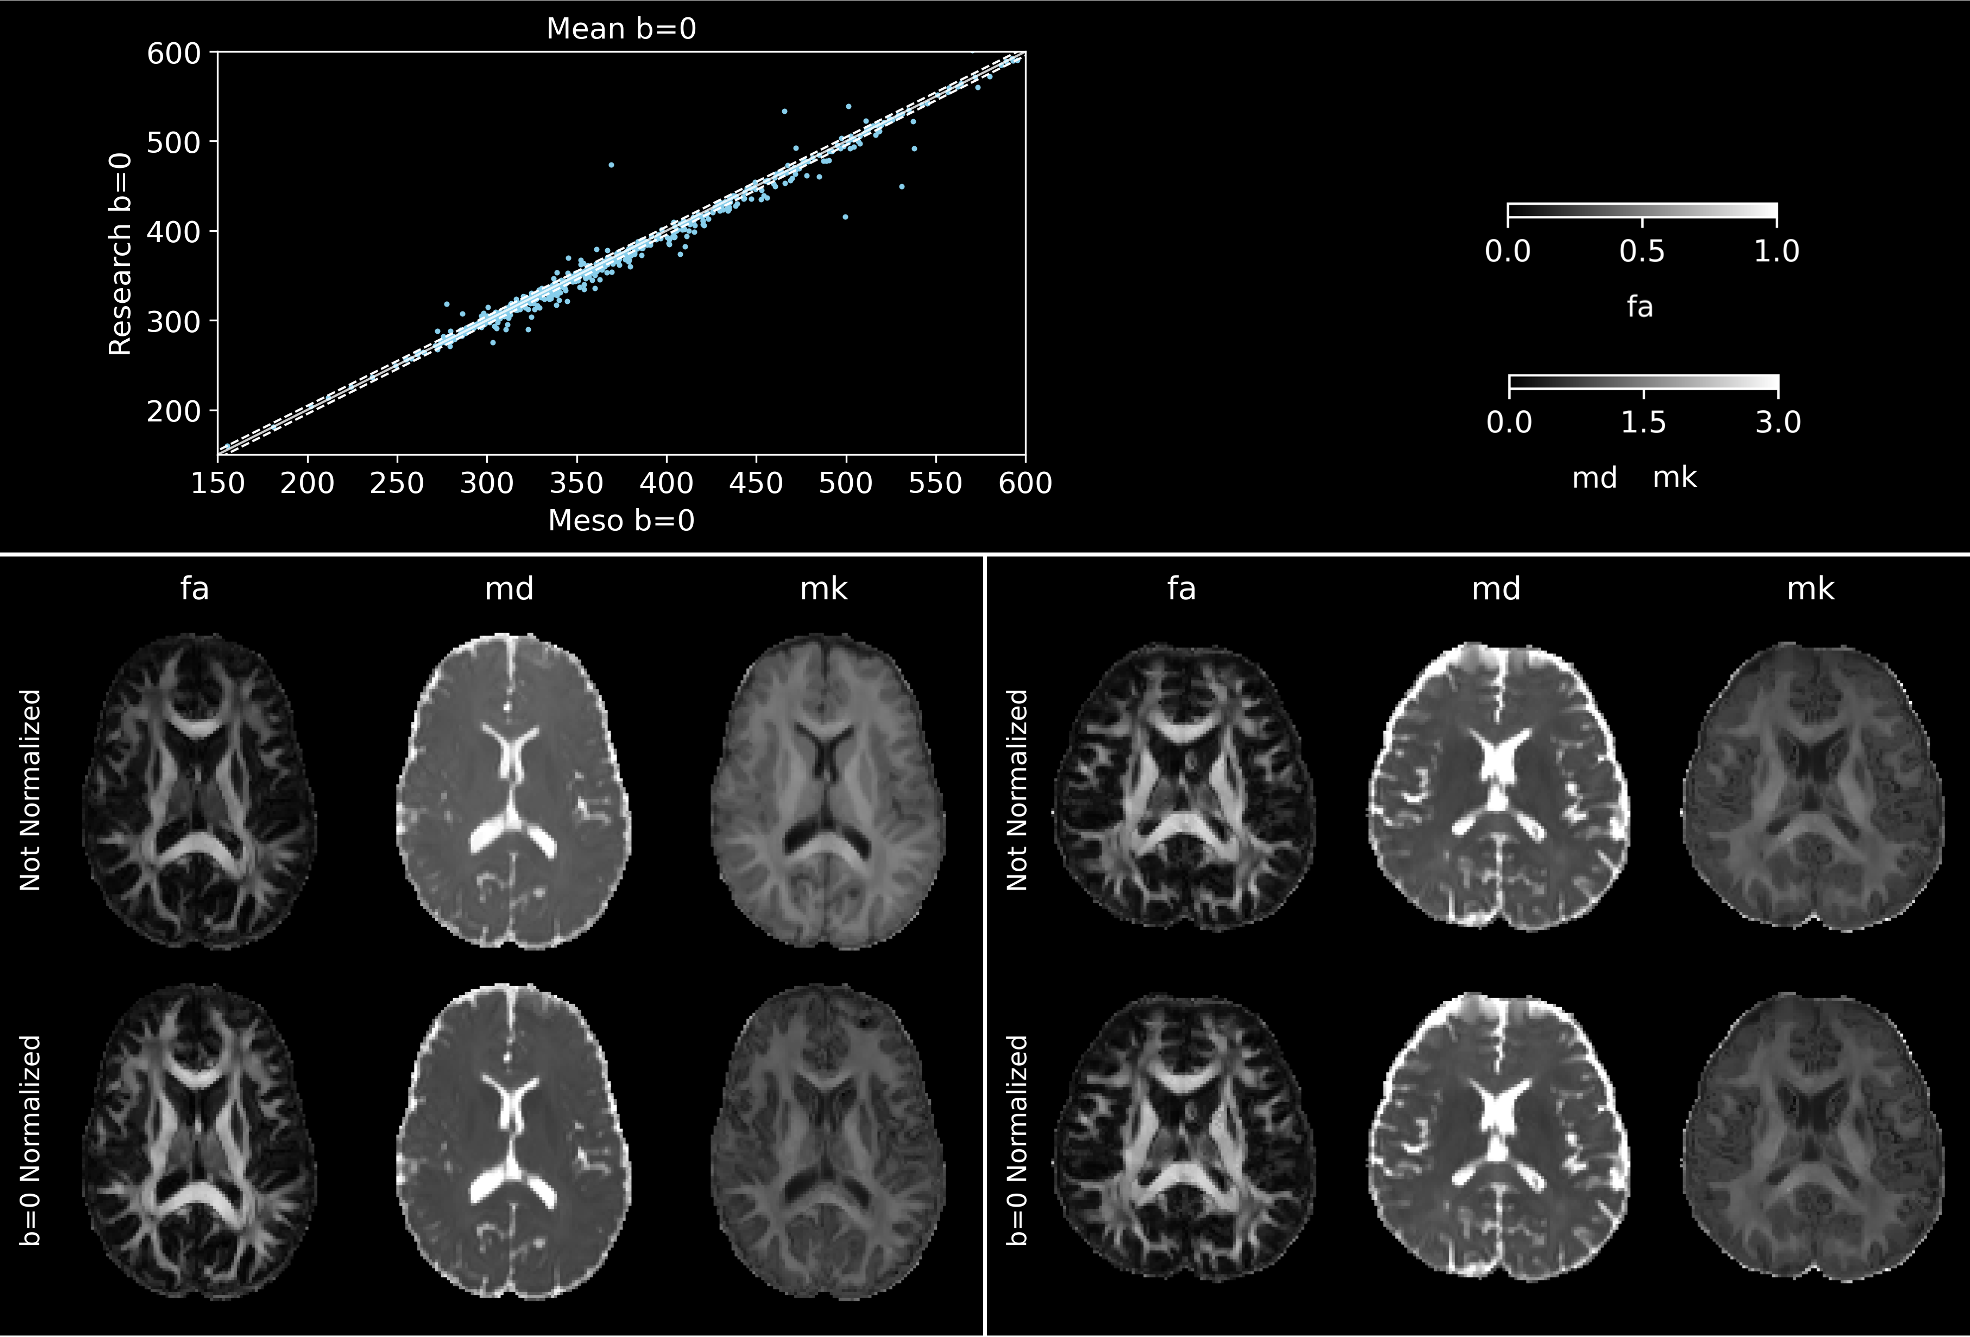
Figure 5. Top: scatter plot of mean b=0 (smoothed) in Meso and Research series of 554 control subjects (mean age: 45.16±13.93-year-old, range: 25 to 75-year-old, 388 females) with solid identity line and dashed line representing 1% interval from identity. Bottom: FA, MD, and MK maps after preprocessing with DESIGNER with and without b=0 normalization of control subjects. Left: 31-year-old male with mean b=0 (smoothed) ratio of 0.845. Right: 33-year-old male with mean b=0 ratio of 1.005.
DOI: https://doi.org/10.58530/2023/3794