3790
Chronic liver disease: The role of multiple diffusion-weighted models using the Bayesian shrinkage method for liver fibrosis assessment1Univ Lyon, INSA Lyon, CNRS, Inserm, CREATIS UMR 5220, U1206, F-69621, Lyon, Villeurbanne, France
Synopsis
Keywords: Data Processing, Diffusion/other diffusion imaging techniques
Liver fibrosis is one of the leading features in chronic liver disease (CLD) since it conditions the prognosis and guides the treatment strategy. In this work, estimated parameters from various diffusion-weighted MRI models fitted by the Bayesian method were analyzed for the relationship with liver fibrosis through spearman’s correlation and t-test. Four parameters (Ds, σ, D*_F, Dapp) were selected for fibrosis classification and achieved the best result based on the decision tree. Our result suggested that the statistical model and a hybrid IVIM-DKI model are promising models and confirmed the confounding effect of fat for diffusivity to assess liver fibrosis.
INTRODUCTION
CLD comprise a large group of hepatic diseases that, in most subtypes, damage the liver in similar ways1. CLD progression is characterized by histological analysis based on the presence of steatosis, inflammation, fibrosis, and iron overload, regardless of the underlying etiologies2-5. While liver biopsy is a prerequisite for histology, there is still an unmet medical need to characterize CLD in a non-invasive way6. Nevertheless, diffusion-weighted magnetic resonance imaging (DW-MRI) models have been proposed from which some estimated parameters were considered as promising biomarkers for CLD diagnostics7-10. However, the scientific community has questioned the relevance of diffusion MRI for the assessment of liver fibrosis, mainly due to the confounding effect of fat and reproducibility issues, among others. Thus, this study aims to investigate the relevance of advanced liver MR diffusions from different models for liver fibrosis assessment.METHODS
Eighty-five patients with CLD (age: 47.9±15.5; sex: M:49 F:36) underwent DW-MRI acquisitions at 3T (MR 750, GE Healthcare) using single-shot EPI DWI sequence with the following parameters: TR/TE =2000/54 ms, matrix size =2562, and b values = 0, 10, 20, 40, 60, 80, 100, 200, 300, 400, 600, 800 s/mm2. Liver biopsy was carried-out for all patients. The patients were classified into two groups according to ISHAK classification: Mild (F0-F2, n=44) versus Severe (F>2, n=41). Fibrosis and steatosis areas were obtained by computerized morphometry. Different models were used to compute diffusion parameters: intravoxel incoherent motion (IVIM), stretched-exponential model (SEM), statistical diffusion model (Stat_D), diffusion kurtosis imaging (DKI), a hybrid IVIM-DKI model (Full), with Bayesian shrinkage prior inference11. All quantified parameters depending on model used are summarized in Table I.Parameter maps were obtained using a Bayesian shrinkage approach11 and regions of interest (ROI) were placed in the whole liver. For post-processing, MR images were transferred to independent vectors (1 × number of b values). The mean values across all parameters were calculated in the ROI. Spearman’s correlation coefficients were checked between diffusion parameters and steatosis (assessed by liver histology). For each group, t-test was used to compare averaged diffusion parameters in ROI for mild vs. severe fibrosis. Finally, the most relevant parameters (p < 0.01) to evaluate fibrosis severity were combined to build a classifier based on a decision tree. All patients were divided into training (75%) and test (25%) subsets by stratified sampling strategies. The receiver operating characteristic (ROC) analysis was performed to evaluate the diagnostic performances of the classifier to predict severe fibrosis.
RESULTS
Figure 1 shows the representative parameters of two patients with mild vs. severe fibrosis. Figure 2 summarizes the significant correlation found between parameters and steatosis or fibrosis area. Statistically significant correlations (p<0.01) were found between the pure molecular diffusion parameters and the level of steatosis assessed by histology. The highest correlation was Ds in the Stat_D model (r=-0.46, p<0.001). For the fibrosis area, weak but still significant correlations were observed with advanced diffusion parameters. Table II shows a heatmap summarizing t-test results. Four parameters (Ds, σ, D*_F, Dapp) were selected for further fibrosis classification using the decision tree approach. On the test set, diagnostic performances of the classifier to predict severe fibrosis were : AUROC = 0.93, sensitivity = 100%, specificity = 77% (see Figure 3).DISCUSSION
Our results showed that pure diffusion parameters significantly correlate to steatosis but not fibrosis. However, some pure diffusion parameters (Ds, Dapp) also provided statistically significant differences between patients with mild vs. severe fibrosis. It confirms that both fat and fibrosis restrict proton diffusion. Poor correlations between advanced parameters with fibrosis were found. These results can be explained by the formation of fibrosis is integratedly influenced by multiple factors, such as types of diseases (viral hepatitis vs. NASH) whose fibrosis topography (centrilobular vs. perisinusoidal) differently affect the liver perfusion... . For classification, it can be observed that σ, F_D* values provide statistically significant differences between patients with mild vs. severe fibrosis. These parameters combined to Ds, Dapp, had the potential to diagnose the degree of fibrosis. As already reported by other works in the literature, the diffusion parameters were found to be influenced by the presence of fat, which can confound and restrict the relevance of molecular diffusion parameters to assess liver fibrosis.Conclusion
We have built a classifier combining different diffusion parameters computed with a Bayesian approach to predict severe liver fibrosis (F>2 based on the ISHAK classification). The result showed excellent accuracy. Our preliminary results demonstrated that combining diffusion parameters obtained from different diffusion models could help to evaluate liver fibrosis in multiple etiologies of chronic liver disease and in presence of fat.Acknowledgements
This work was supported by the China Scholarship Council (CSC), and LabEx PRIMES (ANR-11-LABX-0063) of Université de Lyon, within the program "Investissements d'Avenir" (ANR-11-IDEX-0007) operated by the French National Research Agency (ANR).
References
1. Sharma A, Nagalli S. "Chronic liver disease." StatPearls [Internet]. StatPearls Publishing, 2021.
2. Siphepho P , Liu Y , Shabangu C, et al. The impact of steatosis on chronic hepatitis c progression and response to antiviral treatments. Biomedicines. 2021;9(10), 1491.
3. Costa D, Simbrunner B, Jachs M, et al. Systemic inflammation increases across distinct stages of advanced chronic liver disease and correlates with decompensation and mortality. Journal of Hepatology. 2021;74(4), 819-828.
4. Heyens L, Busschots D, Koek G, et al. Liver fibrosis in non-alcoholic fatty liver disease: from liver biopsy to non-invasive biomarkers in diagnosis and treatment. Frontiers in medicine. 2021;8, 615978.
5. Odagiri N, Matsubara T, Sato-Matsubara M, et al. Anti-fibrotic treatments for chronic liver diseases: The present and the future. Clinical and Molecular Hepatology. 2021;27(3), 413.
6. Berger D, Desai V, Janardhan S. Con: liver biopsy remains the gold standard to evaluate fibrosis in patients with nonalcoholic fatty liver disease. Clinical Liver Disease. 2019;13(4), 114.
7. Kahraman A, Kahraman B, Ozdemir Z, et al. Diffusion-weighted imaging (DWI) of the liver in assessing chronic liver disease: effects of the presence and the degree of ascites on ADC values. Abdom Radiol. 2016;41(1):56-62.
8. Tokgoz O, Unlu E, Unal I, et al. Diagnostic value of diffusion weighted MRI and ADC in differential diagnosis of cavernous hemangioma of the liver. Afr Health Sci. 2016;16(1):227-233.
9. Le Bihan D, Breton E, Lallemand D, et al. MR imaging of intravoxel incoherent motions: application to diffusion and perfusion in neurologic disorders. Radiology. 1986;161(2):401-407.
10. Yoshimaru D, Takatsu Y, Suzuki Y, et al. Diffusion kurtosis imaging in the assessment of liver function: Its potential as an effective predictor of liver function. Br J Radiol. 2019;92(1094):20170608.
11. Jalnefjord O, Andersson M, Montelius M, et al. Comparison of methods for estimation of the intravoxel incoherent motion (IVIM) diffusion coefficient (D) and perfusion fraction (f). Magn Reson Mater Physics, Biol Med. 2018;31(6):715-723.
Figures
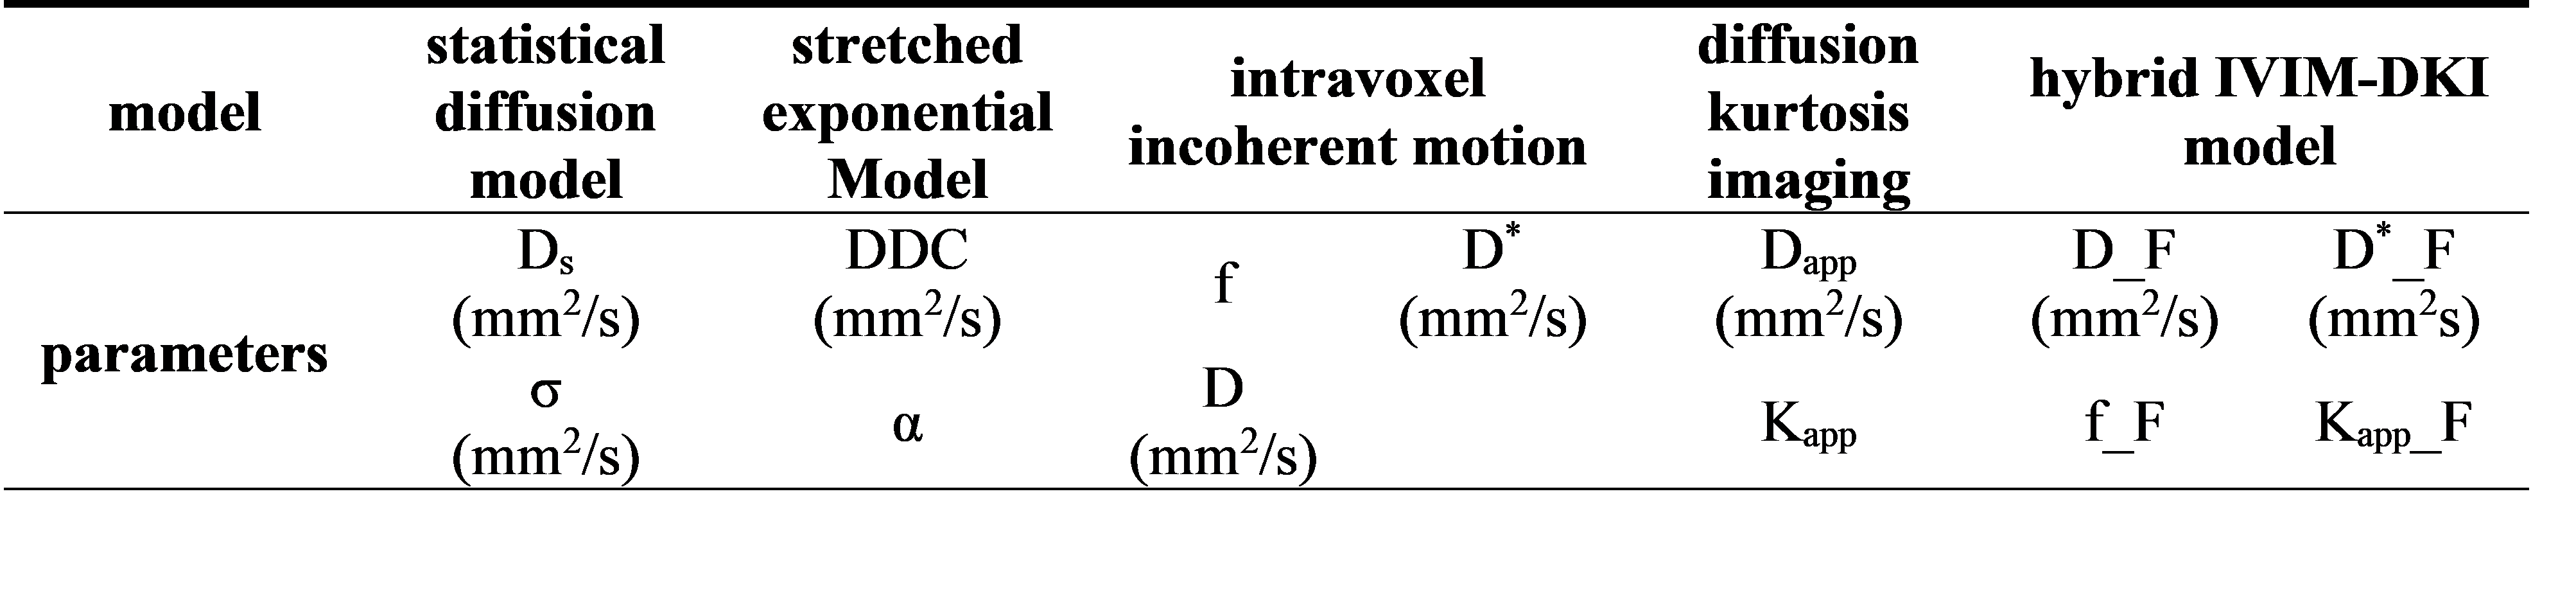
Table I: presentation of the different models used with the parameters that are fitted
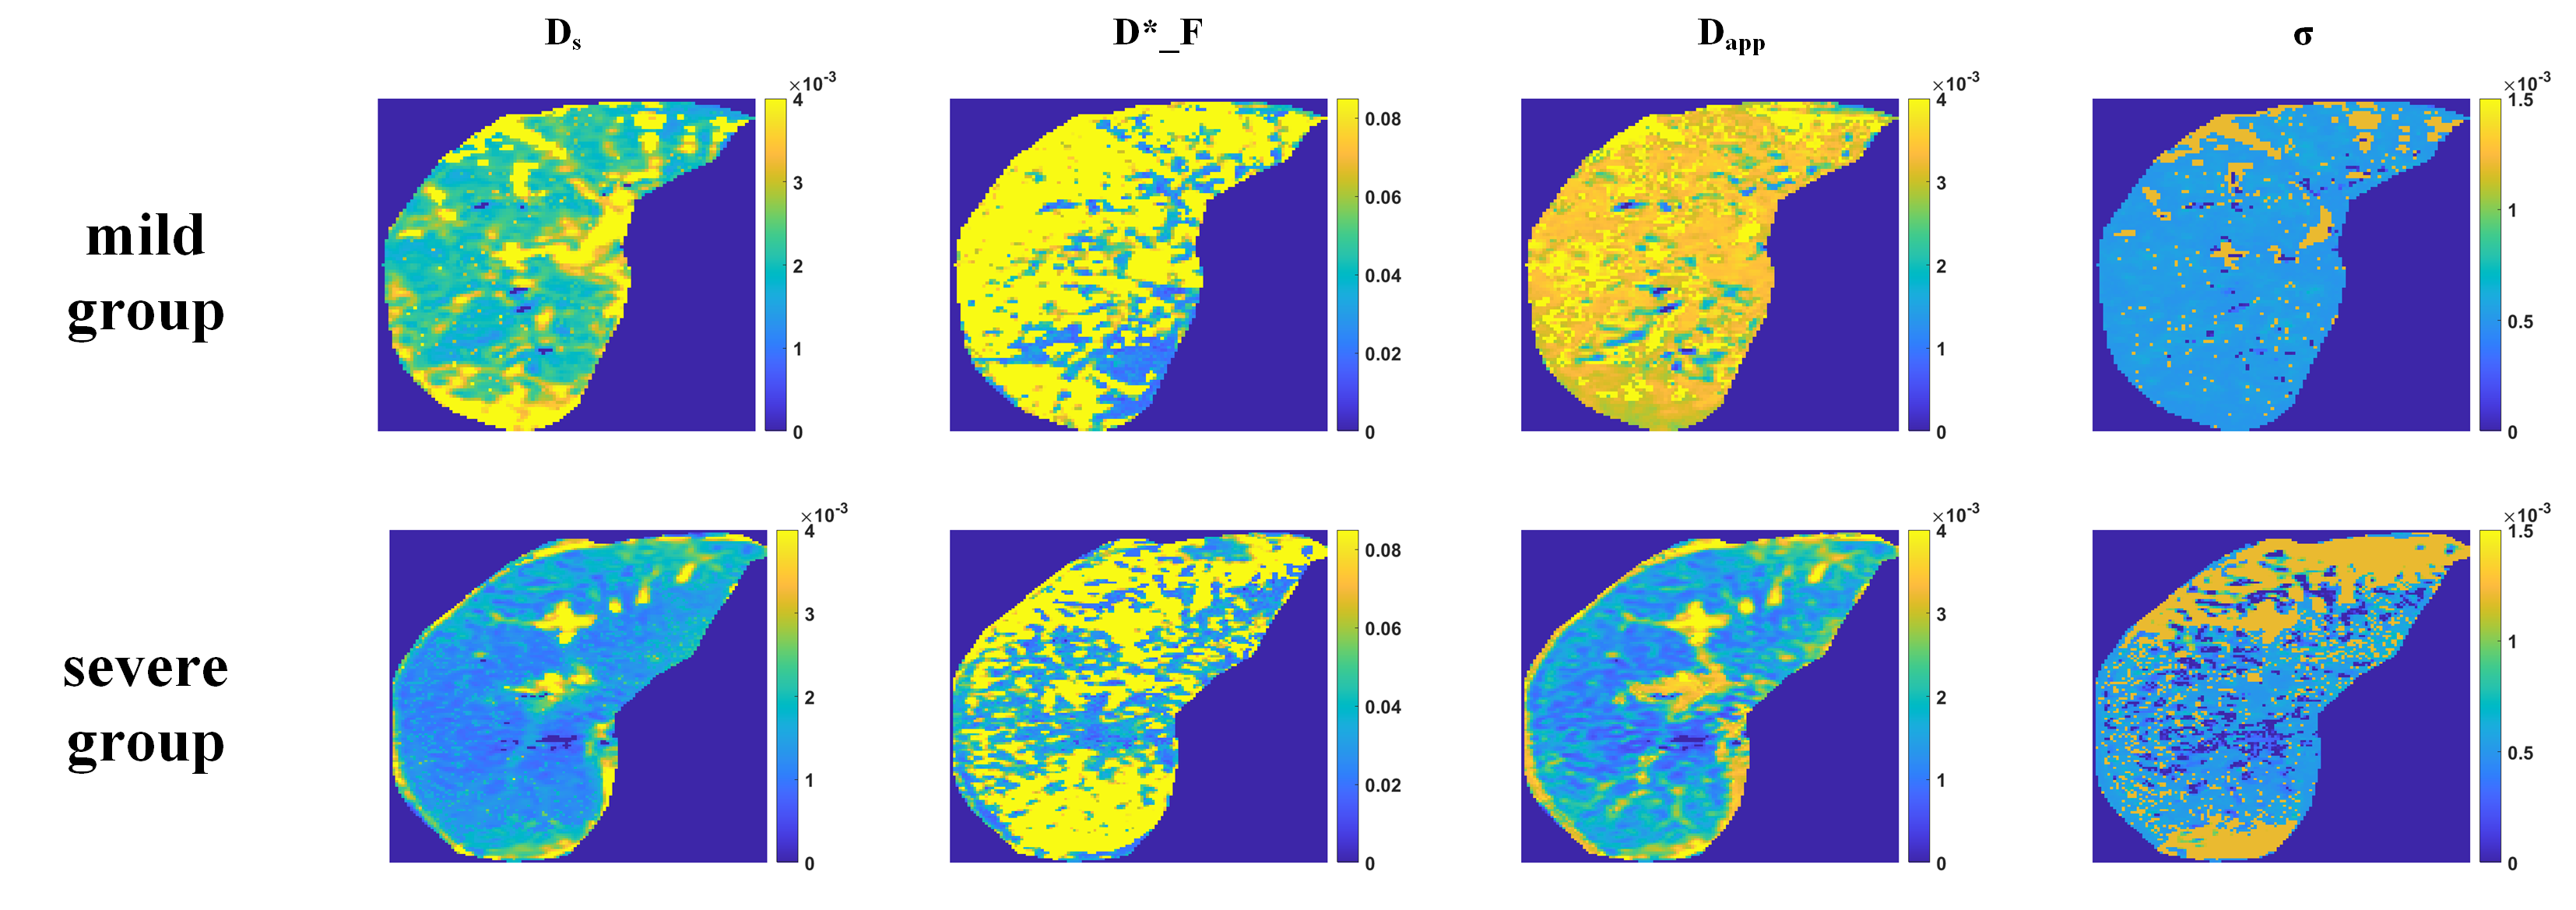
Figure 1: representative diffusion parameters (mm2/s) for two fibrosis group
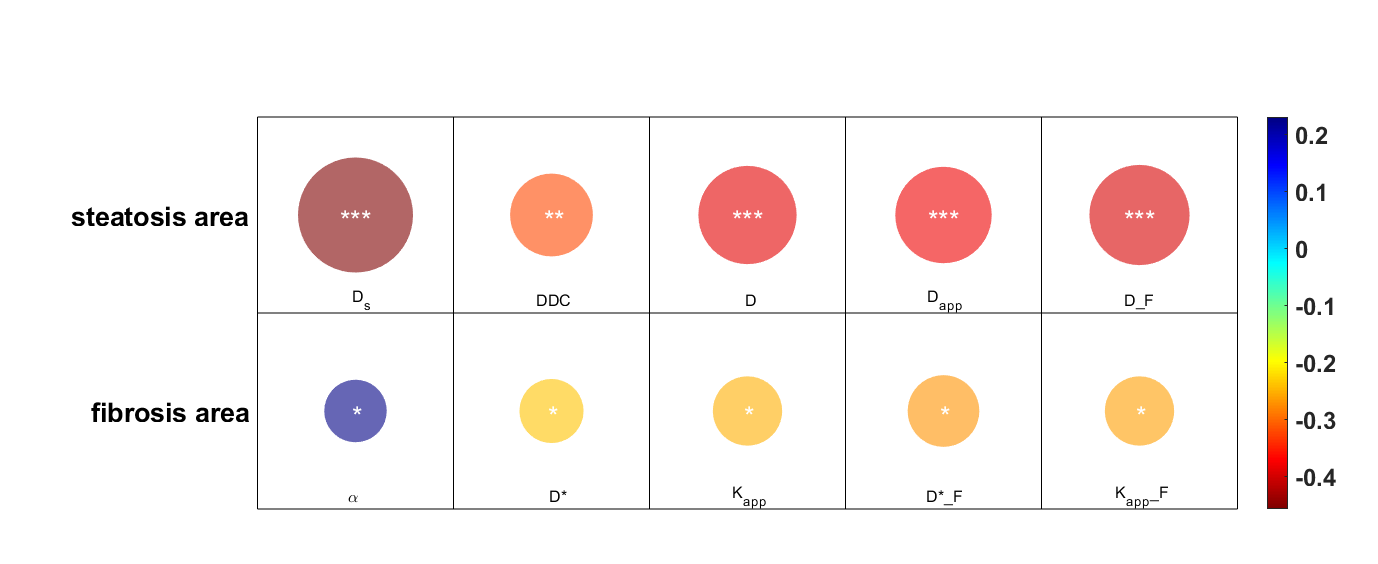
Figure 2: correlation of diffusion parameters with CLD histology biomarkers for steatosis and fibrosis (the color of the circle reflects the relevance, and the area of the circle reflects the significance; *p<0.05; **p<0.01; ***p<0.001)

Table II: comparison of advanced DWI parameters between mild group and severe group with Bayesian estimation
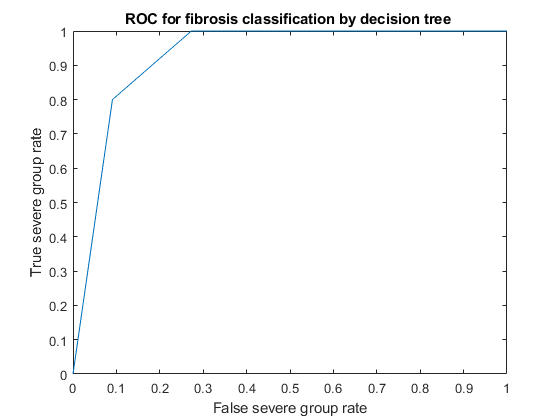
Figure 3: ROC curve illustrating the diagnostic performances of the classifier built with different advanced diffusion parameters to predict severe liver fibrosis