3788
Learning diffusion MRI fiber orientation distribution functions of the developing human brain1Center for Biomedical Imaging & Lausanne University Hospital, Lausanne, Switzerland, 2Harvard Medical School & Boston Children's Hospital, Boston, MA, United States
Synopsis
Keywords: Machine Learning/Artificial Intelligence, Diffusion/other diffusion imaging techniques, Fiber Orientation Distribution functions
Diffusion MRI of fetal and newborn brains is constrained by short scanning time allowing only a small number of diffusion measurements to be acquired. Methods going beyond the diffusion tensor model require multi-shell and multiple gradient directions in order to unveil more accurate white matter properties. We propose a learning based framework to reconstruct fiber orientation distribution functions from only six diffusion measurements by leveraging existing high-quality datasets. Quantitative evaluation on 15 newborn subjects show that our framework achieves competitive results with state-of-the-art methods. Qualitative evaluation on a fetus shows the model ability to translate to this challenging population.Introduction
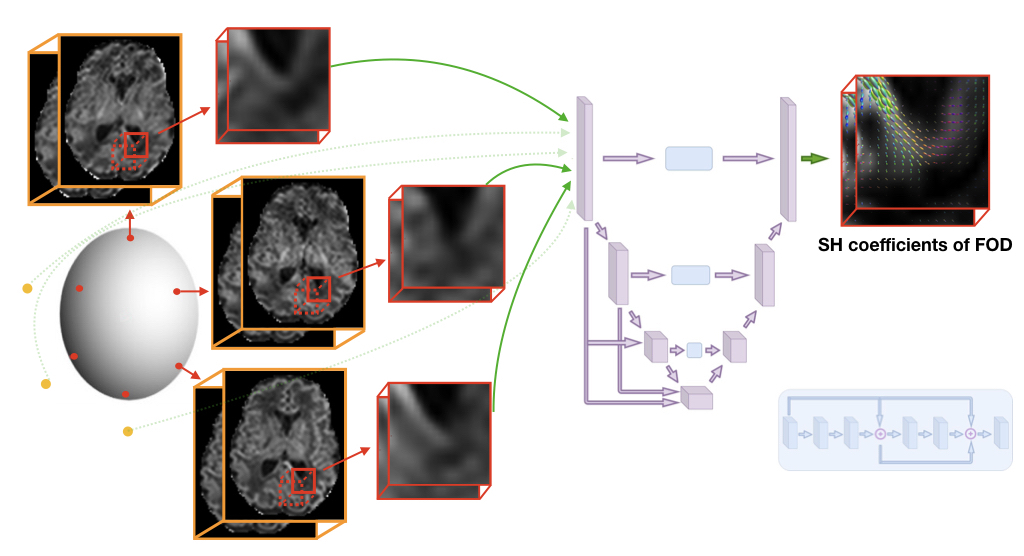
Diffusion Magnetic Resonance Imaging (dMRI) has been a key tool for in vivo non-invasive white matter investigation with a high potential for studying the developing brain1. Neonates and fetal cohorts can particularly benefit from this technique if challenges linked to short acquisition time and unpredictable movements are addressed. Fiber orientation distribution functions (FODs) are state-of-the-art models to unveil complex fiber configurations in the brain2,3. Their application to the developing brain has been limited due the above mentioned constraints4. Neonate and fetal studies that processed the diffusion signal with complex models such as Constrained Spherical Deconvolution (CSD) or multi-shell multi-tissue CSD (MSMT-CSD) have used High Angular Resolution Diffusion Imaging (HARDI) data acquired with a large number of multi-shell measurements5,6,7 that are only possible in controlled research settings. In a clinical context, only a few measurements can be acquired. Deep learning has been recently suggested for FOD prediction using the diffusion signal8,9,10. However no method exploiting spatial neighboring information has been applied to the developing brain using few samples. In this work, we employed six diffusion measurements to predict FODs which would require 300 measurements when constructed with MSMT-CSD.Methodology
Datasets.1.Newborns: Our neonatal data is composed of two subsets: (A) 100 subjects ([32.1, 44.7] weeks) and (B) 62 pre-term subjects ([29.3, 36.86] gestational weeks) from the developing Human Connectome Project (dHCP)11. Data was acquired with a Philips Achieva scanner (32-channel neonatal head-coil) with a monopolar spin-echo echo-planar imaging Stejskal-Tanner sequence (Delta= 42.5 ms, delta=14 ms, TR=3800 ms, TE=90 ms). The final resolution was 1.17x1.17x1.5 mm3, which we upsampled to 1mm isotropic. A multi-shell (b in {0,400,1000,2600} s/mm2) sequence with 300 volumes was used. A white matter mask was constructed using the union between Fractional Anisotropy mask (≥0.25), ‘White Matter’ and ‘Brainstem’ region labels that were available in the anatomical dataset.
2.Fetal: One motion-free subject subject of 33.3 gestational weeks was acquired using a 3T Siemens Skyra MRI scanner (16-channel body matrix and spine coils, TR=3000–4000 ms, TE=60 ms) with one b=0s/mm2 and 12 diffusion-sensitized images at b=700s/mm2. The resolution was upsampled from 2x2x2-4 mm3 to 1mm isotropic.
Model & Training.
The network was trained using data of subset (A) on mapping six 3D patches (163 voxels) of b=1000s/mm to the MSMT-CSD generated FOD represented in the spherical harmonics (SH) basis (order 8) using the 300 measurements (Figure 1). The six measurements were selected by minimizing the condition number12. Peaks were estimated using MRtrix13 (maximum peak number:3, relative peak threshold:0.5, mean separation angle:45°). A mask was generated using the number of peaks and was used to balance the patch selection with a ratio of 3:1 between single and multiple peaks. The training, validation and testing proportion was respectively 70%, 15% and 15%. A second network was trained on the pre-term dataset only (B) and was tested on the fetal subject. It used 12 diffusion measurements that were projected to SH (order 4) and were similarly mapped to the MSMT-CSD FODs.
Evaluation.
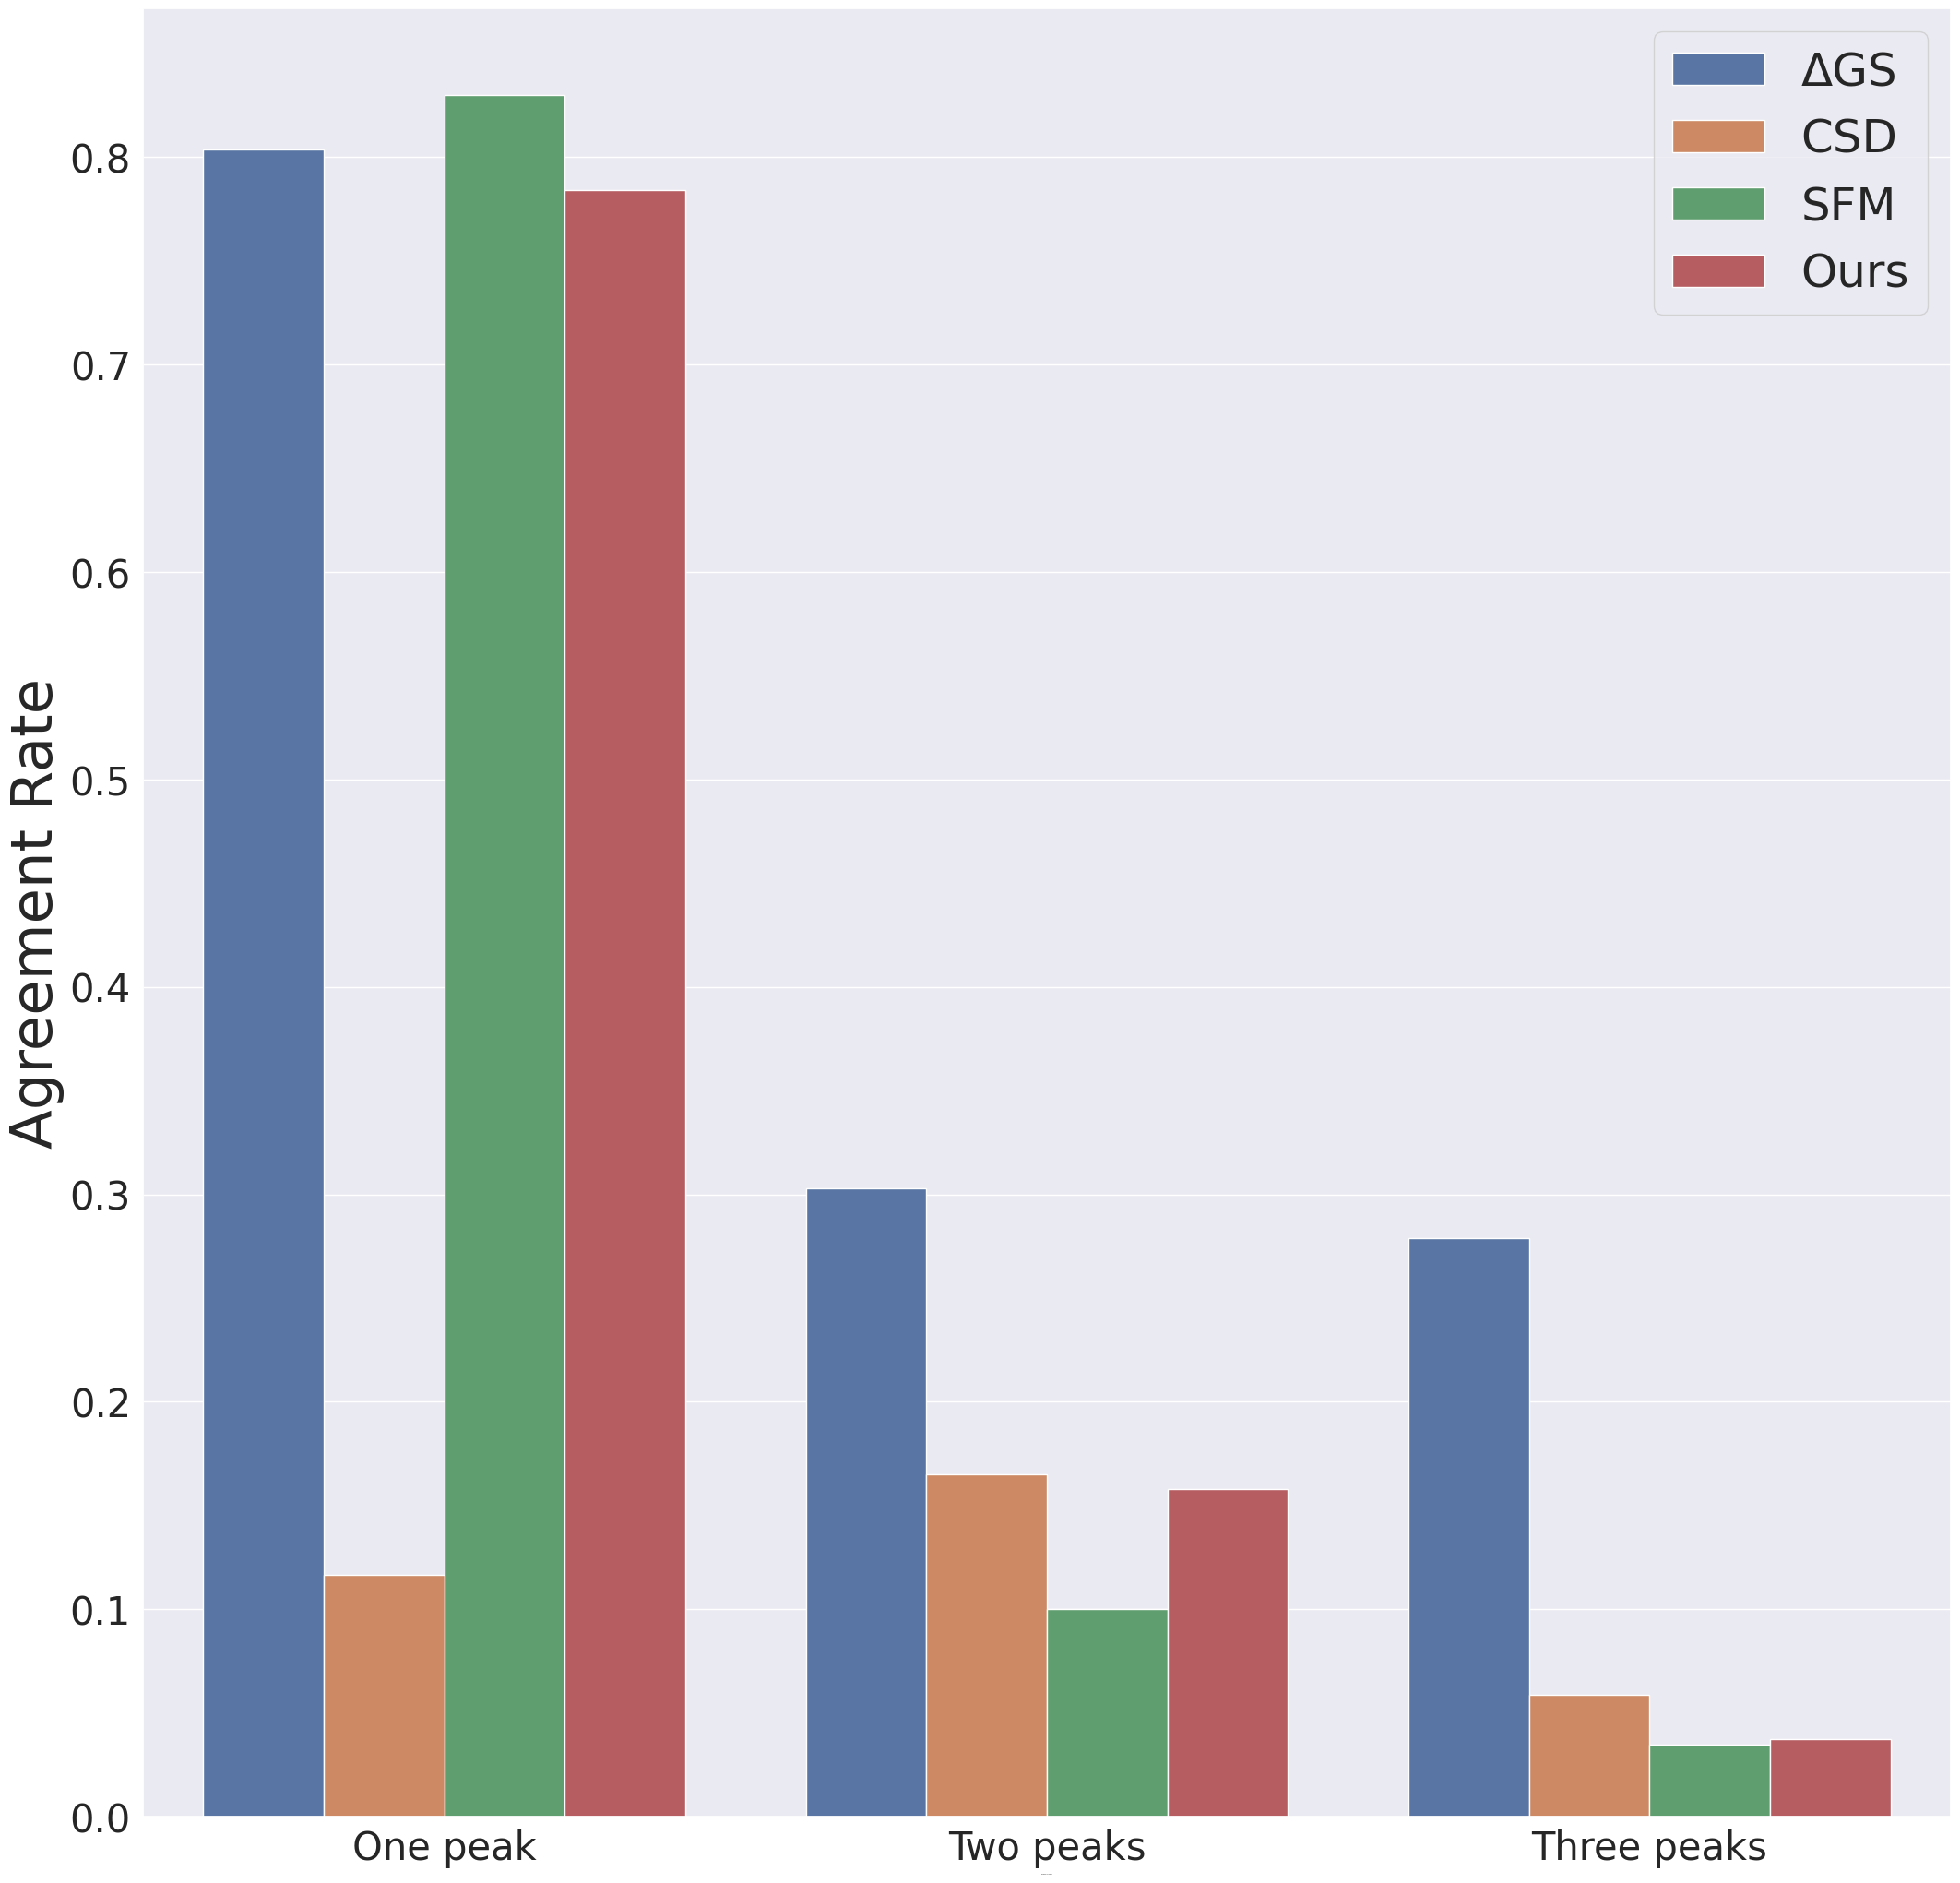
We have split the 300 measurements into two disjoint subsets of 150 directions with each 10, 32, 44 and 62 samples of b-value {0,400,1000,2600} s/mm2, respectively. These two HARDI datasets were processed with MSMT-CSD to generate the FODs. Sparse Fascicle Model (SFM)13 and CSD were also computed using respectively the full 300 measurements and the measurements of b=2600s/mm . The difference between the two HARDI FODs can be considered as an upper bound. The other methods, i.e. SFM, CSD and ours were compared to the MSMT-CSD model. As no ground truth is available for fetal MRI, the pre-term network was qualitatively evaluated only.
Results
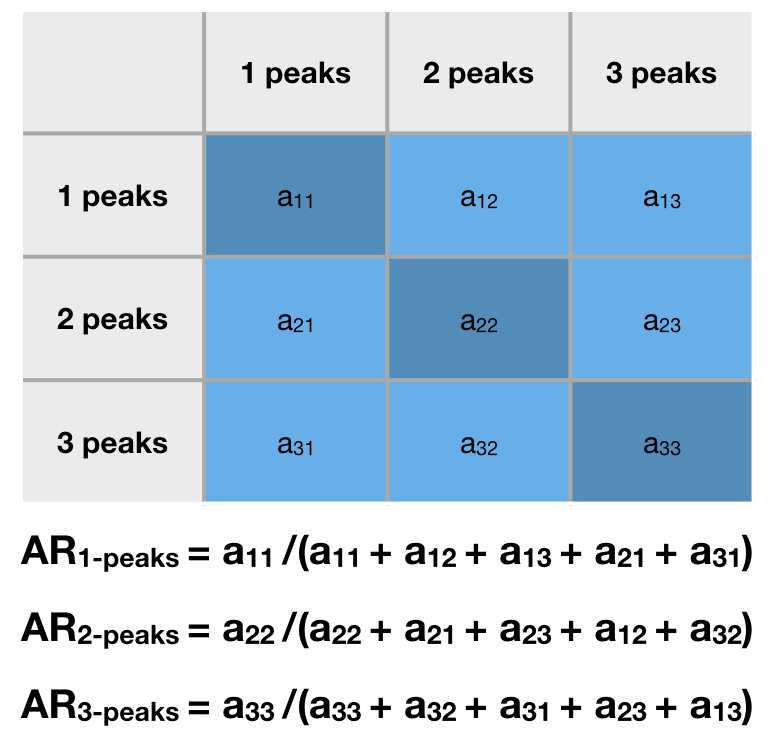
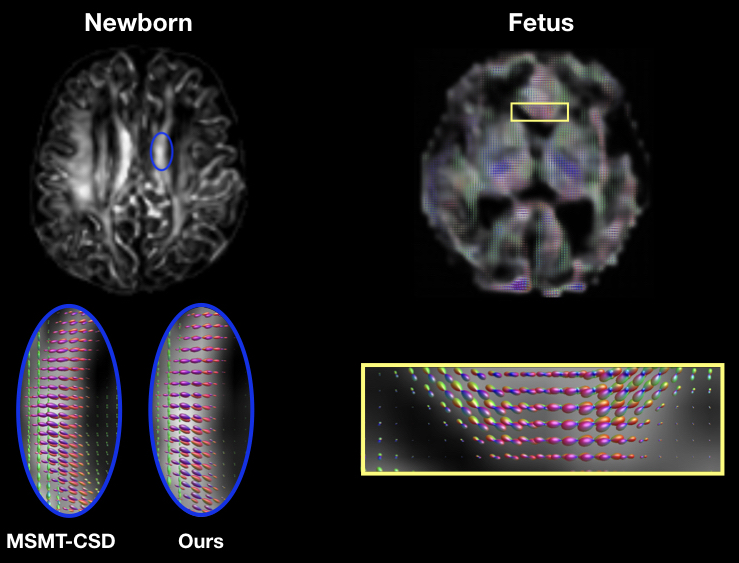
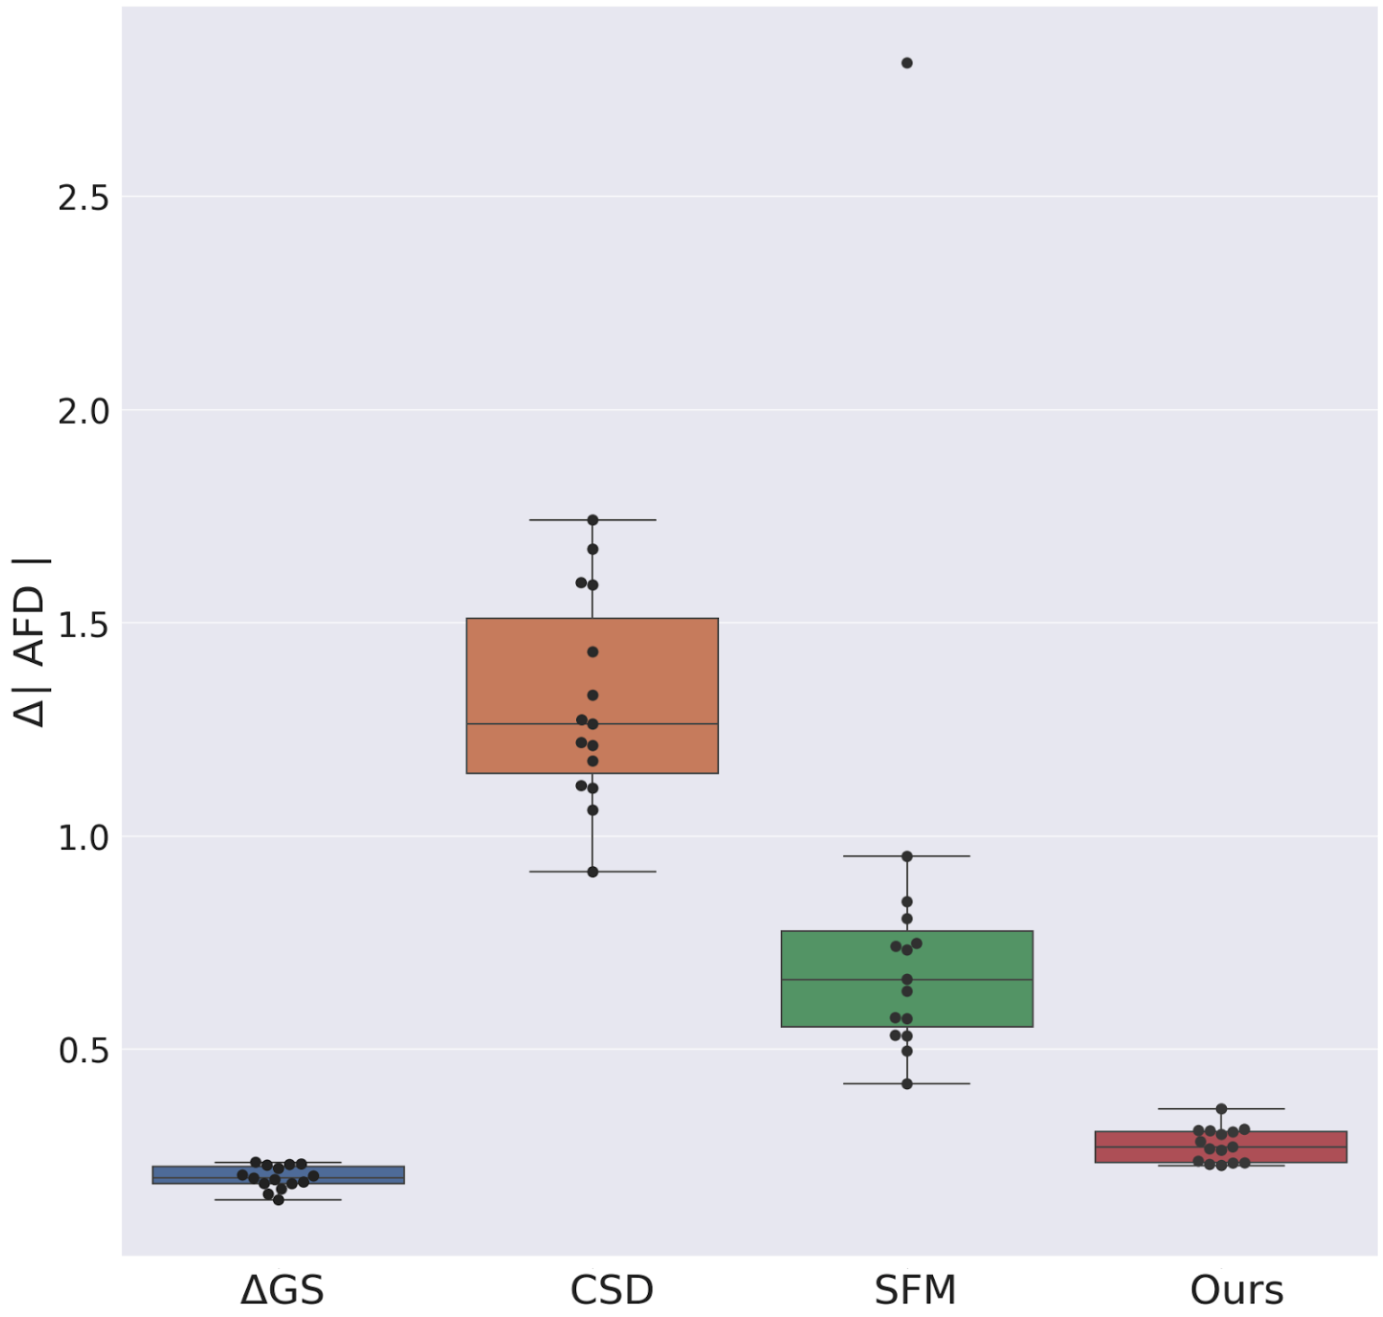
Figure 3 (left) shows the consistency of a predicted FOD by our network compared to MSMT-CSD. The number of peak errors is displayed in Figure 4. The proposed method achieves comparable results to the difference between the two HARDI models, especially for 1-peaks. The low agreement in the latter for multiple peaks (30% and 28% for 2- and 3-peaks) is probably the reason why our model only achieved 16% and 4% respectively. This is still outperforming CSD and SFM. Figure 5 shows the AFD error where our method achieves close results to the difference between the two HARDI models, compared to CSD or SFM. The number of samples used by these methods is more than an order of magnitude higher than our model that uses six gradient directions. As a proof of concept, Figure 3 (right) shows the anatomically valid FODs in a fetus. However, more translational work is required to consistently generalize to more brain regions and more subjects.Conclusion
This study demonstrated the feasibility of predicting FODs from highly undersampled measurements with a deep learning approach. This new method achieved state-of-the-art results on neonatal brains and promising preliminary results on fetal brain data. Moreover, this learning paradigm can overcome the error accumulation of classical pre-processing steps by back-propagating the error end-to-end15. We have additionally demonstrated the low agreement between two HARDI acquisitions, and hence the need for developing adequate methods to unveil the complex structure of the white matter in developing brains.Acknowledgements
This work was supported by a Mobility grant from the Swiss National Science Foundation (project 205321-182602). We acknowledge the CIBM Center for Biomedical Imaging, a Swiss research center of excellence founded and supported by CHUV, UNIL, EPFL, UNIGE, HUG and the Leenaards and Jeantet Foundations. This research was also partly supported by the US National Institutes of Health (NIH) under awards R01NS106030 and R01EB032366; by the Office of the Director of the NIH under award S10OD0250111; and by NVIDIA Corporation; and utilized an NVIDIA RTX A6000 GPU. Newborn data were provided by the developing Human Connectome Project, KCL-Imperial-Oxford Consortium funded by the European Research Council under the European Union Seventh Framework Programme (FP/2007-2013) / ERC Grant Agreement no. [319456]. We are grateful to the families who generously supported this trial.References
1. Rodrigues, K. and Grant, P.E., 2011. Diffusion-weighted imaging in neonates. Neuroimaging Clinics, 21(1), pp.127-151.
2. Tournier, J.D., Calamante, F. and Connelly, A., 2007. Robust determination of the fibre orientation distribution in diffusion MRI: non-negativity constrained super-resolved spherical deconvolution. Neuroimage, 35(4), pp.1459-1472.
3. Jeurissen, B., Tournier, J.D., Dhollander, T., Connelly, A. and Sijbers, J., 2014. Multi-tissue constrained spherical deconvolution for improved analysis of multi-shell diffusion MRI data. NeuroImage, 103, pp.411-426.
4. Dubois, J., Alison, M., Counsell, S.J., Hertz‐Pannier, L., Hüppi, P.S. and Benders, M.J., 2021. MRI of the neonatal brain: a review of methodological challenges and neuroscientific advances. Journal of Magnetic Resonance Imaging, 53(5), pp.1318-1343.
5. Pietsch, M., Christiaens, D., Hutter, J., Cordero-Grande, L., Price, A.N., Hughes, E., Edwards, A.D., Hajnal, J.V., Counsell, S.J. and Tournier, J.D., 2019. A framework for multi-component analysis of diffusion MRI data over the neonatal period. Neuroimage, 186, pp.321-337.
6. Dubois, J., Adibpour, P., Poupon, C., Hertz-Pannier, L. and Dehaene-Lambertz, G., 2016. MRI and M/EEG studies of the white matter development in human fetuses and infants: review and opinion. Brain Plasticity, 2(1), pp.49-69.
7. Wilson, S., Pietsch, M., Cordero-Grande, L., Price, A.N., Hutter, J., Xiao, J., McCabe, L., Rutherford, M.A., Hughes, E.J., Counsell, S.J. and Tournier, J.D., 2021. Development of human white matter pathways in utero over the second and third trimester. Proceedings of the National Academy of Sciences, 118(20), p.e2023598118.
8. Karimi, D., Vasung, L., Jaimes, C., Machado-Rivas, F., Warfield, S.K. and Gholipour, A., 2021. Learning to estimate the fiber orientation distribution function from diffusion-weighted MRI. NeuroImage, 239, p.118316.
9. Koppers, S. and Merhof, D., 2016, October. Direct estimation of fiber orientations using deep learning in diffusion imaging. In International Workshop on Machine Learning in Medical Imaging (pp. 53-60). Springer, Cham.
10. Lin, Z., Gong, T., Wang, K., Li, Z., He, H., Tong, Q., Yu, F. and Zhong, J., 2019. Fast learning of fiber orientation distribution function for MR tractography using convolutional neural network. Medical physics, 46(7), pp.3101-3116.
11. Hutter, J., Tournier, J.D., Price, A.N., Cordero‐Grande, L., Hughes, E.J., Malik, S., Steinweg, J., Bastiani, M., Sotiropoulos, S.N., Jbabdi, S. and Andersson, J., 2018. Time‐efficient and flexible design of optimized multishell HARDI diffusion. Magnetic resonance in medicine, 79(3), pp.1276-1292.
12. Skare, S., Hedehus, M., Moseley, M.E. and Li, T.Q., 2000. Condition number as a measure of noise performance of diffusion tensor data acquisition schemes with MRI. Journal of magnetic resonance, 147(2), pp.340-352.
13. Tournier, J.D., Calamante, F. and Connelly, A., 2012. MRtrix: diffusion tractography in crossing fiber regions. International journal of imaging systems and technology, 22(1), pp.53-66.
14. Rokem, A., Yeatman, J.D., Pestilli, F., Kay, K.N., Mezer, A., Van Der Walt, S. and Wandell, B.A., 2015. Evaluating the accuracy of diffusion MRI models in white matter. PloS one, 10(4), p.e0123272.
15. Raffelt, D., Tournier, J.D., Rose, S., Ridgway, G.R., Henderson, R., Crozier, S., Salvado, O. and Connelly, A., 2012. Apparent fibre density: a novel measure for the analysis of diffusion-weighted magnetic resonance images. Neuroimage, 59(4), pp.3976-3994.
16. Golkov, V., Dosovitskiy, A., Sperl, J.I., Menzel, M.I., Czisch, M., Sämann, P., Brox, T. and Cremers, D., 2016. Q-space deep learning: twelve-fold shorter and model-free diffusion MRI scans. IEEE transactions on medical imaging, 35(5), pp.1344-1351.
17. Ronneberger, O., Fischer, P. and Brox, T., 2015, October. U-net: Convolutional networks for biomedical image segmentation. In International Conference on Medical image computing and computer-assisted intervention (pp. 234-241). Springer, Cham.
Figures