3781
Using ‘P-scores’: a novel percentile-based normalization method to accurately assess individual deviation in heavily skewed neuroimaging data1National Institute of Biomedical Imaging and Bioengineering (NIBIB), National Institutes of Health (NIH), Bethesda, MD, United States, 2Henry Jackson Foundation for Advancement of Military Medicine, Bethesda, MD, United States, 3Rehabilitation Medicine Department, National Institutes of Health (NIH), Bethesda, MD, United States
Synopsis
Keywords: Data Analysis, Diffusion/other diffusion imaging techniques, Quantitative Medical Imaging
We propose a novel quantity to correctly assess the extent individuals deviate from the median of a heavy-tailed distribution. We compute a percentile-based score, we call ‘P-score’, which normalizes the deviation of an individual from the sample median by incorporating the individual’s position in the left/right tail of the sample distribution and the corresponding length between the sample median and the 5th/95th percentile edge values of the sample distribution, respectively. We demonstrate the skewness present in diffusion MRI data and the bias introduced when Z-scores are used and further show the control of this bias using the proposed ‘P-scores’ approach.Introduction
Quantitative MRI metrics hold the promise of improving individual assessment by comparing measurements with a normative distribution. Typically, Z-scores are used, especially, when comparing quantities at different scales, such as, those often derived from clinical tests and neuroimaging data. However, the interpretation can be biased1 for data that do not follow a Gaussian distribution, and some MRI metrics may be heavily skewed. A method is required to accurately assess individual deviations from the central tendencies of a heavily skewed distribution. We address this issue by computing a novel quantity, we call ‘P-score’, which accurately estimates an individual's deviation from a normative distribution.Methods
We acquired diffusion imaging data from 48 control subjects using a 3T Siemens Prisma scanner with a 32-channel head coil. The data was preprocessed using the TORTOISE pipeline2-3. Various diffusion metrics were computed and average values within ROIs4 were extracted. Here, we highlight fractional anisotropy (FA), propagator anisotropy (PA) and mean diffusivity (MD), which were age-corrected using quantile regression5-6 of the median age. To compute ‘P-scores’, first, we obtain subject-wise percentiles for each ROI and use the 5th and 95th boundary values from the sample distribution in the second step; where, we normalize the difference between a subject’s diffusion metric and the sample median, by the corresponding difference between the sample median and the 5th/95th percentile edge values, depending on the subject’s location in the left/right tail, respectively. Equation (1) was used to compute percentiles –$$p_{rank_{ij}} = \frac{n_{C\leq{x_{ij}}}}{n_{C}} \times100;\space\space i = 1,2,3 ...n_{C}, \space j = 1,2,3 ...M\space\space\space(1)$$
where $$$x_{ij}$$$ represents diffusion metric of the $$$i^{th}$$$ individual from the control sample $$$n_{C}$$$ for the $$$j^{th}$$$ ROI, with $$$i$$$ and $$$j$$$ representing $$$1...n_{C}$$$ individuals and $$$1...M$$$ ROIs, respectively. $$$n_{C\leq{x_{ij}}}$$$ represents the number of subjects in $$$n_{C}$$$ with values equal or less than $$$x_{ij}$$$. The ‘P-scores’ are computed using equations (2) and (3) –
$$P_{5_{ij}} = -1.645\frac{d_{x_{ij}}}{d_{5}};\space\space \begin{cases} -d_{x_{ij}} = x_{ij} - m_{C_{j}} & x_{ij} < m_{C_{ij}} \\d_{5} = m_{C_{j}} - x_{C_{j_{5}}} & x_{ij} < m_{C_{ij}}\end{cases}\space\space\space(2)$$
$$P_{95_{ij}} = +1.645\frac{d_{x_{ij}}}{d_{95}};\space\space \begin{cases} +d_{x_{ij}} = x_{ij} - m_{C_{j}} & x_{ij} > m_{C_{ij}} \\d_{95} = x_{C_{j_{95}}} - m_{C_{j}} & x_{ij} > m_{C_{ij}}\end{cases}\space\space\space(3)$$
where $$$x_{ij}$$$, $$$i$$$ and $$$j$$$ are the same as in (1). $$$d_{x_{ij}}$$$ is the difference between $$$x_{ij}$$$ and the median, $$$m_{C_{j}}$$$ of the sample group for the jth ROI. $$$-d_{x_{ij}}$$$ means the current subject is located below $$$m_{C_{j}}$$$ on the left-hand tail, between $$$m_{C_{j}}$$$ and the 5th boundary value, $$$x_{C_{j_{5}}}$$$ in the sample distribution, giving $$$d_{5}$$$ as the difference between $$$m_{C_{j}}$$$ and $$$x_{C_{j_{5}}}$$$. Contrarily, $$$+d_{x_{ij}}$$$ indicates the current subject is located above $$$m_{C_{j}}$$$ on the right-hand tail, between $$$m_{C_{j}}$$$ and the 95th boundary value, $$$x_{C_{j_{95}}}$$$, giving $$$d_{95}$$$ as the difference between $$$x_{C_{j_{95}}}$$$ and $$$m_{C_{j}}$$$. $$$P_{5_{ij}}$$$ and $$$P_{95_{ij}}$$$ takes the polarity of $$$d_{x_{ij}}$$$, producing negative and positive ‘P-scores’, respectively. Please note, owing to $$$n_{C} = 48$$$, the smallest resolution of percentiles is ~2.08%. Therefore, suitable boundaries of ~5th and ~95th percentiles were chosen, which gives $$$P_{score} = 1$$$, for subjects at the 5th/95th boundaries. Thus, if ‘P-scores’ are multiplied with a scalar “1.645” (Z-score magnitude of 5th/95th percentiles from a normal distribution), they attain the same scale of Z-scores. This helps comparing the two scores and assessing which one attains a closer fit to the normal distribution.
Results and Discussion
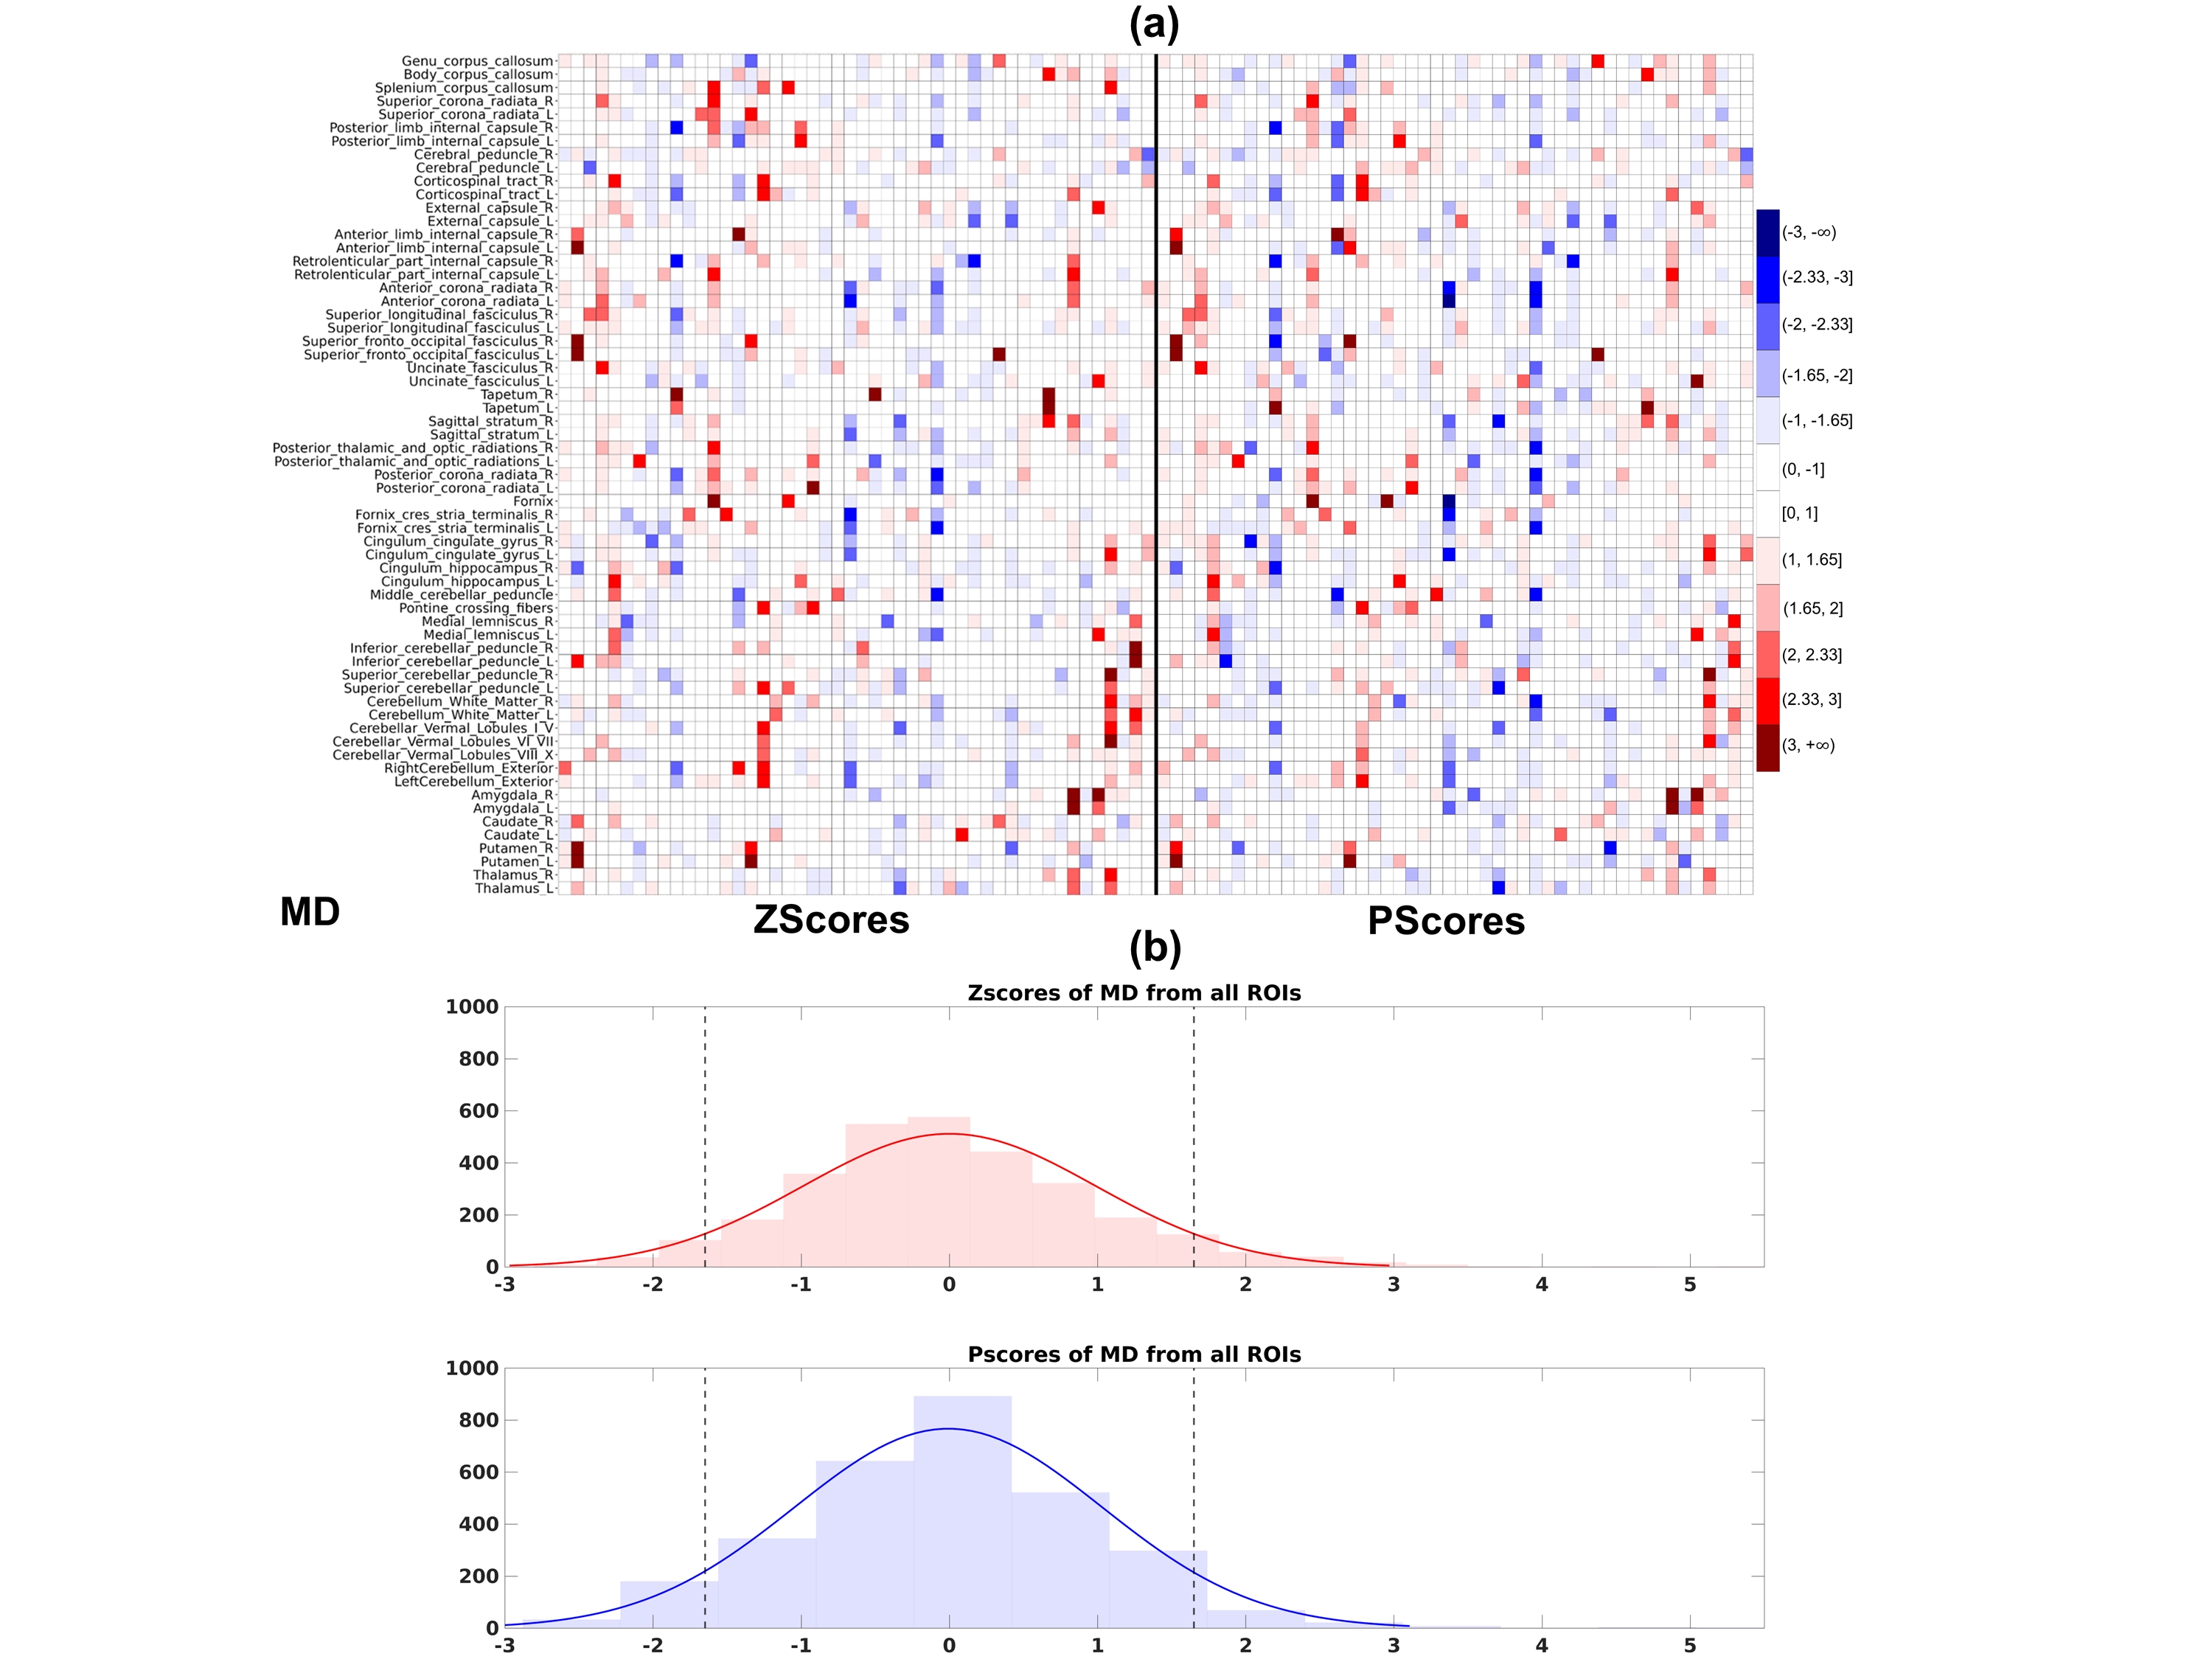
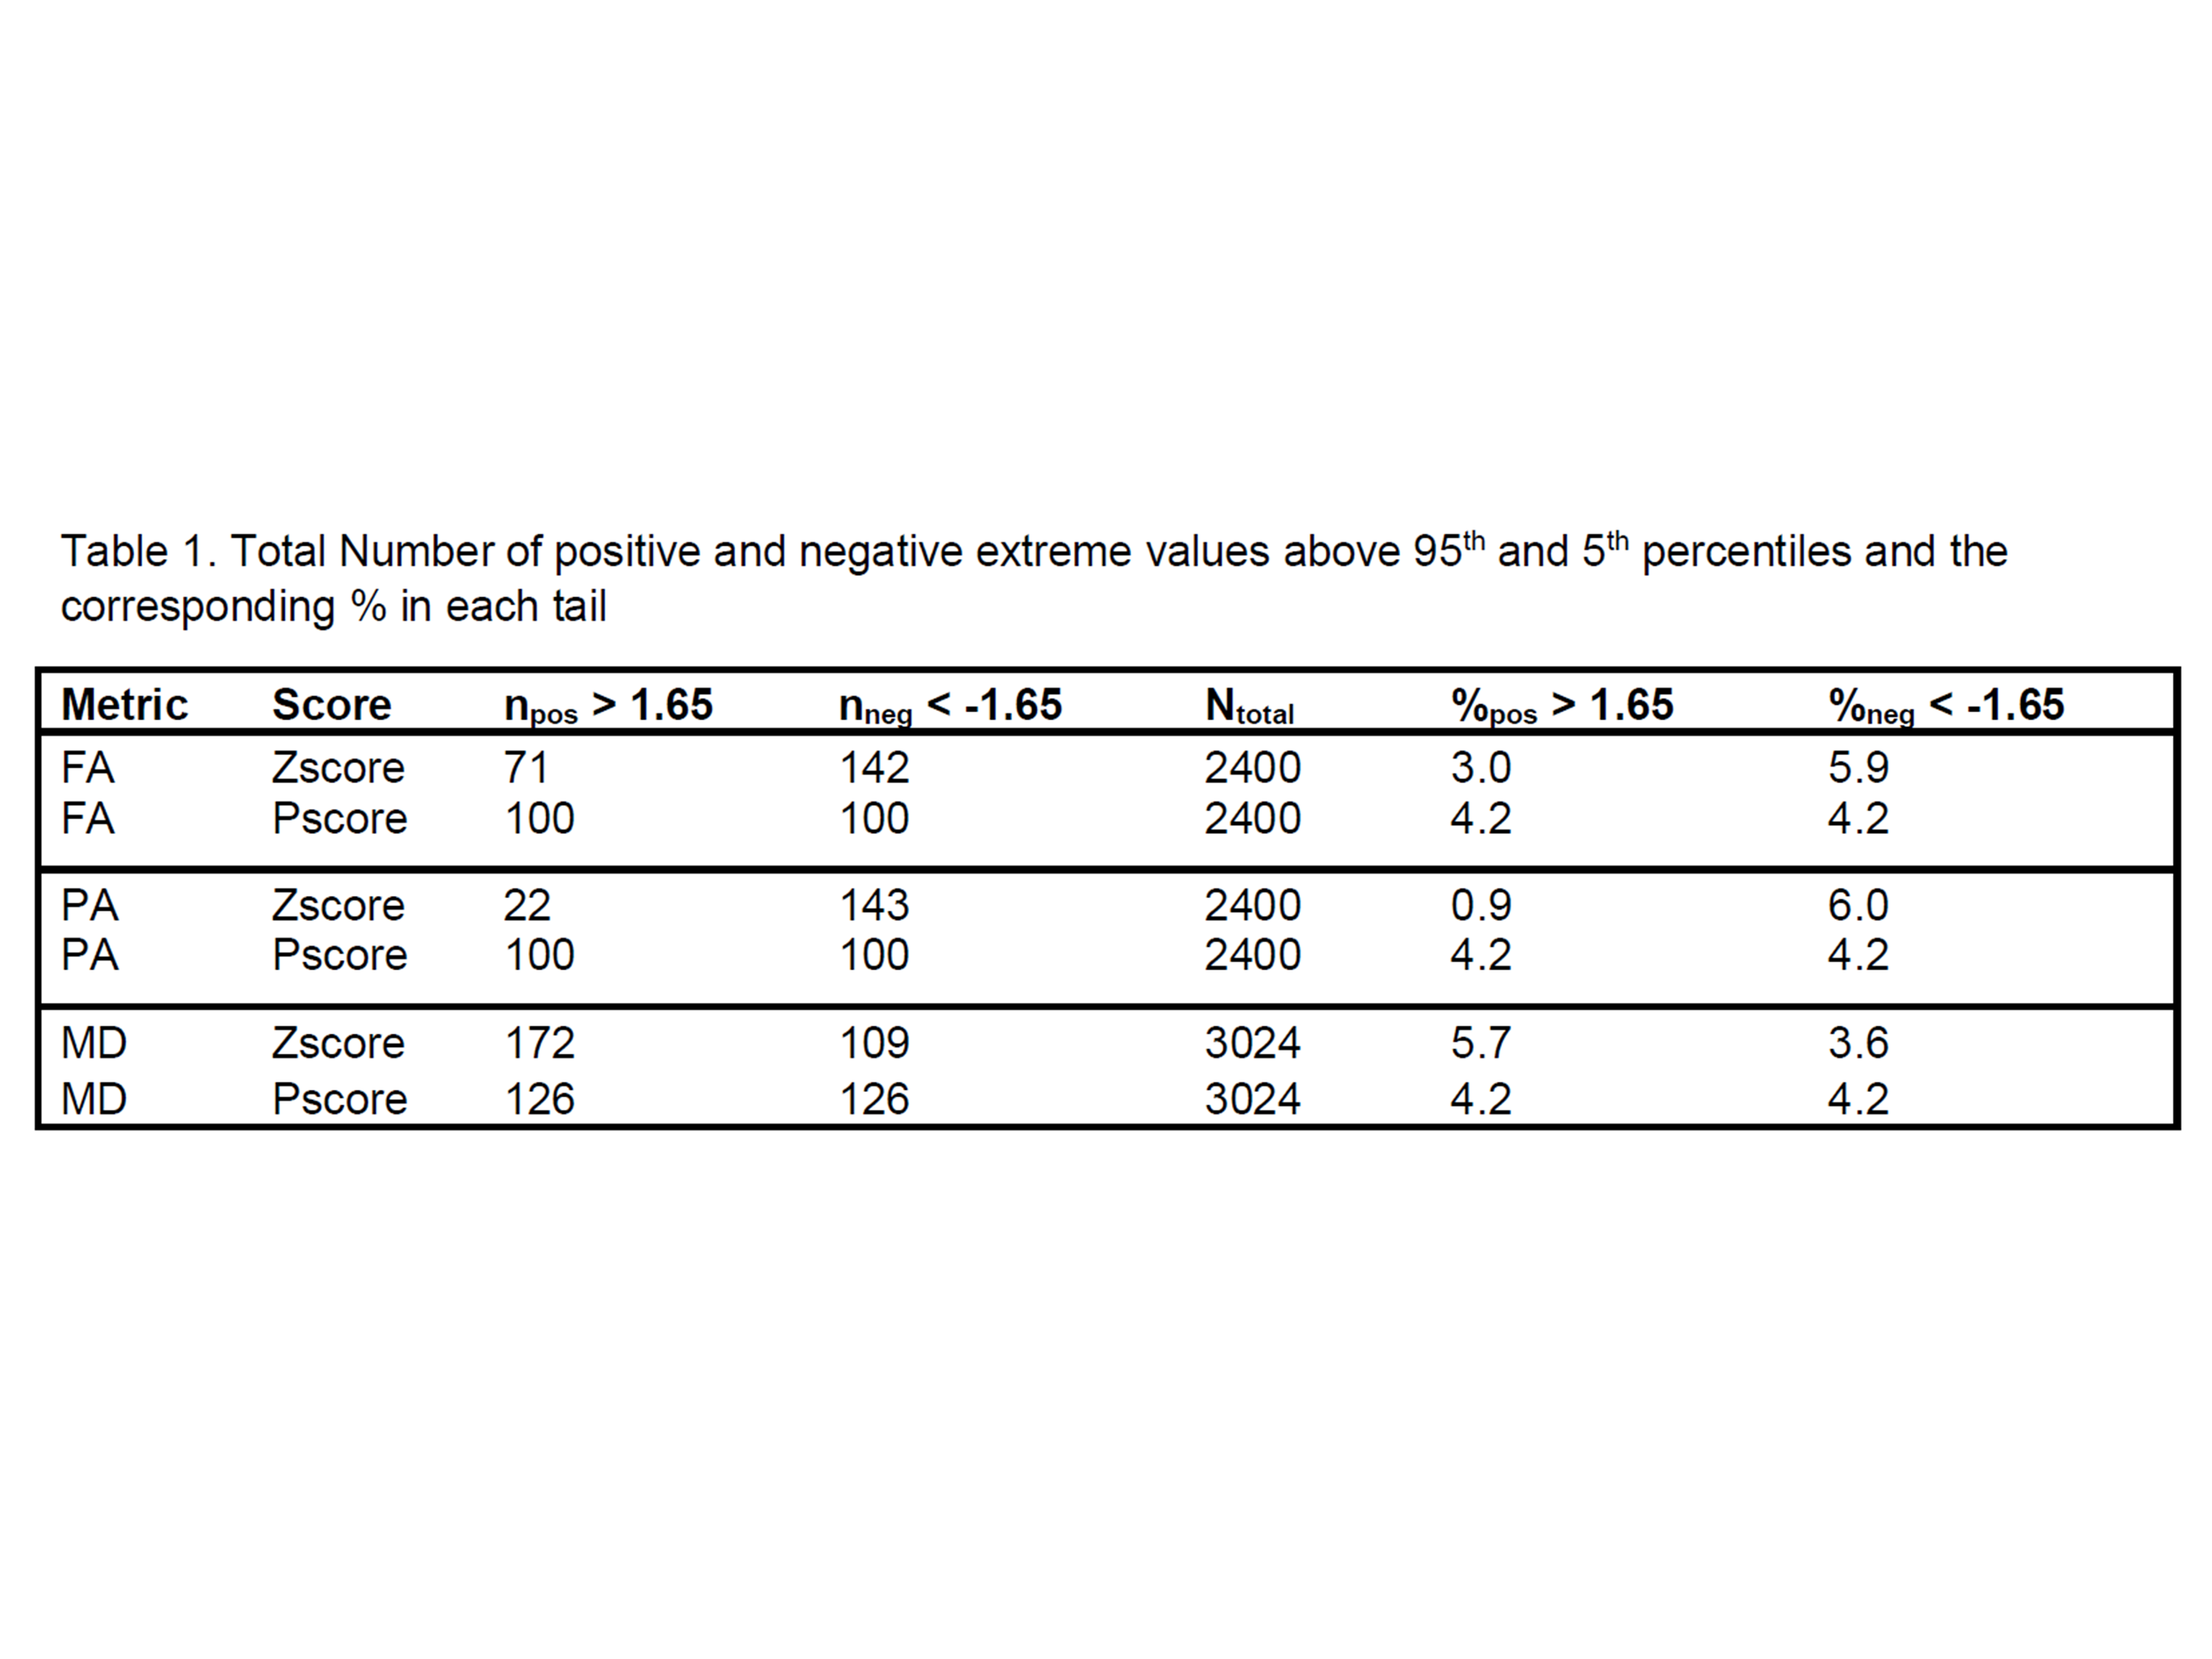
Figures 1(a), 2(a) and 3(a) show heatmaps of Z-scores (left) and ‘P-scores’ (right) for FA, PA and MD, respectively. Overall, we observe a negative bias in Z-scores from FA, more strongly from PA, and a positive bias from MD. The correction for imbalance in positive and negative extreme values can be visually inspected from the 'P-score' heatmaps. Figures 1(b), 2(b) and 3(b) show the histograms of Z-scores (top) and ‘P-scores’ (bottom) from all ROIs for FA, PA and MD, respectively. We fitted a normal distribution curve in each histogram to assess which score follows it closely. The Z-score distributions (top) are negatively skewed for FA and PA, and positively skewed for MD, while the P-score distributions (bottom) for all three are controlled for this skewness, bringing it closer to a normal distribution. The imbalance in the % of these extreme values from Z-scores is quantified in Table1, e.g., for PA, “%neg < -1.65” is ~6 times of “%pos > 1.65” and we can appreciate that the ‘P-scores’ correct this imbalance having a 1:1 ratio between “%neg < -1.65” and “%pos > 1.65”. Similarly, FA and MD can be evaluated. A limitation of the method is that we used a set pair of boundaries (5th/95th) to compute ‘P-scores’. However, given a sufficient sample size, a normative distribution with incremental percentile boundaries can be obtained and individual deviations can be assessed correctly even if the data originates from a heavy-tailed distribution.Conclusion
We proposed using a novel quantity called ‘P-score’ to correct for skewness in the data and provide a more accurate position of an individual from the median of a normative distribution. We demonstrated the presence of skewness in three diffusion MRI metrics and how ‘P-scores’ correct the overestimation and underestimation of extreme values when Z-scores are used in heavily skewed data. Although applied in a diffusion imaging setting, the 'P-score' method has the advantage to be universally applied in any imaging and clinical data.Acknowledgements
No acknowledgement found.References
- Sherwood B, Zhou AX, Weintraub S, Wang L (2015). Using quantile regression to create baseline norms for neuropsychological tests. Alzheimers Dement (Amst). Dec 19;2:12-8. doi: 10.1016/j.dadm.2015.11.005. PMID: 27239531; PMCID: PMC4879644.
- Pierpaoli C (2010). TORTOISE: an integrated software package for processing of diffusion MRI data ISMRM, 2010.
- Irfanoglu MO (2018). TORTOISE v3: Improvements and New Features of the NIH Diffusion MRI Processing Pipeline. ISMRM, 2018.
- Irfanoglu MO, Beyh A, Catani M et al. (2022). ReImagining the Young Adult Human Connectome Project (HCP) Di. Proc Intl Soc Mag Reson Med 30 2022
- Koenker, R., & Bassett, G. (1978). Regression Quantiles. Econometrica, 46(1), 33–50. https://doi.org/10.2307/1913643
- Koenker, R. (2005). Quantile Regression (Econometric Society Monographs). Cambridge: Cambridge University Press. doi:10.1017/CBO9780511754098
Figures
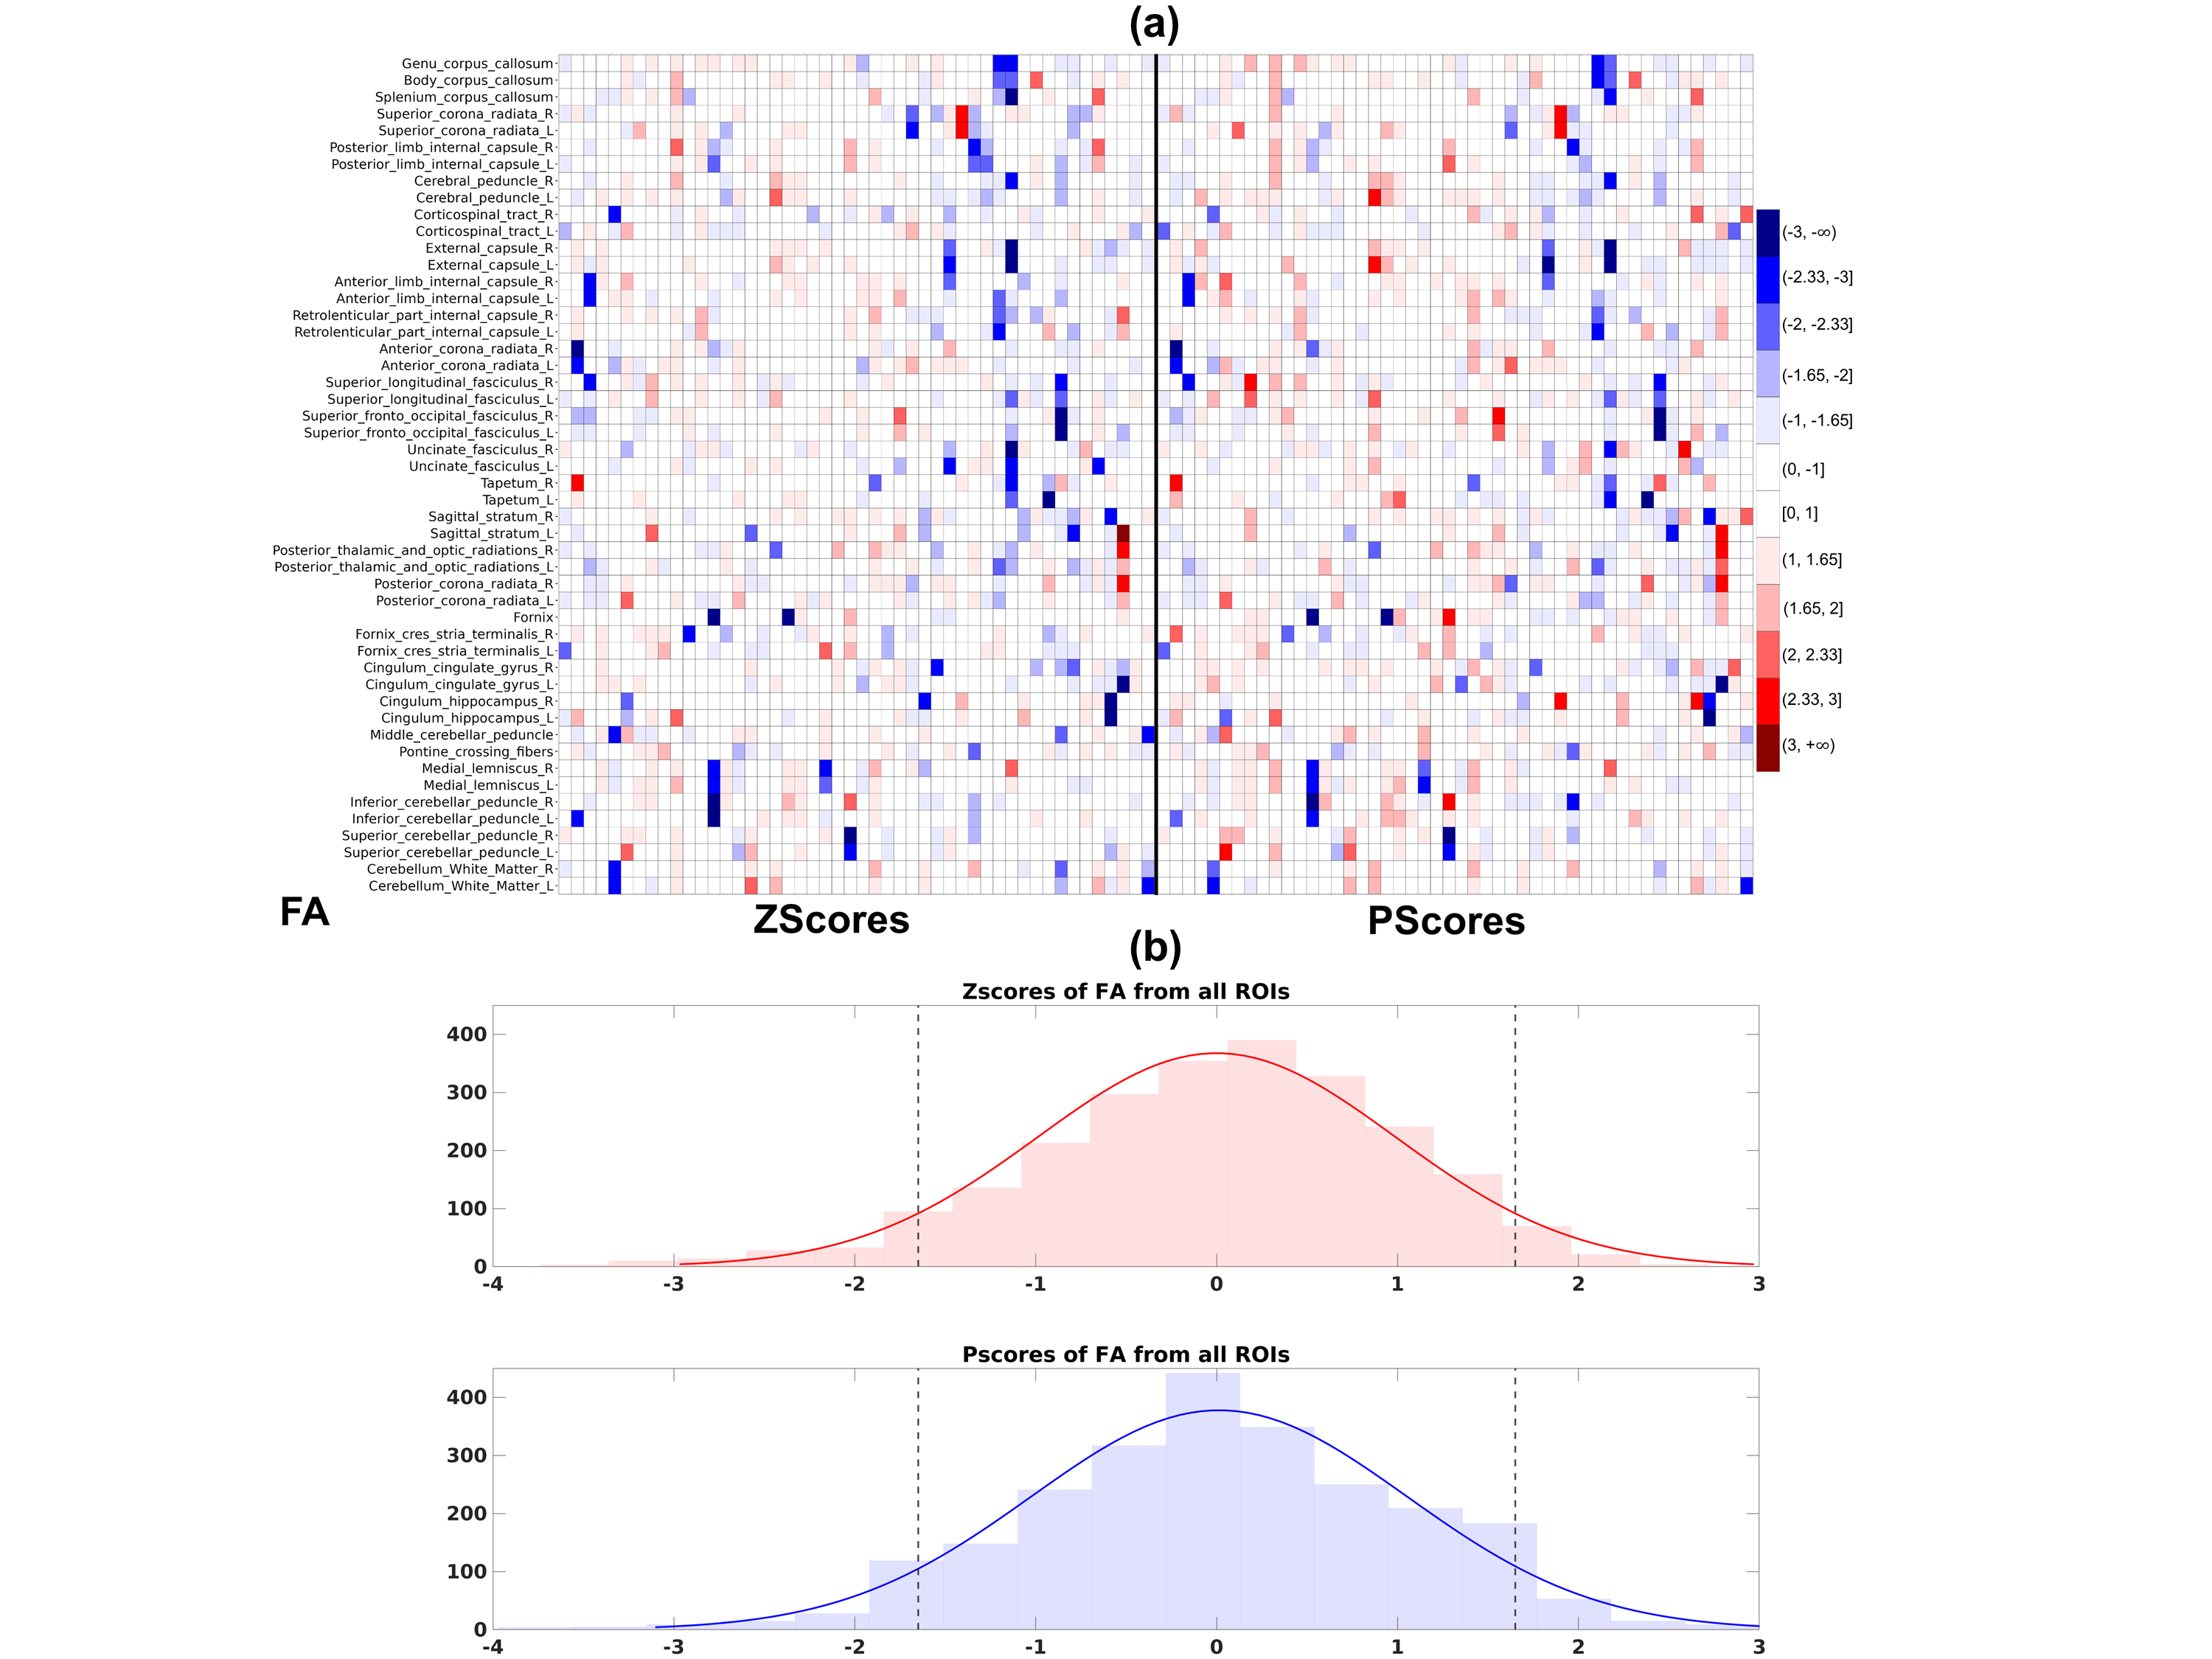
Figure 1. (a) Heatmaps comparing Zscores (left) with Pscores (right) for FA. The color-bar thresholds correspond to specific Z-score percentiles ranging from the 1st-99th (∓2.33), and scores > 3 and < -3, have the darkest red and blue shades, respectively. Individuals are in the x-axis, and ROIs in the y-axis. (b) Histogram of Zscores (top) and Pscores (bottom) from all ROIs shown in the heatmaps above. A fitted normal distribution curve in each histogram shows ‘P-scores’ achieve a closer fit. Dotted lines are the ±1.645 boundaries, with scores in the x-axis and frequencies in the y-axis.
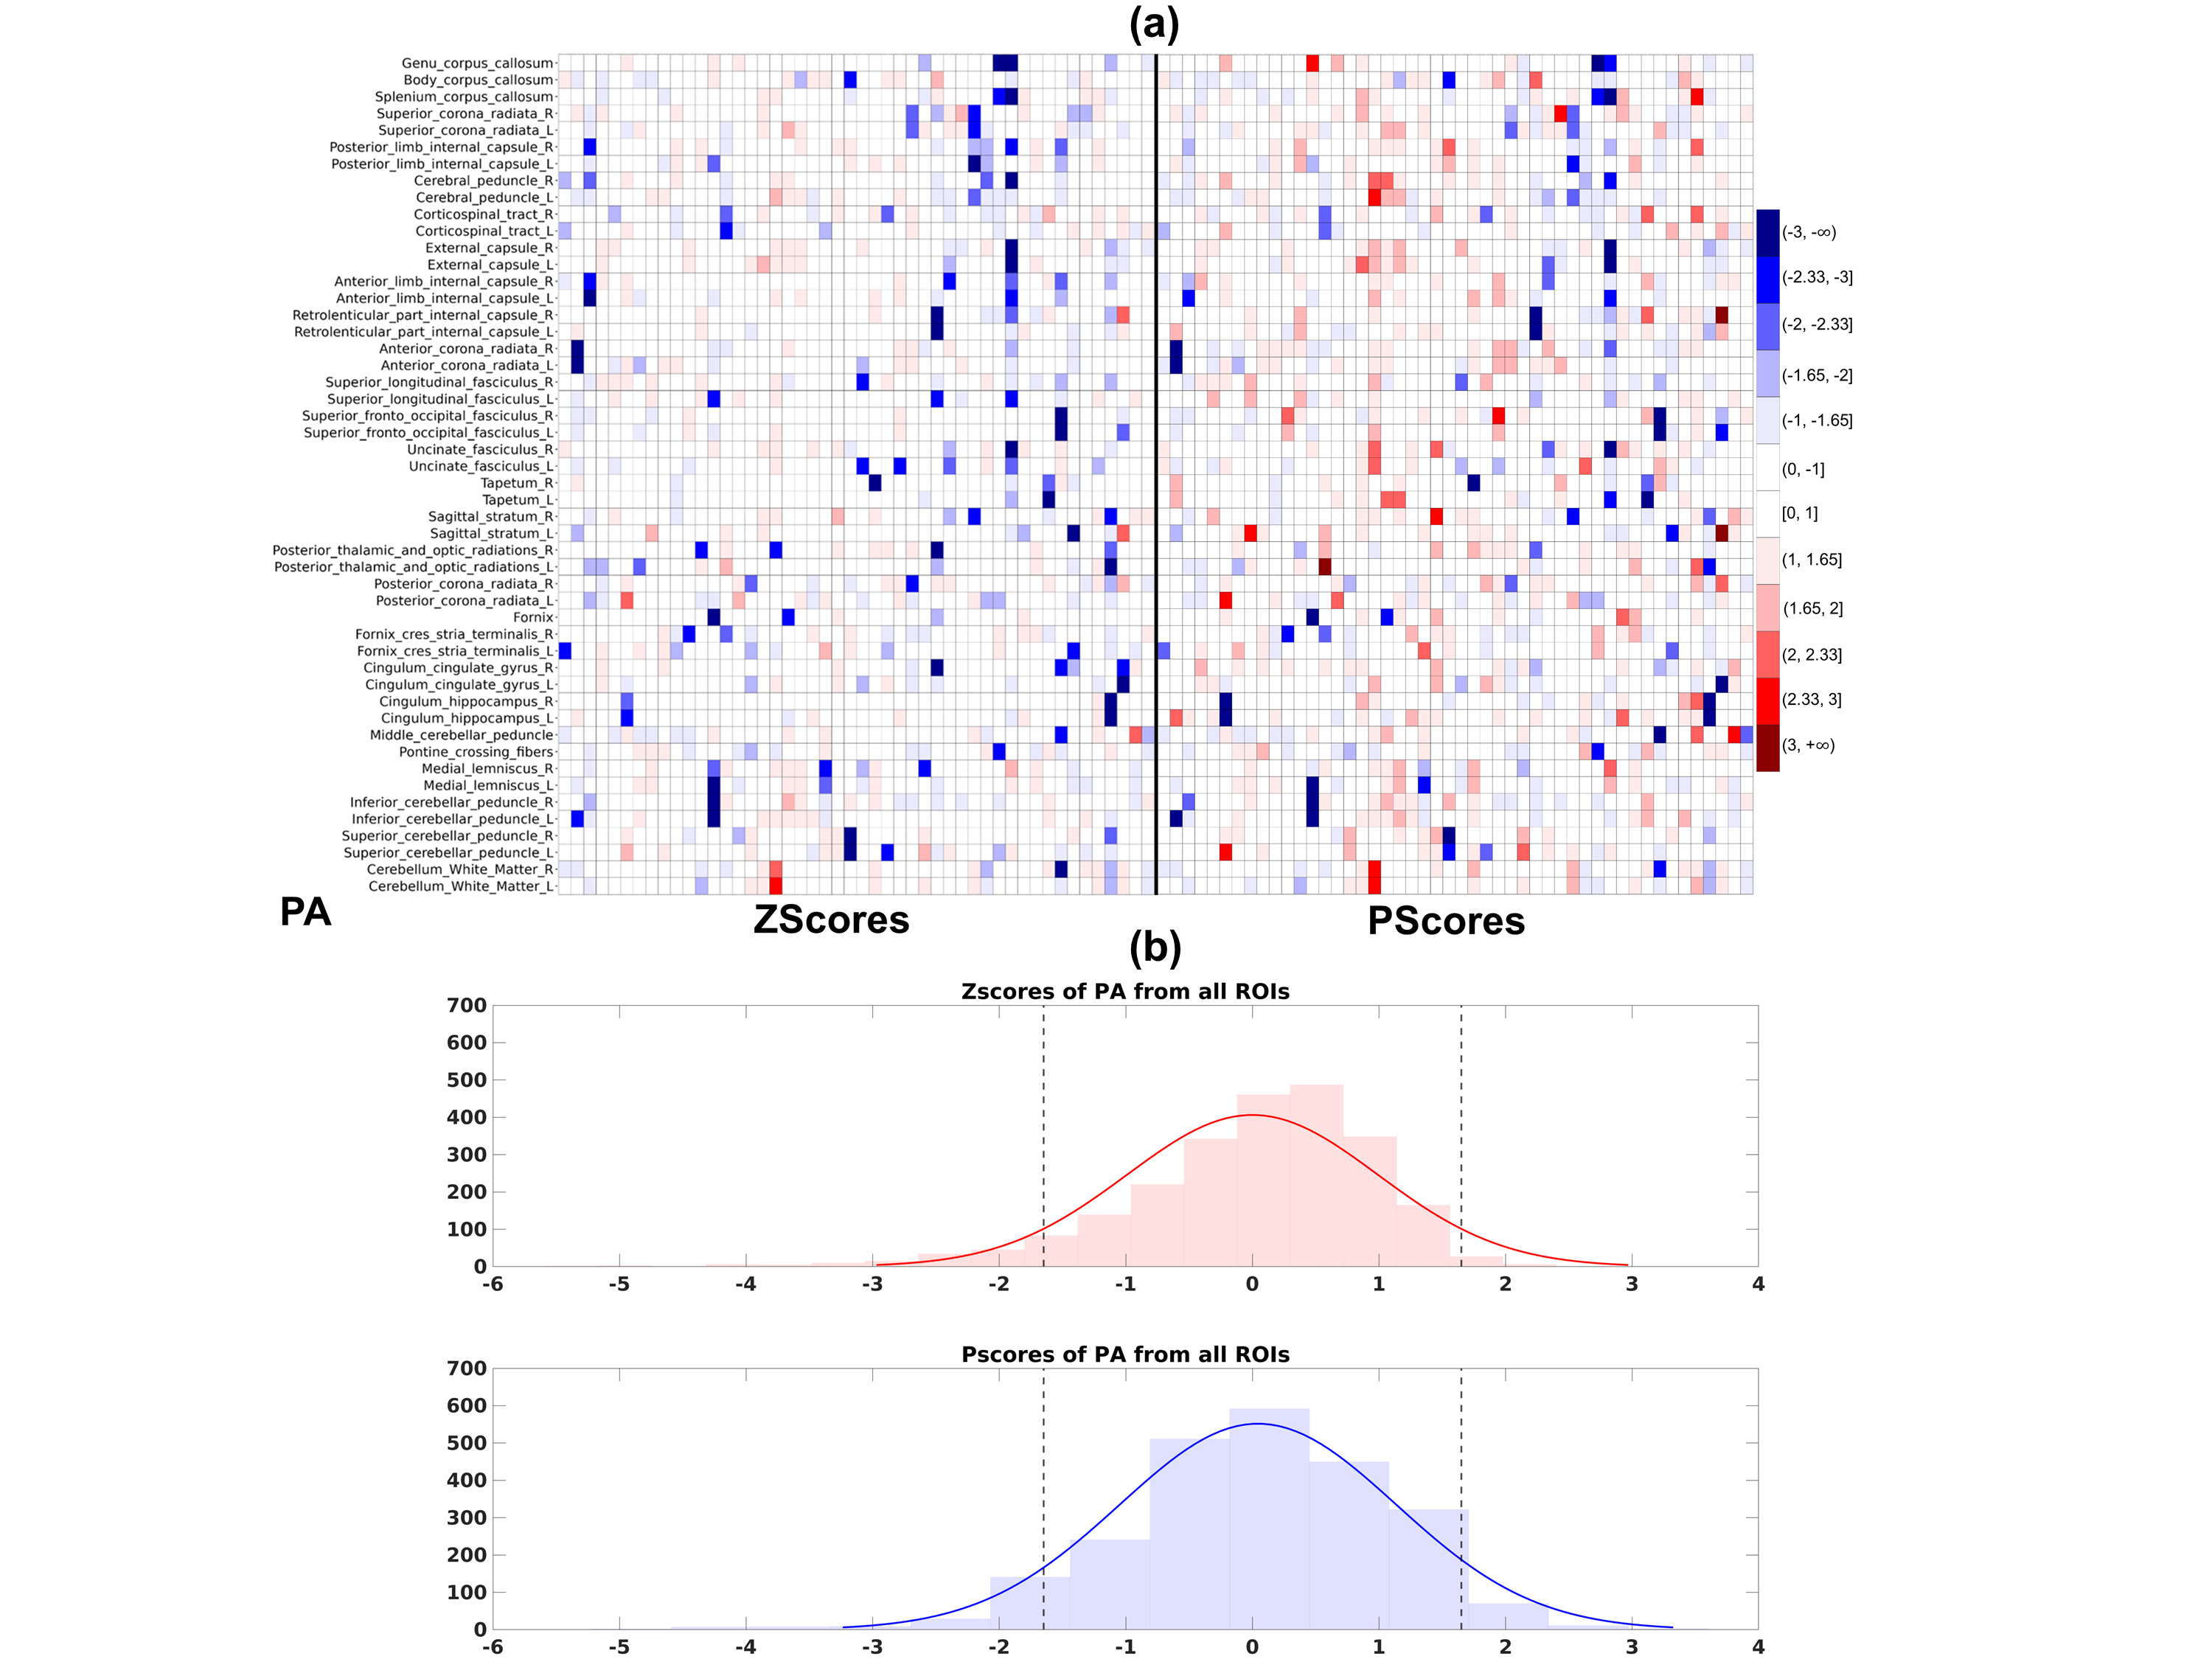
Figure 2. Similar descriptions apply as Figure 1(a) and (b), respectively, but for PA. (a) Compared to Figure 1(a), a higher number of negative extreme values can be observed for PA in Z-scores (left), having more dark blue tiles than red, which is balanced out in the ‘P-score’ heatmap with an even spread of red and blue tiles. (b) The Z-score histogram (top) is negatively skewed with more pink bars beyond Z = 0, but the ‘P-score’ histogram (bottom) is more balanced and attains a better fit to the normal distribution curve.