3779
Automatic enhancing objects detection and segmentation in breast DCE-MRI1Research and Innovation Department, Olea Medical, La Ciotat, France, 2Clinical solution department, Olea Medical, La Ciotat, France
Synopsis
Keywords: Breast, Cancer, CAD
The aim of our work is to detect any enhancing object of interest for reporting purposes. A deep learning approach combined with a multi-constructor and multi-centric database enabled to initiate the development of a versatile tool in line with clinical real life. The detection problem was addressed using a two-stage three-dimensional cascaded U-Net architecture. A total of 610 single-breast images were used for the model development. Results present interesting score in term of Dice similarity index (0.83) which agree well with the recent literature. Discussion section focuses on the potential benefit in the use of a recently reported loss function.Introduction
MRI is the referent modality for breast cancer characterization and staging. This multiparametric examination includes the dynamic contrast-enhanced imaging (DCE-MRI) used for lesions analysis (shape, margins, and internal enhancement). Findings are classified following the BI-RADS lexicon [1] as score 1-to-6, respectively low to high risk. Benign findings are typically cysts or fibroadenomas, malignant findings are breast cancers. This scoring is also used for patient care, i.e. follow-up for category 3 and biopsy for category 4 and 5. Breast MRI reporting should describe lesions, axillary nodes, intra-mammary nodes, scar tissue. Recent studies [2]–[7] oriented toward breast-MRI analysis focus on detection and classification of the lesion. The aim of our work is to detect any enhancing object of interest for reporting purposes. A deep learning approach combined with a multi-constructor and multi-centric database enabled to initiate the development of a versatile tool in line with clinical real life.Methods
Our database consisted of 305 full DCE-MRI exams from 4 different imaging centers with different manufacturers, systems and sequence parameters. In-plane resolution ranges from 0.4 to 1.0 millimeter, and slice thickness ranges from 1.0 to 3.5 mm. The pre-contrast and the peak enhancement phases were subtracted to emphasize enhancing objects. The subtraction image was then prepared to comply with our learning strategy. The thorax and background domains were occulted thanks to prior segmentation using a dedicated deep learning model. Also, an automatic breasts dissociation was performed (Fig.1): both were separated using the sagittal plane passing through the sternum; areas behind the sternum were removed.A total of 610 single-breast images were obtained. This dataset was split patient-wise into training, validation, and test datasets, with respective proportions of 70%, 20% and 10%. The data labelization was done by 3 breast-MRI experts with the support of exam reports. This process yielded a total of 1612 annotated objects: 1139 lesions (83% benign and 17% malignant) and 473 miscellaneous enhancing objects. The object volume spreads between 4 and 36 422 mm3, with a median of 135 mm3.
The binary segmentation was addressed using a two-stage three-dimensional cascaded U-Net architecture (Fig. 2). Each U-Net parametrization was done following the nnU-Net procedure [8]. The loss function was a combination of cross-entropy loss and Dice loss. Interestingly, a deep-supervised loss [9] with three deeply supervised heads was exploited. Random data augmentations were applied such as: zoom, additional noise, smoothing, intensity rescaling and flip. The learning ability was monitored using the dice similarity index (DSI) during the training.
Results
Model evaluation was performed on the test dataset consisting of 60 single-breast images, comprising 131 objects including 65 lesions (53 benign and 12 malignant). Performances were evaluated using a cluster-wise DSI: for each ground-truth object, one DSI is computed with the combined areas of all overlapping predicted clusters (i.e., a cluster being a voxels group with a connectivity of one). A ground-truth object is considered detected when DSI is greater than 0.2, as used in [3]. We also monitored the average number of false-positive clusters per breast (FPB) [6], i.e. predicted clusters not overlapping with any ground-truth object.Results showed a total detection rate of 49% (64/131), with an FPB of 4.52. The resulting DSIs range from 0.28 to 0.96, with a median of 0.83 (Fig.3). Further analysis dealing with detection ability was done regarding the object type (lesion or other) and the object volume. On one hand, our model performs equivalently on all types of enhancing objects: 46% (30/65) of lesion were detected and 52% (34/66) of other objects were detected, with respective median DSIs of 0.81 and 0.85 (Fig.3). On the other hand, the object volume seems to influence detection: 71% (46/66) of objects bigger than 135 mm² were detected and 26% (17/65) of objects smaller than 135 mm², with respective median DSIs are 0.84 and 0.81 (Fig.3). One can notice no effect on segmentation quality, with median DSI of over 0.8 whatever the volume or type of the object (Fig.3-4).
Discussion and Conclusion
Abnormalities detection in breast DCE-MRIs is complex due to the variety of objects shapes, sizes, locations, and intensity enhancement patterns. In this study, we have chosen to highlight this diversity by incorporating other enhancing objects usually described in clinical reports. The diversity in constructors and in imaging centers is another important characteristic of the dataset, as we intend to be as close as possible to clinical ground-truth. Presented results report a high FPB which can be mitigated by several factors. Firstly, the wide range of objects volume may penalize the detection of the smaller ones. Also, the diversity we intended to reflect may lead to an underperforming training stage caused by the limited cases number in this study.Still, when a detection occurs, median DSI values (0.83) agree well with the literature: 0.77 [1], 0.82 [7] and 0.835 [5]. These lesion-only studies have achieved detection rates above 90%. We can conjecture such results will be achievable once the volume problem is addressed. Innovative loss functions can provide more guidance in the learning process to better account for small objects. Also, better control of the FPB is needed and the outlier-suppression loss described in [5] may override this limitation.
Acknowledgements
The authors would like to thank Manon Schott for her invaluable help in managing the data.References
[1] S. J. Magny, R. Shikhman, and A. L. Keppke, “Breast imaging reporting and data system,” in StatPearls, StatPearls publishing, 2022.
[2] L. Hirsch et al., “Radiologist-Level Performance by Using Deep Learning for Segmentation of Breast Cancers on MRI Scans,” Radiol Artif Intell, vol. 4, no. 1, 2022.
[3] H. Min, D. McClymont, S. S. Chandra, S. Crozier, and A. P. Bradley, “Automatic lesion detection, segmentation and characterization via 3D multiscale morphological sifting in breast MRI,” Biomed Phys Eng Express, vol. 6, no. 6, Sep. 2020.
[4] G. Maicas, G. Carneiro, A. P. Bradley, J. C. Nascimento, and I. Reid, “Deep reinforcement learning for active breast lesion detection from DCE-MRI,” Lecture Notes in Computer Science (including subseries Lecture Notes in Artificial Intelligence and Lecture Notes in Bioinformatics), vol. 10435 LNCS, pp. 665–673, 2017.
[5] X. Meng et al., “Volume-awareness and outlier-suppression co-training for weakly-supervised MRI breast mass segmentation with partial annotations,” Knowl Based Syst, vol. 258, p. 109988, Dec. 2022.
[6] A. Vignati et al., “Performance of a Fully Automatic Lesion Detection System for Breast DCE-MRI,” vol. 1351, pp. 1341–1351, 2011.
[7] G. Maicas, G. Carneiro, A. P. Bradley, and † Acvt, “Globally optimal breast mass segmentation from DCE-MRI using deep semantic segmentation as shape prior,” in IEEE 14th International Symposium on Biomedical Imaging, 2017.
[8] F. Isensee et al., “nnU-Net: Self-adapting Framework for U-Net-Based Medical Image Segmentation,” Informatik aktuell, p. 22, Sep. 2018.
[9] Q. Zhu, B. Du, B. Turkbey, P. L. . Choyke, and P. Yan, “Deeply-Supervised CNN for Prostate Segmentation,” Mar. 2017.
Figures
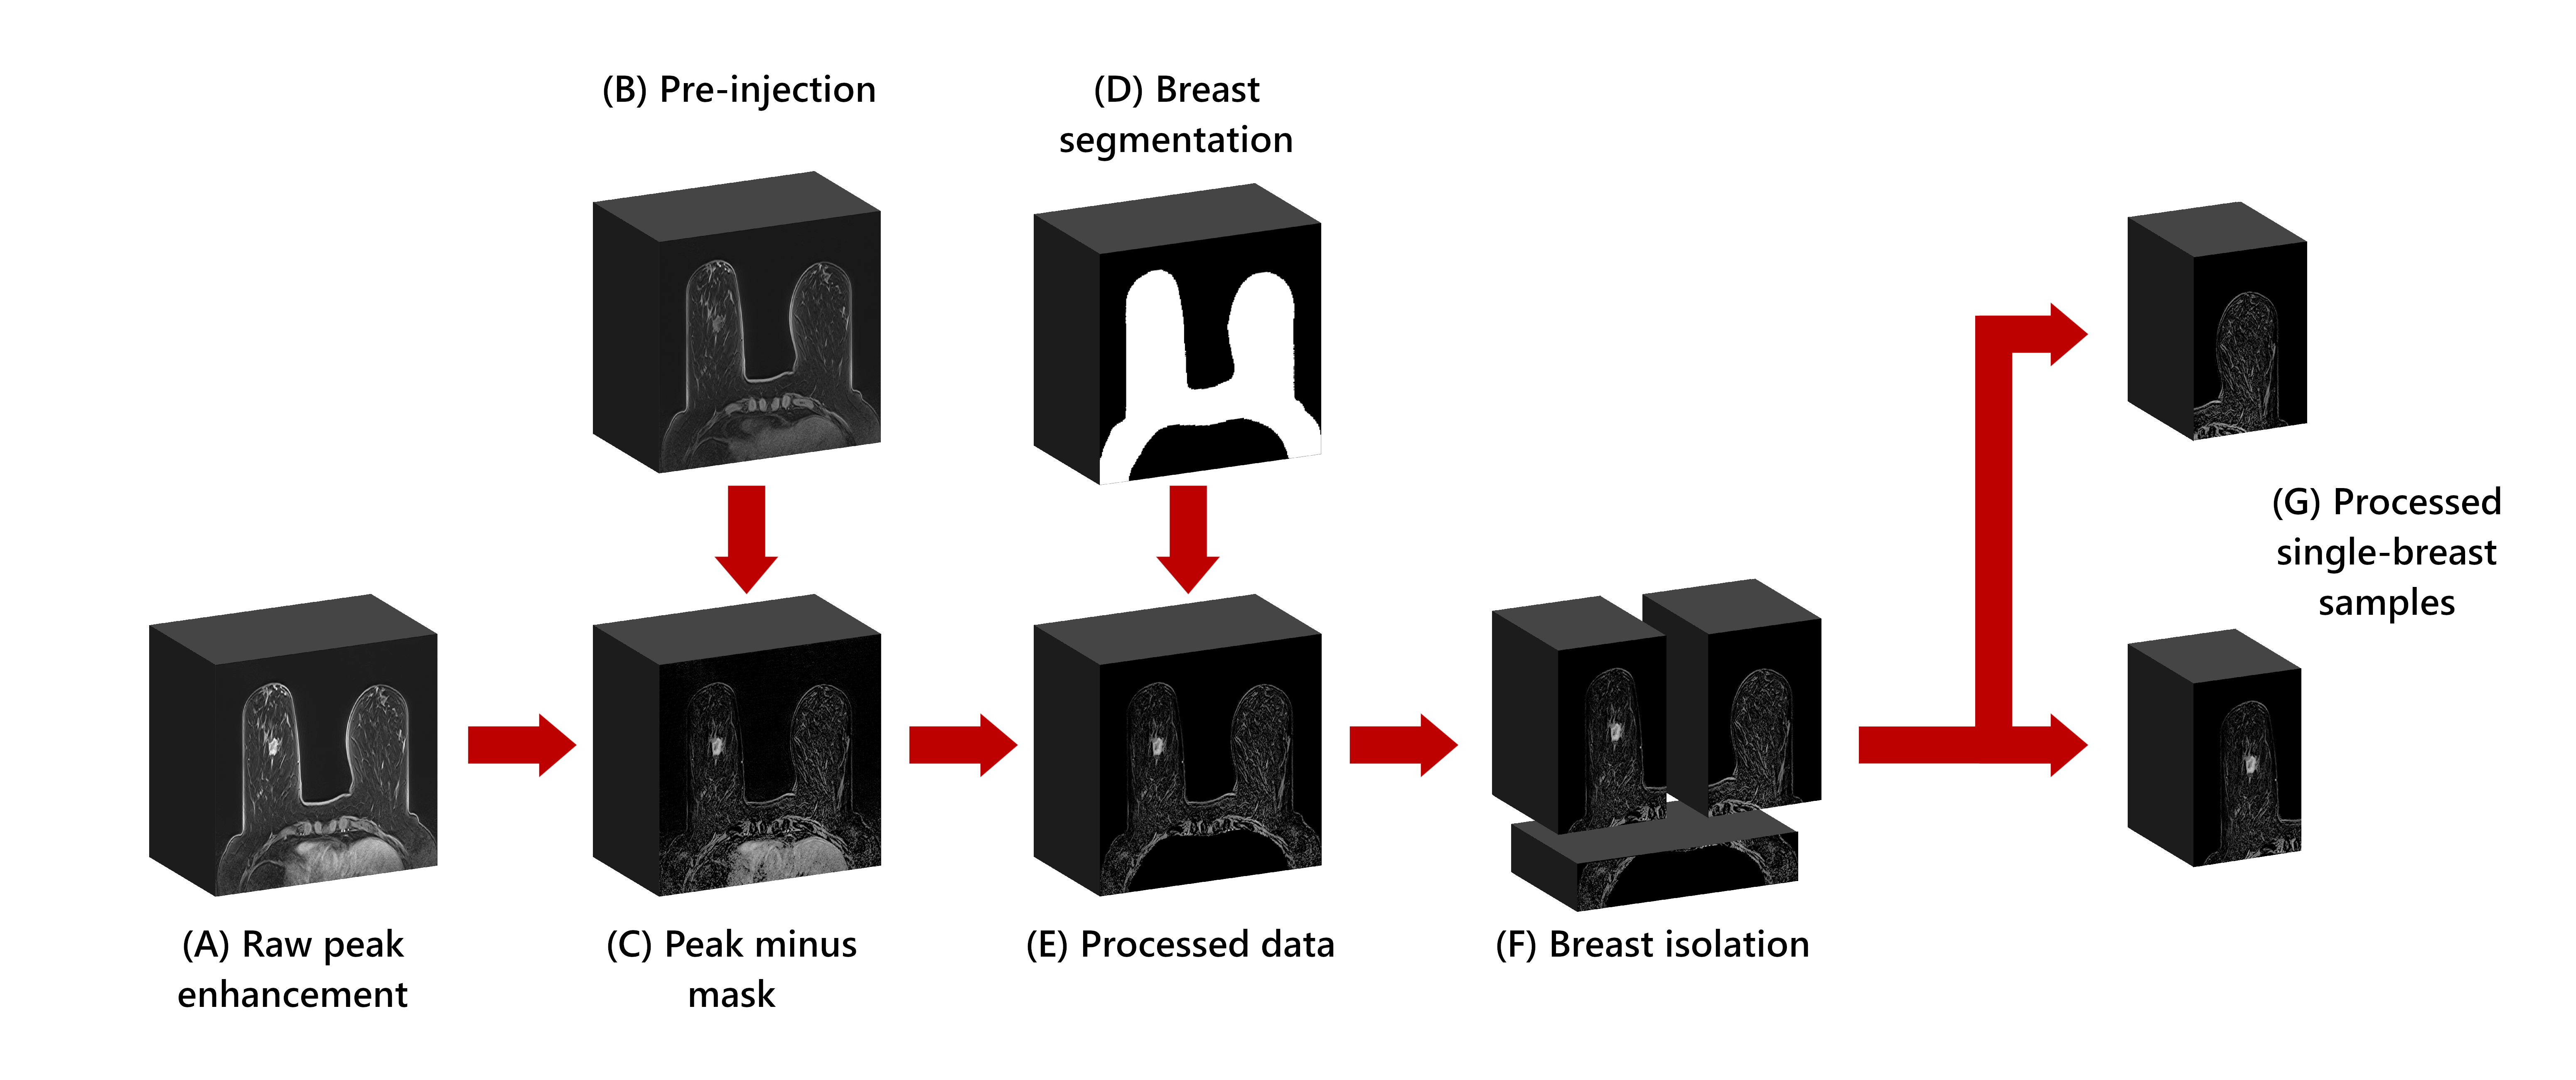
Schematic of the preprocessing
The raw image (A) is a 3-D image of peak enhancement from DCE-MRI. The pre-contrast image (B) is subtracted from the raw image to highlight enhancement (C). Breast segmentation (D) is given by a prior deep learning model and used to occult thorax and background domains (E). The image is cropped behind the sternum and split into two single-breast images (F). Both images are included in the dataset (G).
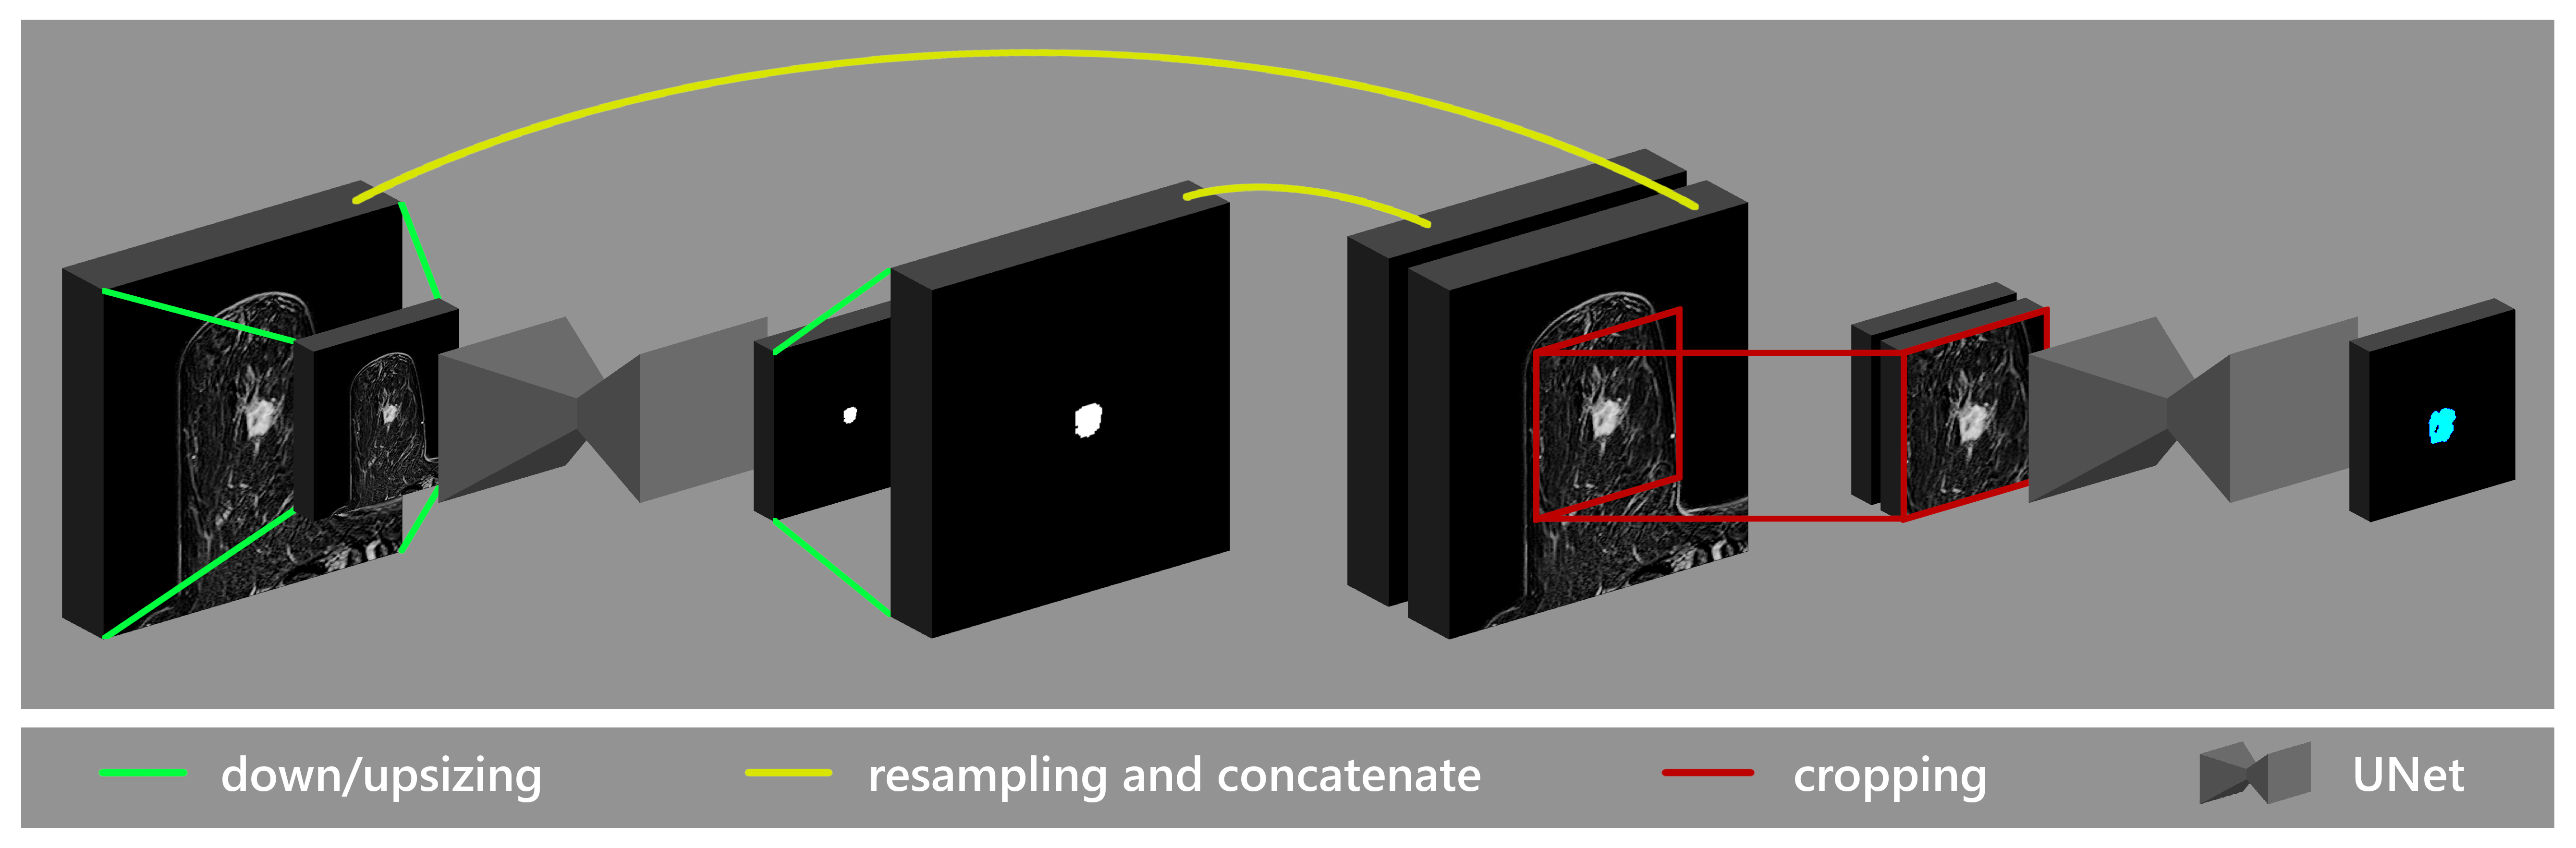
Two-stage cascaded U-Net architecture following nnU-Net protocol
Two U-Net models with the same input dimensions are trained. The input of the first model consists of a downsized image. The images and the predictions from the first model are resized to match the dataset median spacing, and then are concatenated to form a two-channel input for the second model. The second model is trained using a patch-based strategy.
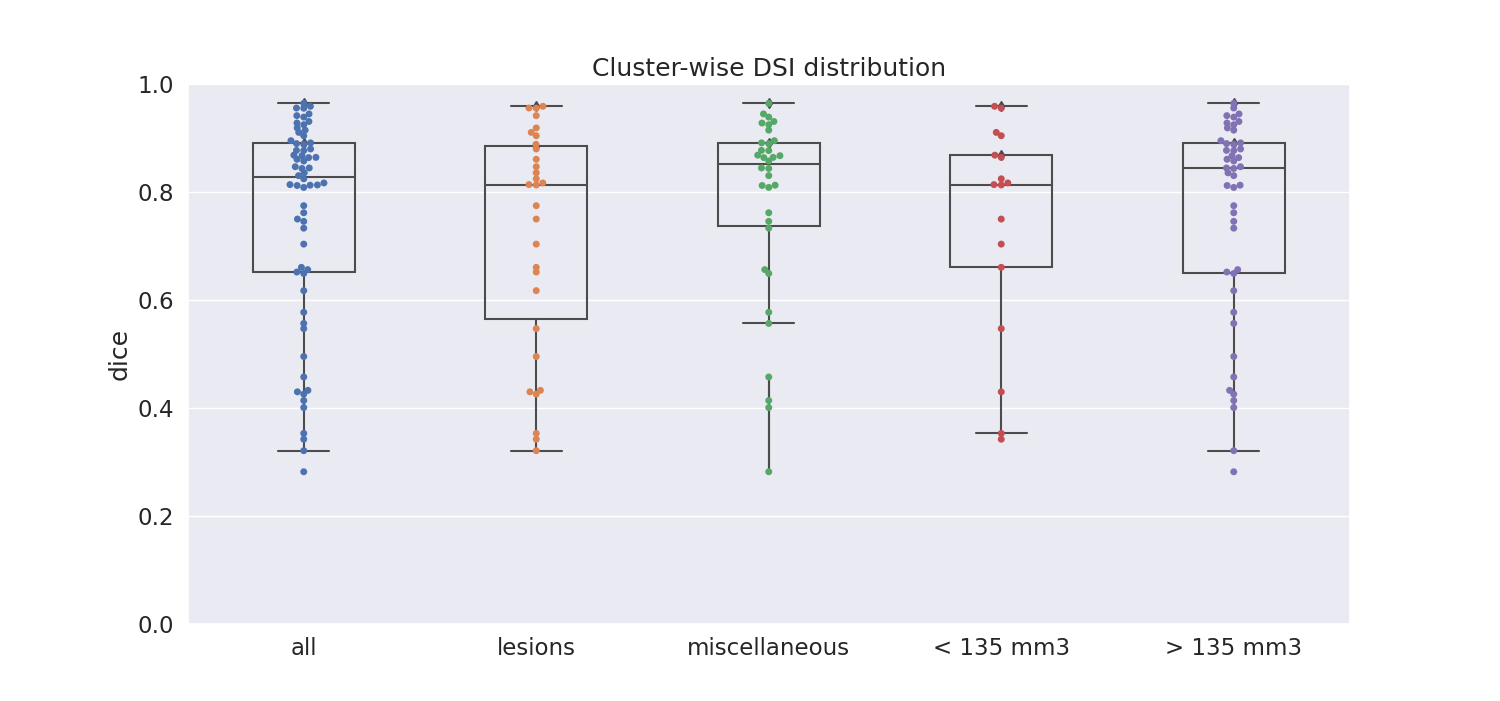
Cluster-wise DSI distribution on detected objects
Box plots represent cluster-wise DSI distribution when considering all types, lesion type, miscellaneous type, objects smaller than 135 mm3, and objects bigger than 135 mm3. Box plots show median (center line), quartiles (box), and 1.5 interquartile range (whiskers). Single cluster-wise DSI values are represented by dots.
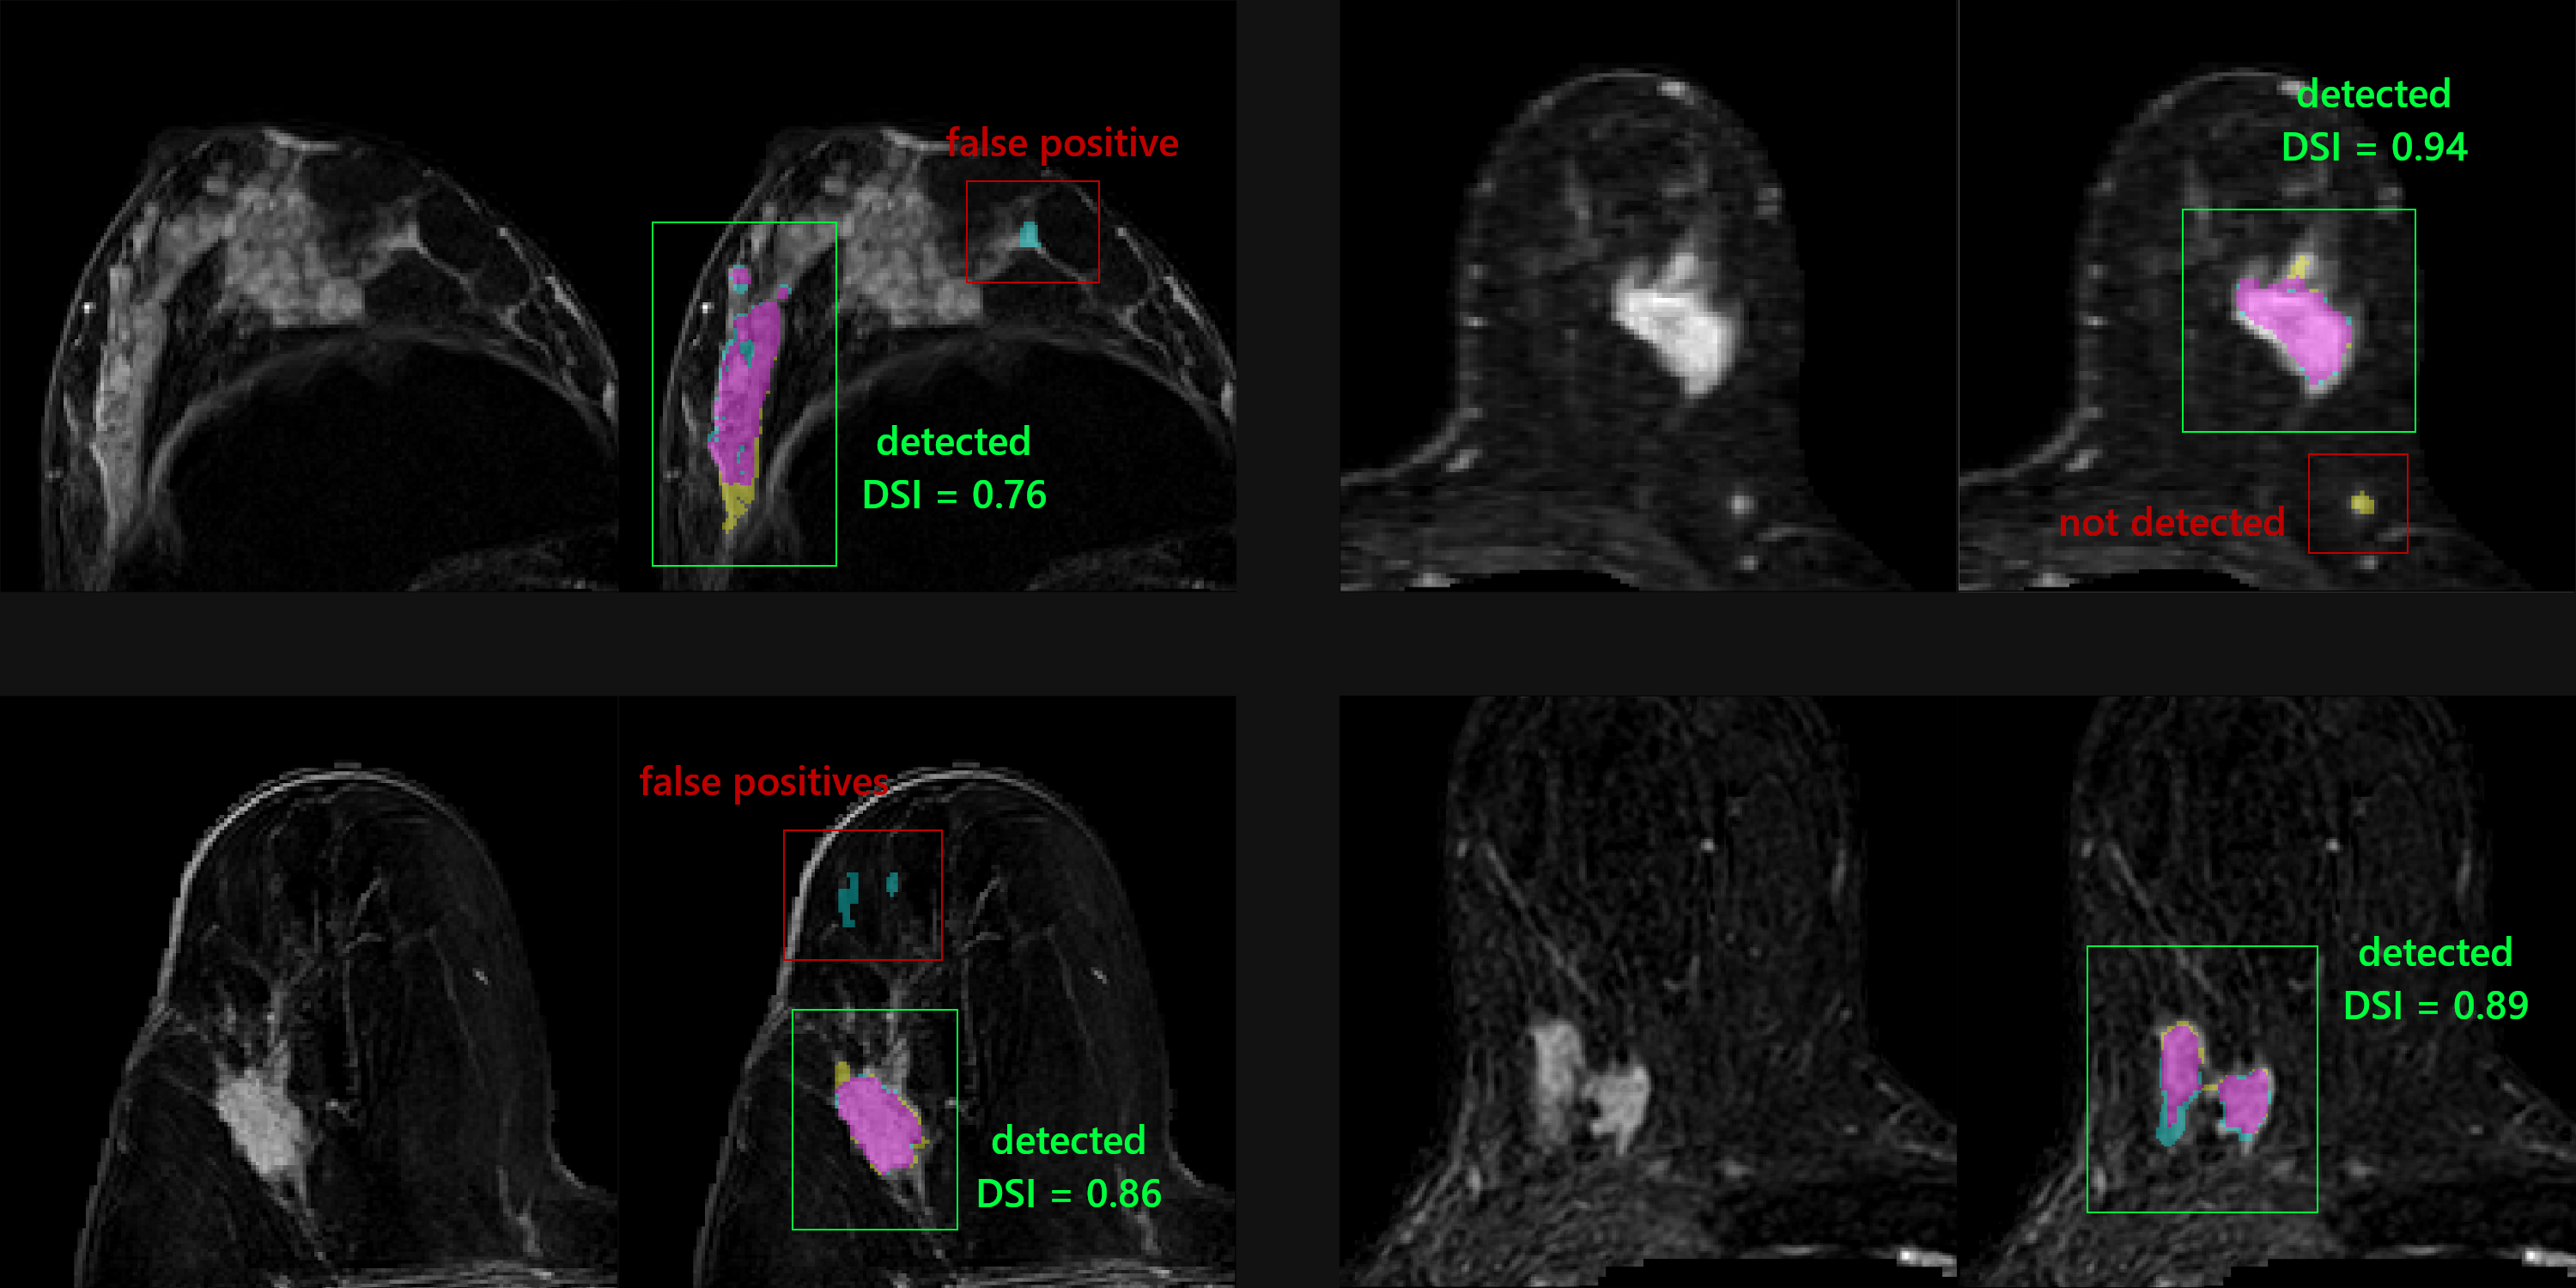
Examples of segmentation results
Four single-breast 2-D slices from 3-D subtraction images are shown. The colored images display the comparison between ground-truth (yellow), prediction (blue), and their intersection (magenta).