3776
Deep Learning-based Prostate Lesion Segmentation and Classification Using Haralick Texture Maps on MR images1Research and Design, Promaxo Inc, Oakland, CA, United States
Synopsis
Keywords: Radiomics, Cancer, Prostate
By quantifying pixel relationships from frequencies of local signal intensity spatial variations, Haralick texture features have shown promise for prostate cancer detection. In this study, axial, T2-weighted MR images combined with extracted Haralick texture feature maps were used in a deep learning framework to identify lesion locations and predict Gleason Grade. Results demonstrate potential of Haralick texture features to segment and classify prostate lesions with AUC/sensitivity/specificity of 0.87/0.923/0.776 on patient-level evaluation.Introduction
Accurately identifying suspicious regions is essential for accurate diagnosis, and timely and effective treatment, of prostate cancer. Automatically identifying lesion locations on imaging, as well as aggressiveness of lesions, could reduce read times enabling the patient to get results and treatment earlier, prevent unnecessary biopsies, and reduce effects of inter-reader variability. Haralick texture analysis has shown promise for prostate cancer detection on T2-weighted MR images (T2WI)1. The purpose of this study is to evaluate the potential of Haralick texture maps, together with axial T2WI, as input channels to a deep learning framework to not only automatically locate and segment prostate lesion areas, but also predict their aggressiveness.Methods
This study used 3D, T2WI of 344 patients from the publicly-available ProstateX dataset for training, validation and testing2. An additional 30 datasets collected from our own IRB-approved study of patients who underwent a prostate biopsy procedure were used to further evaluate the algorithm. These datasets were used to assess performance on independent data from a center not used in the training.Four classes of prostate cancer aggressiveness were designated based on Gleason score (GS): group 0 (benign), group 1 (GS 3+3), group 2 (GS 3+4), group 3 (GS 4+3 and above).
Images were resized to 160 x 160 x 24 voxels with a spacing of (0.5, 0.5, 3) mm. B-Spline interpolation of third order was employed for image interpolation, while nearest neighbor interpolation was used for binary segmentation masks.
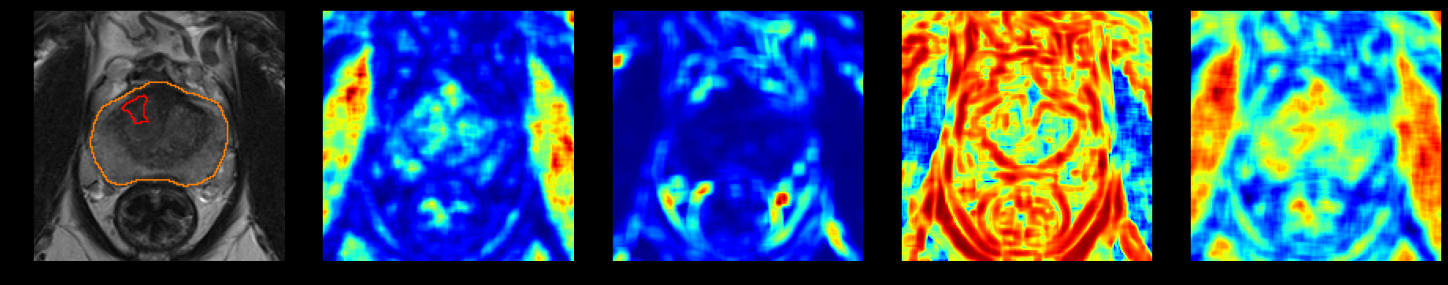
The images were normalized and rescaled to 0-63 gray levels. Then the gray level co-occurrence matrix (GLCM) was computed in 4 directions on transverse, 2D slices. Since many Haralick texture features are correlated with each other, we confined our texture maps to Energy, Correlation, Contrast and Homogeneity as representations of each of the texture groups (Contrast and Homogeneity belong to the Contrast group, Energy belongs to Orderliness group, and Correlation belongs to Descriptive statistics group)3,4. Prior literature has identified these features as useful for distinguishing prostate cancer by outcomes2. Thus, for each T2WI, four texture maps were created.
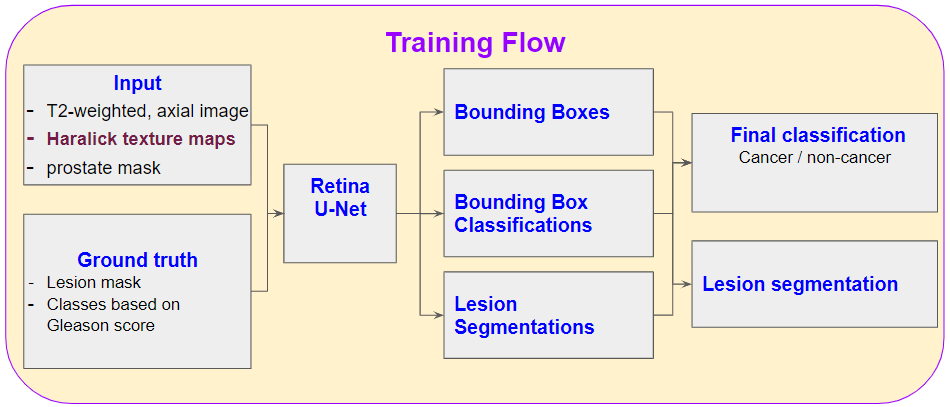
Normalized T2WI, its four corresponding texture feature maps, and a binary prostate segmentation mask were combined into a single multi-channel image for the deep-learning model, shown in Figure 1.
As prostateX provides only the center position of each lesion, we used the ground truth of lesion masks labeled by [5], with lesion-by-lesion quality check. For the datasets whose lesion masks were not labeled by [5], we applied the technique of automated lesion region growing from a seed, proposed by [6]. For the prostateX challenge test set with no lesion GS available, we used them to train segmentation and Bounding Box (BB) Regression but not classification of GS.
We used a modified Retina U-net, proposed in [6], in which U-Net architecture segments the lesions present in the image irrespective of their class, BB Regression refines coarse detections from feature map of decoder of U-Net, and BB classifier predicts their class. Figure 2 shows the training flow of the model.
Sorensen-Dice similarity coefficient, Sensitivity, Specificity, and Area Under the Curve (AUC) were used to evaluate the model.
Results
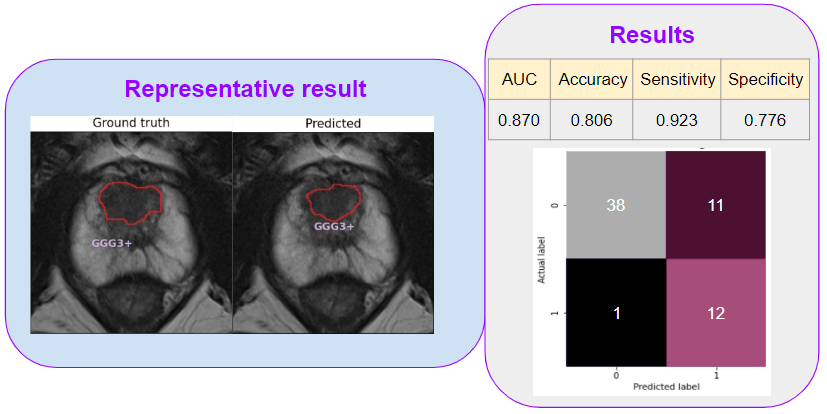
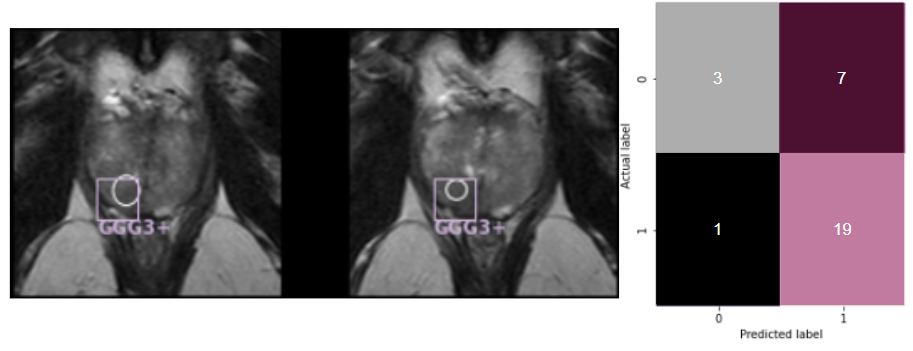
Model AUC, accuracy, sensitivity and specificity are 0.87, 0.806, 0.923, 0.776, respectively, on the patient level on the ProstateX test dataset. These metrics indicate that performance of the model is better than that of [6] where the authors also used Retina U-net architecture to train with 1.5 times the number of dataset and all available image contrast such as DWI, ADC map. We hypothesize that including the texture maps in the model input provides additional diagnostic information which gives better performance.Identified lesion locations and class predictions for both test sets are shown in figures 3 and 4. Figure 3 shows a representative image with predicted and ground truth labels for a ProstateX test case and the confusion matrix for ProstateX test set. Figure 4 shows a representative image and confusion matrix on data from our clinical study that tested the generalizability of the algorithm on data acquired from an independent center.
Discussion
Haralick texture feature maps were used in a deep learning framework and show promise in identification of lesion location, segmentation and GS prediction. While the method showed high predictive power on ProstateX test datasets, it also appears to work well on a smaller dataset from a different center. More evaluation is needed on datasets from multiple centers that use different T2-acquisition protocols. While the false positive rate was observed to be higher than expected, the authors note that the majority of lesion areas identified by the algorithm were concordant with radiologists identifying them as PI-RADS 4 or 5.Conclusion
In this study, Haralick texture maps were used as four of the input channels to a deep learning architecture to locate, segment and predict GS of lesions. We have demonstrated promising results at the patient-level in terms of AUC, sensitivity and specificity, potentially identifying suspicious regions accurately for acquiring a biopsy. Future work will investigate other network architectures to improve specificity of the model and incorporate training and testing data from additional institutions and sources to establish robustness to protocol and patient population factors.Acknowledgements
No acknowledgement found.References
1.Wibmer A, Hricak H, Gondo T, et al. Haralick texture analysis of prostate MRI: utility for differentiating non-cancerous prostate from prostate cancer and differentiating prostate cancers with different Gleason scores. Eur Radiol 2015;25(10):2840–2850
2. Geert Litjens, Oscar Debats, Jelle Barentsz, Nico Karssemeijer, and Henkjan Huisman. "ProstateX Challenge data", The Cancer Imaging Archive (2017). DOI: 10.7937/K9TCIA.2017.MURS5CL
3. Haralick RM, Shanmuga K, Dinstein I. Textural Features for Image Classification. Ieee Transactions on Systems Man and Cybernetics Smc. 1973; 3:610–621
4. Hall-Beyer, M., 2017a. GLCM Texture: A Tutorial v. 3.0 March 2017. Available at https://prism.ucalgary.ca/handle/1880/51900 (Online; accessed 14-March-2018).
5. R. Cuocolo, A. Stanzione, A. Castaldo, D.R. De Lucia, M. Imbriaco, Quality control and whole-gland, zonal and lesion annotations for the PROSTATEx challenge public dataset, Eur. J. Radiol. (2021) 109647. https://doi.org/10.1016/j.ejrad.2021.109647
6. Pellicer-Valero, Oscar J., et al. "Deep Learning for fully automatic detection, segmentation, and Gleason Grade estimation of prostate cancer in multiparametric Magnetic Resonance Images." Scientific reports 12.1 (2022): 1-13.
Figures