3770
Full spine 3D T2-weighted MRI with improved stitching for segmentation of the intrathecal space1Invicro LLC, A Konica Minolta Company, London, United Kingdom, 2Invicro LLC, A Konica Minolta Company, Needham, MA, United States
Synopsis
Keywords: Segmentation, Neurofluids, CSF segmentation spine
Computational fluid dynamics (CFD) has been used to model the behavior of cerebral-spinal-fluid (CSF) flow along the spine in research of intrathecal drug delivery. However, the model geometry highly impacts the CFD-based prediction of CSF flow. Enhanced images of the spinal CSF can be obtained with T2-weighted MRI, typically collected in 3-4 stations. Here we present a method to stitch spine images for CSF segmentation and compare it to the scanner’s stitching technique. Our offline approach appears more robust to movement and field-of-view adjustments while scanning and presents acceptable CSF signal intensity homogeneity across the spine for tissue segmentation.Introduction
Detailed imaging of the cerebrospinal fluid (CSF) and dynamics is of high importance not only to help understand diseases of the central nervous system (such as hydrocephalus [1]), but also for improving therapeutic interventions via intrathecal drug delivery [2]. One of the fields of interest in intrathecal drug delivery research is using computational fluid dynamics (CFD) to model the CSF flow [3], [4].To create appropriate CFD simulations, it is required to obtain an accurate geometric representation of anatomical features.Full spine high-resolution 3D T2-weighted MRI can be used for definition of the intricate spinal subarachnoid space geometry as it allows imaging with high definition of the intrathecal/CSF space in the spinal cord. Typically, the MR protocol is performed in different stations producing images of brain, cervical, thoracic, and lumbar parts with some vertebral overlap. Automatic image stitching to obtain the full spinal volume in a single image can be performed inline in most commercial scanner vendors but result in various degrees of fidelity. Offline stitching approaches have been proposed [5]–[7]. In this work we have explored methods for improved stitching of submillimeter 3D T2-weighted images of the spine, for the visualization and delineation of CSF geometry along the spine, and compared it with the scanner vendor’s stitching approach.
Materials and Methods
Two healthy subjects were scanned on a 3T MRI scanner (Signa PET-MR, GE Healthcare). The head and neck unit (HNU) coil and the spine array were used for signal receive, and the integrated body coil was used for signal transmit.A 3D sagittal FIESTA-C sequence (fast imaging employing stead-state acquisition with constructive interference) was acquired as it has been shown to have superior applicability for CSF imaging of the spine [8]. Sequence parameters were the following: FOV=300mm, acquisition resolution 0.9x0.9x1mm3, reconstructed resolution 0.59x0.59x0.5mm3, acceleration in-plane=2, phase-direction=A-P, 100 slices, BW=374Hz/px, TE/TR=2/5.1ms, Intensity correction=SCIC, 3 averages, TA~8 minutes per station. Four stations were acquired on each subject, covering the brain, the cervical, thoracic and lumbar spine regions, and a combination of the most appropriate channels available were used to receive signal for each station.
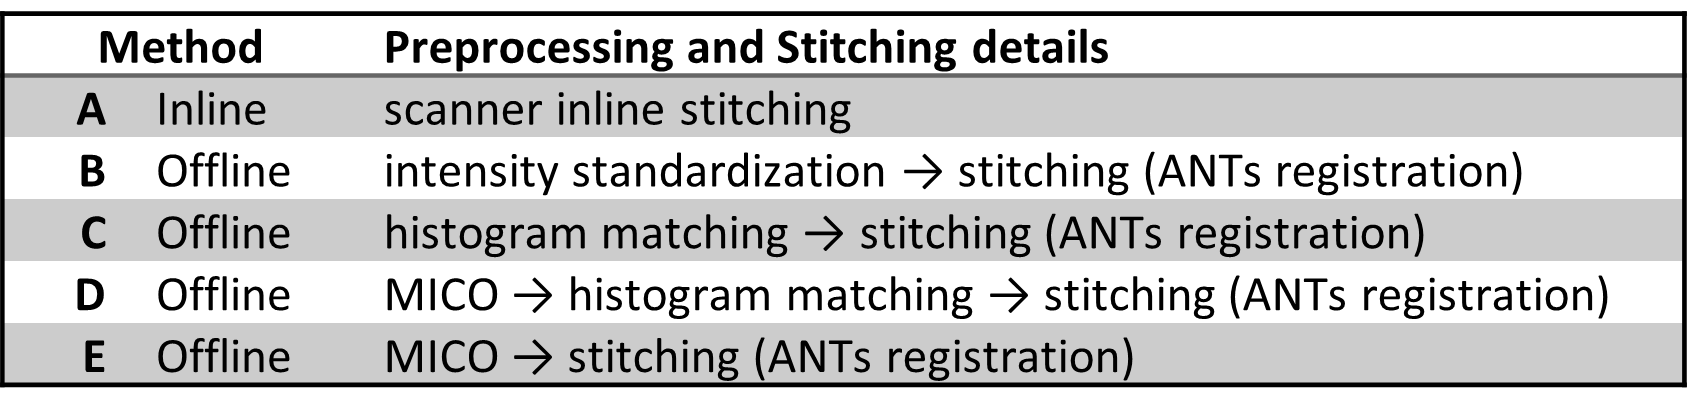
Stitching was performed inline on the scanner with the scanners’ Pasting option, and compared to offline implementations (Table 1). Offline preprocessing was implemented in a combination of python and MATLAB: intensity standardization using an inhouse-built code, histogram matching using the library intensity_normalization (nyul), and the multiplicative intrinsic component optimization algorithm, MICO [9], for bias field correction and segmentation. Stitching was performed according to the preferred method reported in [5] using a single modality. For the overlapping regions, a template was created using ANTs (http://stnava.github.io/ANTs/, model=SyN) and the registration matrices were then applied to the full station volumes. FSL FAST was used for CSF segmentation after stitching (number of classes=5) [10]. On Method E, the segmented tissue output from MICO was stitched using the corresponding stitching registration matrices.
Quantifiable analysis of stitching of the different methods is hampered by lack of the corresponding reference standard. A trained scientist (CR) reviewed the final images according to a classification system of five grades, where a high score (5) corresponds to optimal quality. Two categories were reviewed: 1) registration accuracy across stations and 2) intensity homogeneity across stations.
Results
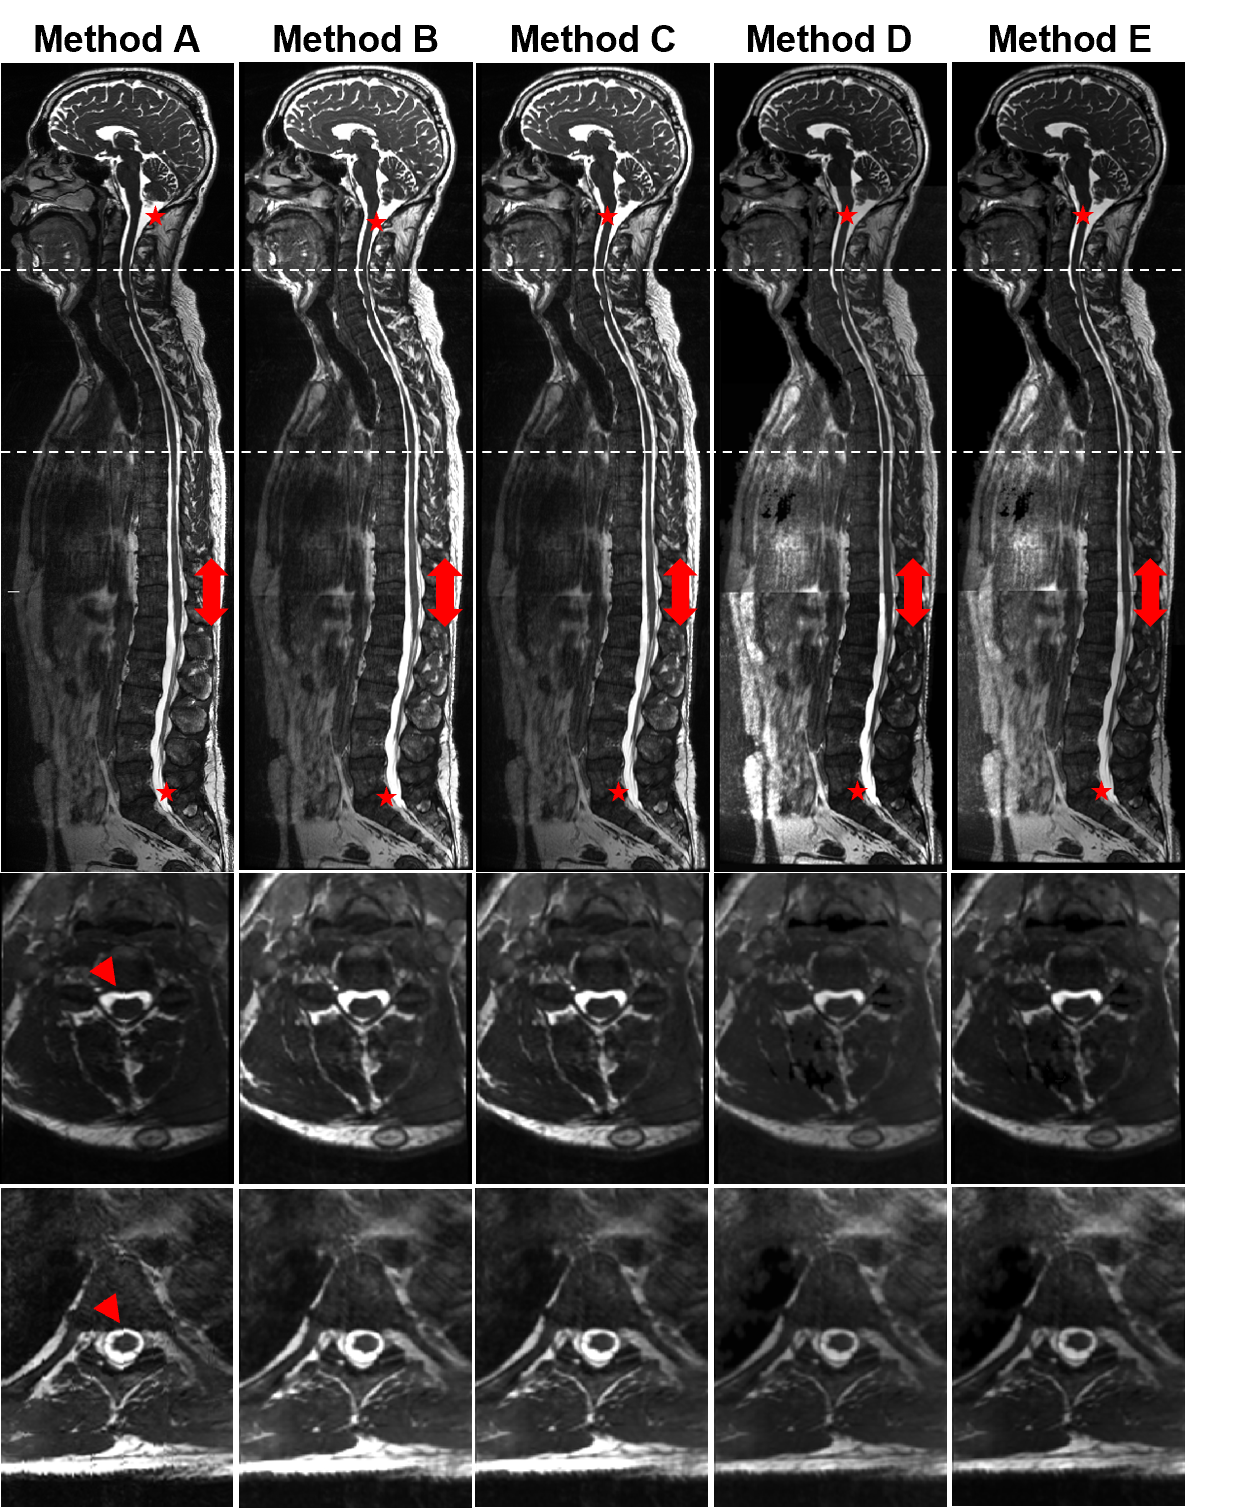
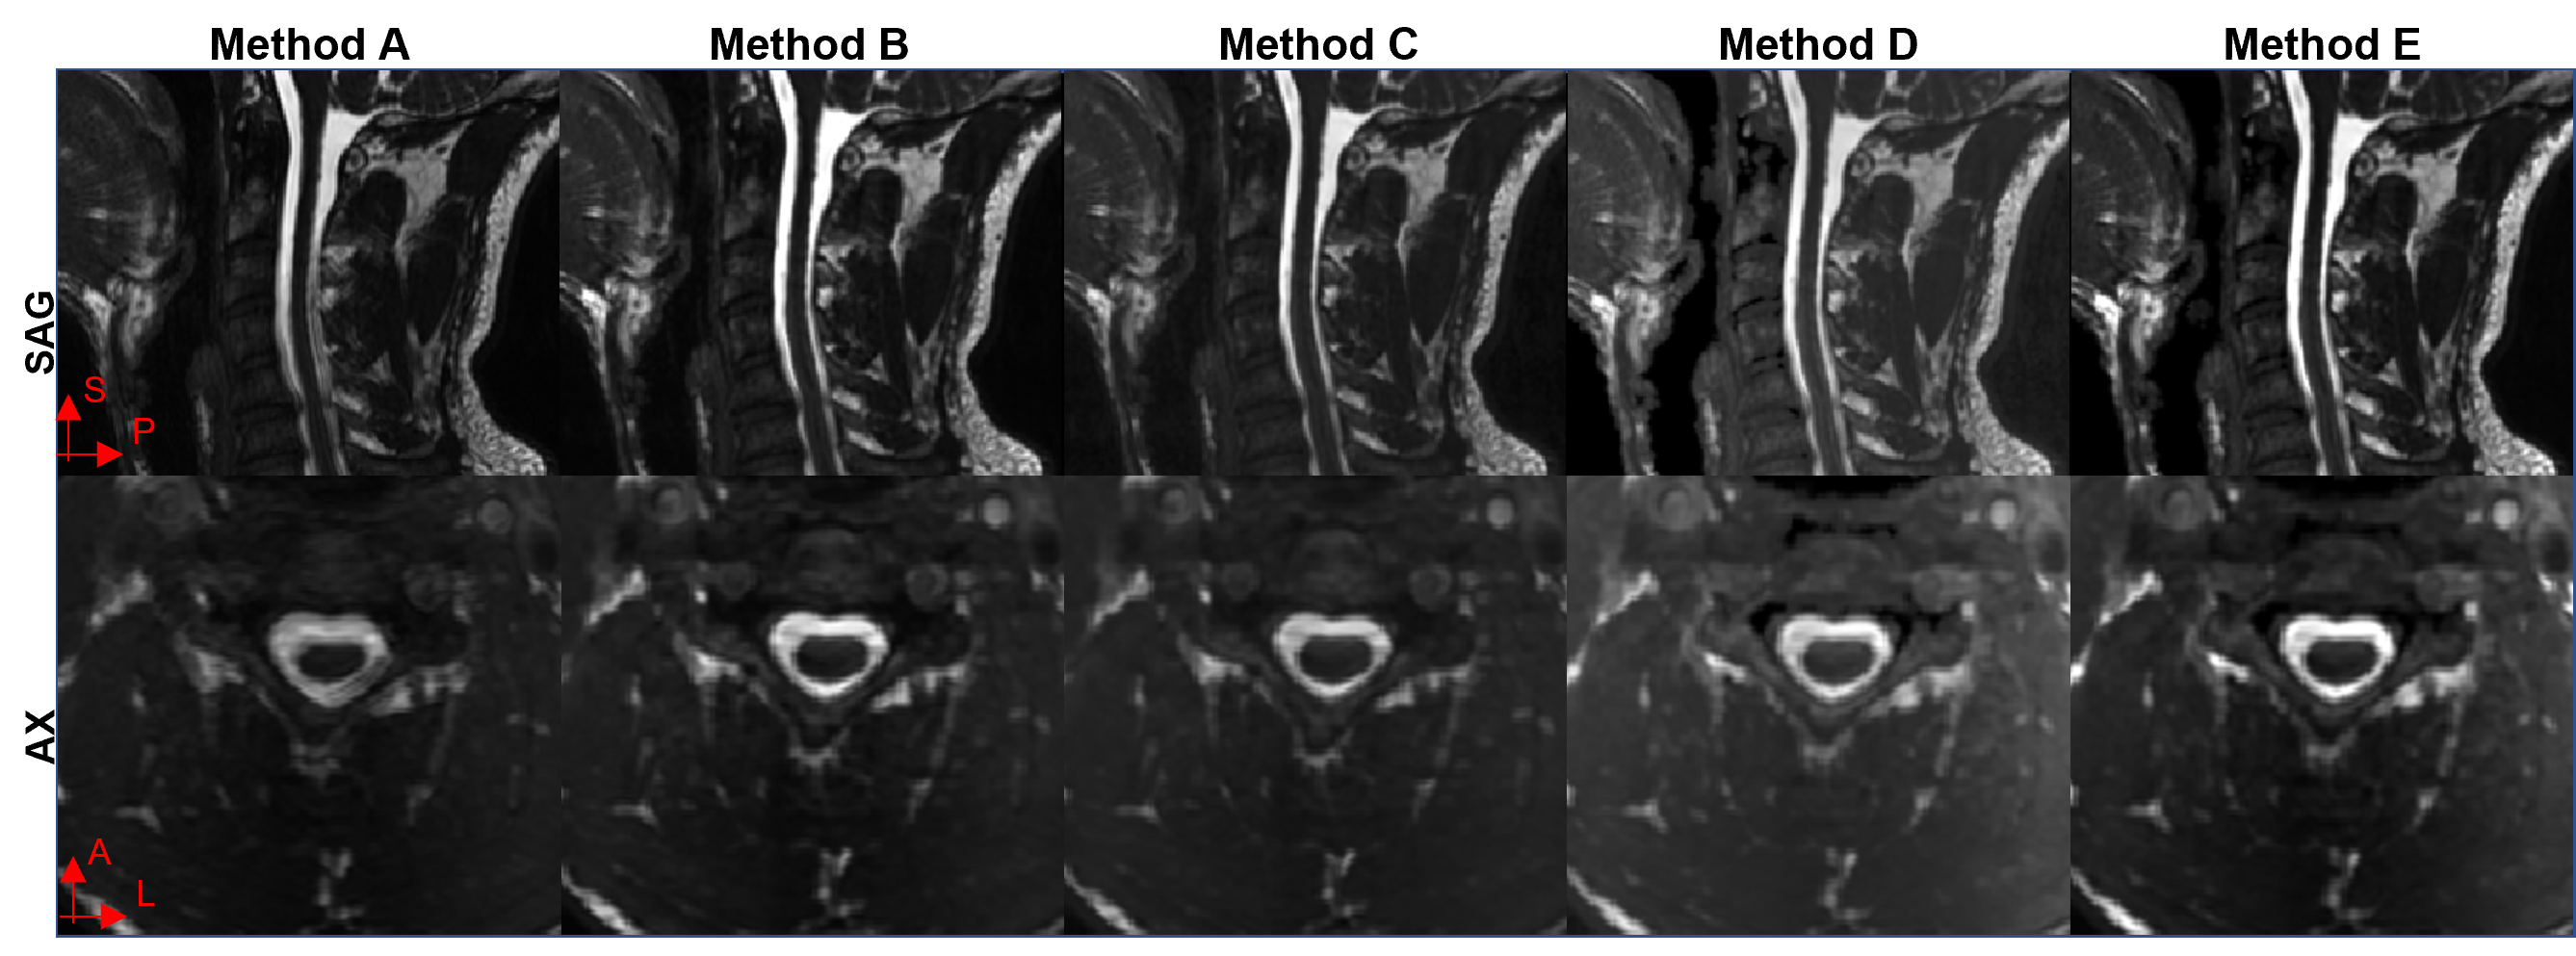
Figure 1 shows sagittal and axial views of Subject 1 stitched stations using all the methods tested and Table 2 shows the qualitative assessment of the stitched images for both subjects. Online stitching (Method A) lacked registration consistency on sagittal slices across stations when there is a field-of-view displacement (red arrowheads, Figure 1) and on the overlap regions when there is subject movement (Figure 2). Registering images offline with advanced registration tools (Methods B-D) improved the stitched image.CSF intensity homogeneity was classified as best in the inline stitching (Method A) followed by using offline MICO preprocessing before stitching (Method E). Other offline intensity homogeneity corrections tested (Method C, D and E) showed signal intensity changes across stations.
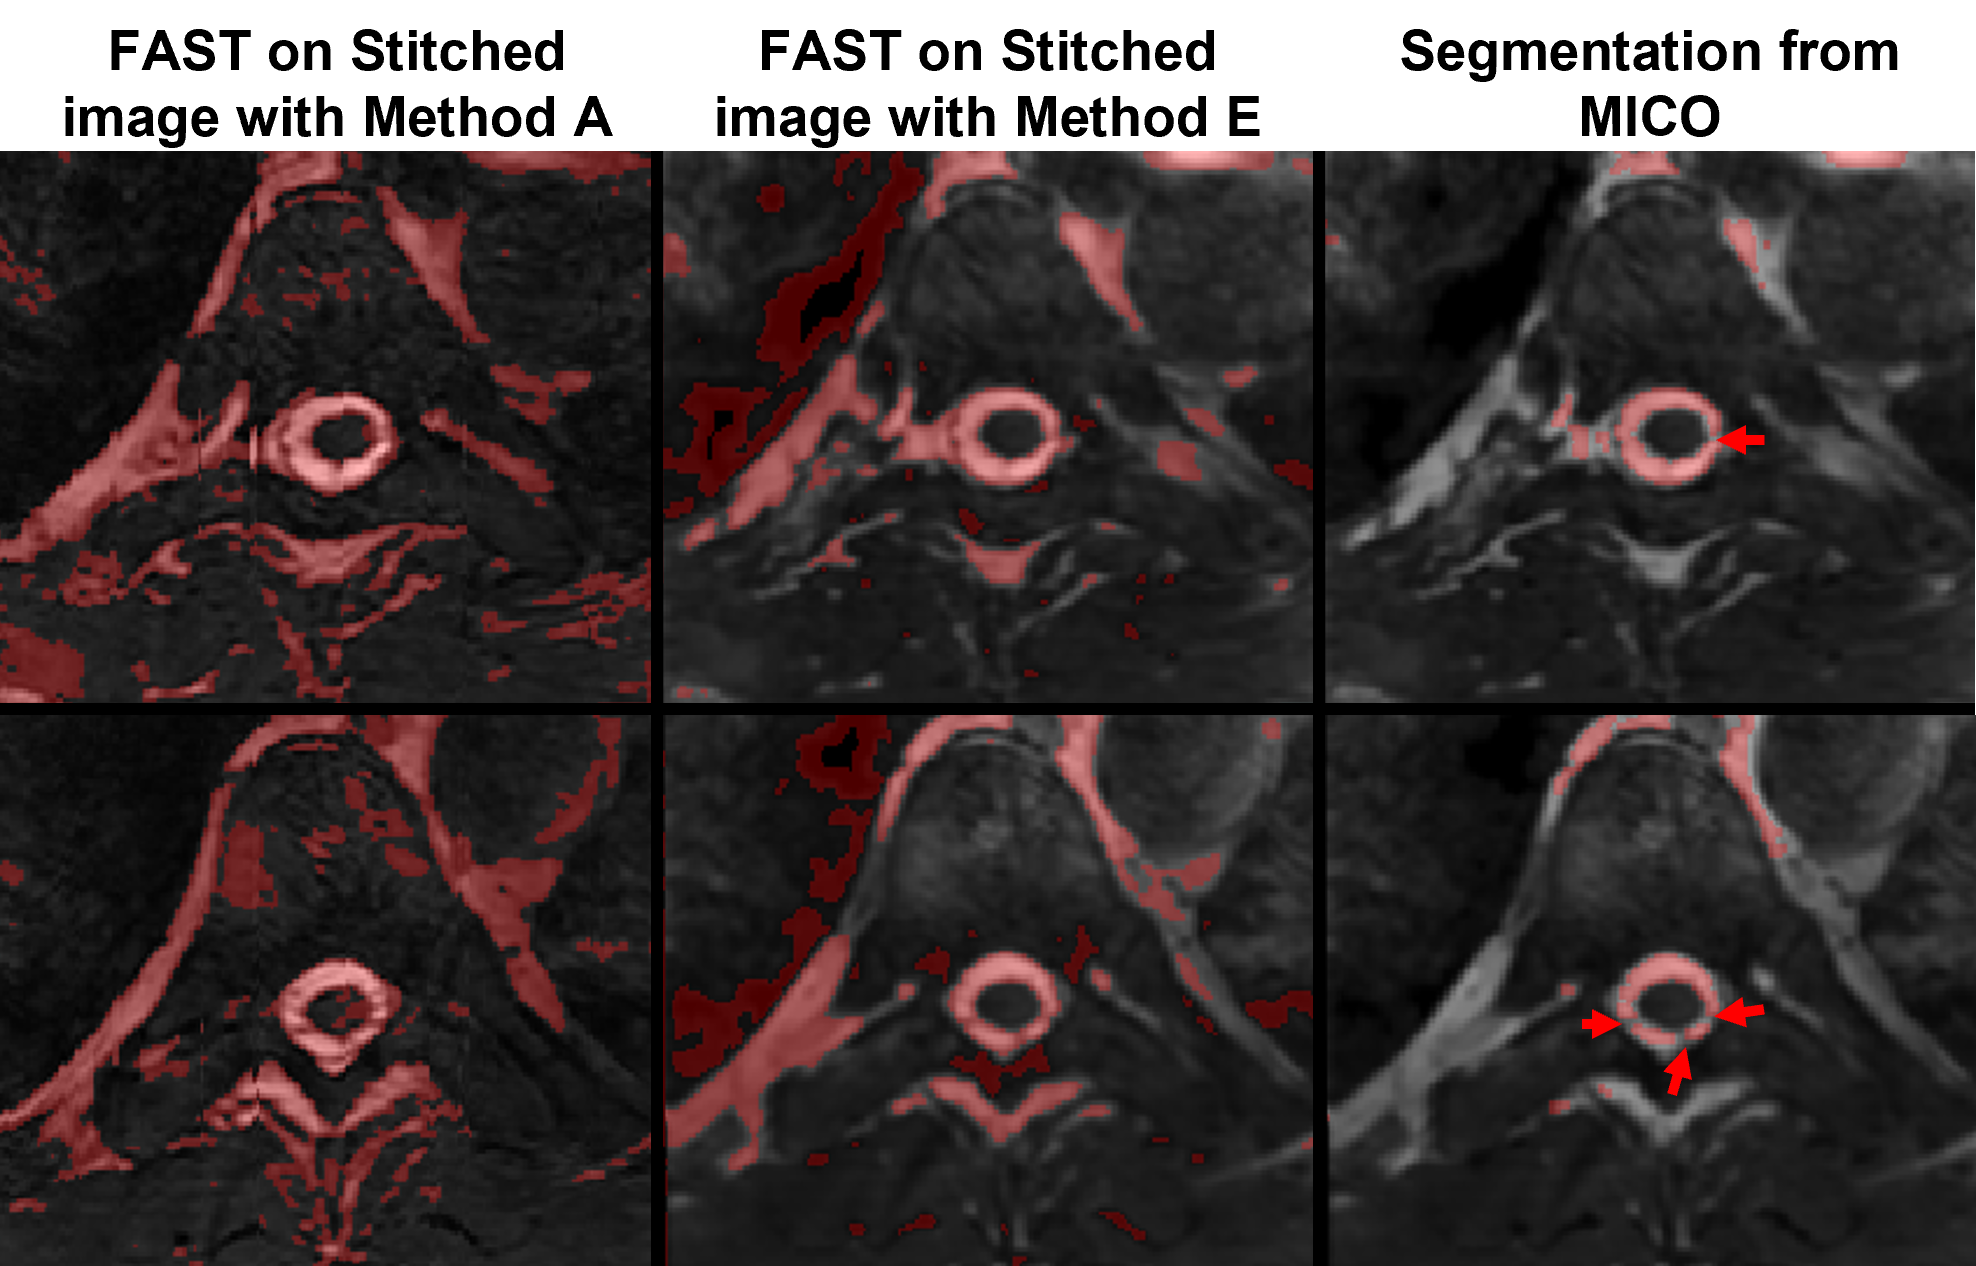
Figure 3 compares segmented CSF from method A, method E using FSL fast and the MICO CSF segmentation output from method E. The segmentation output from the online stitched images shows inconsistencies due to registration. Offline segmentation output from MICO improves segmentation of CSF-only tissue in the spine region, potentially identifying nerve rootlets (red arrowheads, Figure 3).
Discussion and Conclusions
In this work we have evaluated methods for offline stitching of MR images of the full spine to delineate the intrathecal space geometry. The FIESTA-C sequence showed clear CSF signal from the brain to the lumbar spine, will little flow signal inhomogeneities. Nonetheless, global signal inhomogeneity due to the use of different receive elements led to inhomogeneous CSF across stations. The scanner vendor’s stitching method revealed best results for receive inhomogeneity compensation, but lacked precision in registration across stations. Offline preprocessing with a 3D inhomogeneity correction followed by non-linear (affine and deformable) transformation for registration across stations was qualitatively the best method for stitching. In the future, it will be useful to test the post-stitched segmentation informed by the MICO tissue segmented output.Acknowledgements
No acknowledgement found.References
[1] C. Bradley, D. Scalzo, J. Queralt, W. N. Zotz, D. J. Atkinson, and P. Wong, “Normal-Pressure Hydrocephalus: evaluation with Cerebrospinal fluid flow measurements at MR Imaging,” Neuroradiology, vol. 198, pp. 523–529, 1996.
[2] M. I. Papisov, V. V. Belov, and K. S. Gannon, “Physiology of the intrathecal bolus: The leptomeningeal route for macromolecule and particle delivery to CNS,” Mol. Pharm., vol. 10, no. 5, pp. 1522–1532, 2013, doi: 10.1021/mp300474m.
[3] B. A. Martin et al., “Inter-operator Reliability of Magnetic Resonance Image-Based Computational Fluid Dynamics Prediction of Cerebrospinal Fluid Motion in the Cervical Spine,” Ann. Biomed. Eng., vol. 44, no. 5, pp. 1524–1537, 2016, doi: 10.1007/s10439-015-1449-6.
[4] L. R. Sass, M. Khani, G. C. Natividad, R. S. Tubbs, O. Baledent, and B. A. Martin, “A 3D subject-specific model of the spinal subarachnoid space with anatomically realistic ventral and dorsal spinal cord nerve rootlets,” Fluids Barriers CNS, vol. 14, no. 1, pp. 1–16, 2017, doi: 10.1186/s12987-017-0085-y.
[5] J. Ceranka, M. Polfliet, F. Lecouvet, N. Michoux, J. de Mey, and J. Vandemeulebroucke, “Registration strategies for multi-modal whole-body MRI mosaicing,” Magn. Reson. Med., vol. 79, no. 3, pp. 1684–1695, 2018, doi: 10.1002/mrm.26787.
[6] B. Baheti, U. Baid, and S. N. Talbar, “A novel approach for Automatic Image Stitching of spinal cord MRI images using SIFT,” 2015 Int. Conf. Pervasive Comput. Adv. Commun. Technol. Appl. Soc. ICPC 2015, vol. 00, no. c, 2015, doi: 10.1109/PERVASIVE.2015.7087071.
[7] O. Dzyubachyk, B. P. F. Lelieveldt, J. Blaas, M. Reijnierse, A. Webb, and R. J. Van Der Geest, “Automated algorithm for reconstruction of the complete spine from multistation 7T MR data,” Magn. Reson. Med., vol. 69, no. 6, pp. 1777–1786, 2013, doi: 10.1002/mrm.24404.
[8] Z. Li, Y. A. Chen, D. Chow, J. Talbott, C. Glastonbury, and V. Shah, “Practical applications of CISS MRI in spine imaging,” Eur. J. Radiol. Open, vol. 6, no. June, pp. 231–242, 2019, doi: 10.1016/j.ejro.2019.06.001.
[9] C. Li, J. C. Gore, and C. Davatzikos, “Multiplicative intrinsic component optimization (MICO) for MRI bias field estimation and tissue segmentation,” Magn. Reson. Imaging, vol. 32, no. 7, pp. 913–923, 2014, doi: 10.1016/j.mri.2014.03.010.
[10] Y. Zhang, M. Brady, and S. Smith, “Segmentation of brain MR images through a hidden Markov random field model and the expectation-maximization algorithm,” IEEE Trans. Med. Imaging, vol. 20, no. 1, pp. 45–57, 2001, doi: 10.1109/42.906424.
Figures