3769
Enhancing Vessel Continuity in Deep Learning based Segmentation using Maximum Intensity Projection as Loss1Faculty of Computer Science, Otto von Guericke University Magdeburg, Magdeburg, Germany, 2Data and Knowledge Engineering Group, Otto von Guericke University Magdeburg, Magdeburg, Germany, 3Department of Biomedical Magnetic Resonance, Otto von Guericke University Magdeburg, Magdeburg, Germany, 4German Center for Neurodegenerative Disease, Magdeburg, Germany, 5Center for Behavioral Brain Sciences, Magdeburg, Germany
Synopsis
Keywords: Segmentation, Blood vessels
Vessel Segmentation with deep learning is a challenging task that involves not only learning high-level feature representations but also the spatial continuity of the features across dimensions. Semi-supervised patch-based approaches have been effective in identifying small vessels of 1-2 voxels in diameter but failed to maintain vessel continuity. This study focuses on improving the segmentation quality by considering the spatial correlation of the features using the maximum intensity projection (MIP) as an additional loss criterion. It was observed that the proposed method quantitatively improves the segmentation while also improving vessel continuity, as evident in the visual examinations of ROIs.Introduction
Limited amount of high-quality data and time-consuming annotations make vessel segmentation one of the most challenging tasks in the field. Deep learning methods, especially semi-supervised, have been proposed to learn high-level feature representations of vessels from limited annotations1,2. Though past research1 successfully segmented vessels as small as 1-2 voxels in diameter, it does not always produce segmentations that preserve the continuity of the vessels. This study focuses on improving vessel continuity by considering the spatial correlation of pixels across dimensions. Maximum Intensity projection (MIP) is one of the techniques used to visualise vessel continuity. It is the projection of a 3D voxel onto a 2D image by considering the highest attenuation value on each view and has been shown to be utilised for pathology detection3,4. Studies have also shown that the MIPs can be instrumental in pulmonary nodule detection and qualitative analysis of intracranial vascularity5,6. It has also been shown that MIPs can aid in cerebrovascular segmentation7. Hence, this research attempts to improve vessel connectivity in deep learning-based vessel segmentation. The proposed approach uses the MIP of 3D MRA volumes as additional prior knowledge for the network. The authors hypothesise that this can improve the perception of vessel continuity by the network.Methods
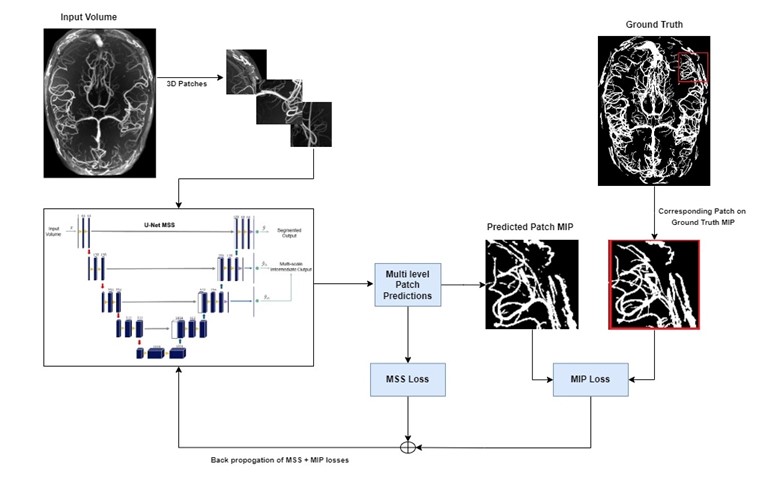
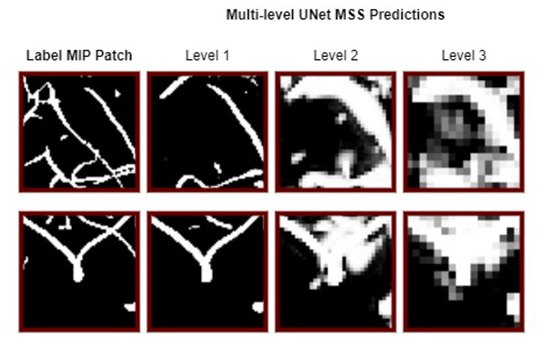
The previous study1 demonstrated the suitability of UNet-based architectures for vessel segmentations - using UNet8 and modified UNet-MSS architecture. The patch-based training pipeline of that previous work was enhanced here in this research by introducing the MIP comparisons, as shown in Fig.1. In this proposed approach, foremost, the MIPs of the predictions for each patch at each level of UNet-MSS is computed. The predicted patch MIPs are then compared against their corresponding patches on the respective label MIPs to evaluate the MIP loss as shown in Eq.4, and an example is given in Fig.2. In addition to the Multi-Scale Supervision (MSS) Loss, the spatial continuity of the vessels is incorporated into the learning in the form of MIP Loss. Eq.1 represents the total loss which is a weighted sum of the MSS loss and the MIP Loss with weight parameter μ and network parameter θ. Eq.2 represents the MSS loss where m refers to the total up-sampling scales, αi is the weight assigned to loss at a specific up-sampling level. Eq.3 represents the MIP loss that is calculated by comparing the axial MIP of the predicted segmentation of the patch ŷ against the subset of the axial MIP of the label segmentation encompassing the patch. Focal Tversky loss is used as the loss function for calculating all losses.Eq.1. $\operatorname{Loss}(\theta)=\mu L_{M S S}(\theta)+(1-\mu) L_{M I P}(\theta)$
Eq.2. $L_{M S S}(\theta)=\frac{1}{\sum_{i=1}^m \alpha_i} \sum_{i=1}^m \alpha_i l_{\text {scale }}^i(\theta)$
Eq.3. $L_{M I P}(\theta)=\frac{1}{\sum_{i=1}^m \alpha_i} \sum_{i=1}^m \alpha_i \operatorname{lmip}_{\text {scale }}^i(\theta)$
Eq.4. $\operatorname{lmip}(\theta)=\operatorname{loss}(M I P(\hat{y}), y \subseteq M I P(Y))$
Evaluations were performed on 18 volumes from the 7T TOF-MRA volumes from the StudyForrest dataset (studyforrest.org)9. The volumes were then divided into a training and validation sets of 10 and 4. The remaining 4 volumes were used to evaluate the generalisation performance of the learned network. Training and Validation sets were annotated semi-automatically using Ilastik, and they were noisy. In contrast, the test set was manually annotated with expert supervision.
Results
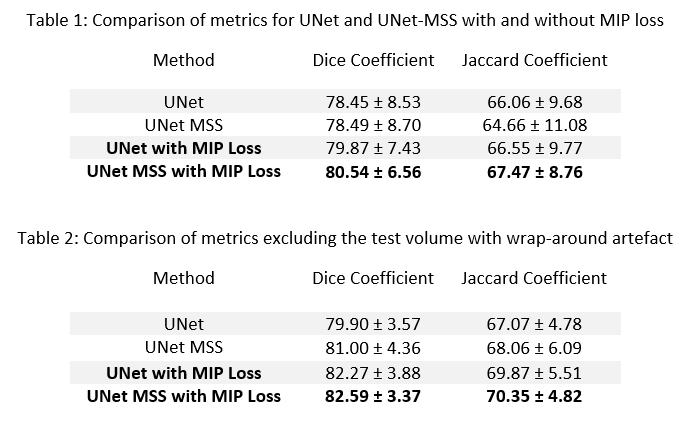
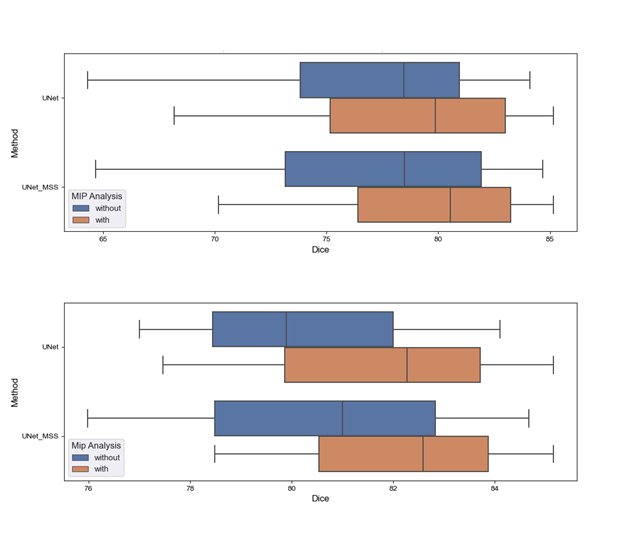
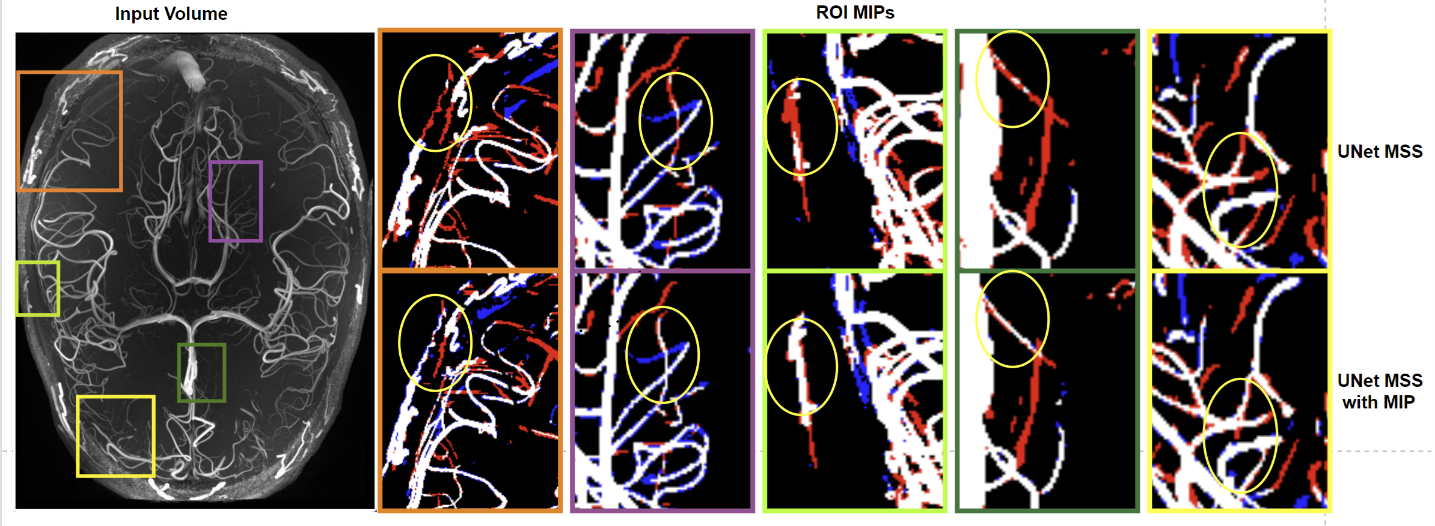
It was observed that the network trained with the proposed MIP Loss produces segmentations with a Dice score of 80.54 ± 6.56 (Table 1 and Fig.3) and improved vessel continuity, as can be seen in Fig. 4. It is evident from the experimental results in Table 1 that the proposed approach improves the performance of both UNet and UNet MSS. Furthermore, the test set was filtered to remove one volume containing wrap-around artefact. Table 2 shows the scores on this filtered test set, also revealing a clear improvement with the proposed MIP loss.Discussion
The UNet and UNet-MSS were considered as baselines for evaluating the performance of the proposed approach. It was observed both quantitatively and qualitatively that both models benefit from the proposed MIP loss. Between UNet and UNet-MSS, the latter performed better - both with and without the MIP loss. Overall, UNet-MSS with MIP loss came out as the overall winner in these experiments. Fig.4 clearly shows that this model improved the vessel connectivity in comparison to the UNet-MSS without the MIP loss - in support of the hypothesis of the authors. Additionally, one additional finding was the additional parameter in Eq.1 μ that was learnt during training. It was initialised with 0.7, and the final learnt value was 0.68. This shows that the MSS-loss needs more weightage than the MIP-loss. Finally, it was also revealed from several additional experiments that LeakyReLU activation produces better segmentations.Conclusion
This research proposed the method of MIP-based loss that is to be used with ordinary loss function for the task of vessel segmentation from 7T TOF-MRAs. Two models, UNet and UNet-MSS, were experimented with, and in both cases, the models with the MIP loss outperformed the baselines. The generated segmentations not only show improvement quantitatively but also in the continuity of the vessels. In future work, the authors propose the exploration of volumetric MIP comparisons replacing the patch-based comparisons and also MIP loss computed in all three orientations.Acknowledgements
This work was in part conducted within the context of the International Graduate School MEMoRIAL at Otto von Guericke University (OVGU) Magdeburg, Germany, kindly supported by the European Structural and Investment Funds (ESF) under the programme ”Sachsen-Anhalt WISSENSCHAFT Internationalisierung” (project no. ZS/2016/08/80646).References
[1] Chatterjee, S., Prabhu, K., Pattadkal, M., Bortsova, G., Sarasaen, C., Dubost, F., ... & Nürnberger, A. (2022). Ds6, deformation-aware semi-supervised learning: Application to small vessel segmentation with noisy training data. Journal of Imaging, 8(10), 259.
[2] Xie, L., Chen, Z., Sheng, X., Zeng, Q., Huang, J., Wen, C., ... & Feng, Y. (2022). Semi-supervised region-connectivity-based cerebrovascular segmentation for time-of-flight magnetic resonance angiography image. Computers in Biology and Medicine, 149, 105972.
[3] Adachi, M.; Fujioka, T.; Mori, M.; Kubota, K.; Kikuchi, Y.; Xiaotong, W.; Oyama, J.; Kimura, K.; Oda, G.; Nakagawa, T.; Uetake, H.; Tateishi, U. Detection and Diagnosis of Breast Cancer Using Artificial Intelligence Based Assessment of Maximum Intensity Projection Dynamic Contrast-Enhanced Magnetic Resonance Images. Diagnostics 2020, 10, 330. https://doi.org/10.3390/diagnostics10050330
[4] Qiyuan Hu, Heather M. Whitney, Hui Li, Yu Ji, Peifang Liu, and Maryellen L. Giger. Improved Classification of Benign and Malignant Breast Lesions Using Deep Feature Maximum Intensity Projection MRI in Breast Cancer Diagnosis Using Dynamic Contrast-enhanced MRI. Radiology: Artificial IntelligenceVol. 3, No. 3. https://doi.org/10.1148/ryai.2021200159
[5] Sunyi Zheng, Xiaonan Cui, Marleen Vonder, Raymond N.J. Veldhuis, Zhaoxiang Ye, Rozemarijn Vliegenthart, Matthijs Oudkerk, Peter M.A. van Ooijen. Deep learning-based pulmonary nodule detection: Effect of slab thickness in maximum intensity projections at the nodule candidate detection stage. Computer Methods and Programs in Biomedicine. Volume 196, 2020. https://doi.org/10.1016/j.cmpb.2020.105620.
[6] Ruoyao Cao, BM., Yun Jiang, MD., Jun Lu, MD., Guogeng Wu, MD., Lei Zhang, BM., Juan Chen, PhD, MD. Evaluation of Intracranial Vascular Status in Patients with Acute Ischemic Stroke by Time Maximum Intensity Projection CT Angiography: A Preliminary Study. 2019. https://doi.org/10.1016/j.acra.2019.06.013.
[7] Rui Gan, Wilbur C.K Wong, Albert C.S Chung, Simon C.H Yu. Statistical cerebrovascular segmentation in three-dimensional rotational angiography based on maximum intensity projections. International Congress Series, Volume 1268, 2004. https://doi.org/10.1016/j.ics.2004.03.269.
[8] Ronneberger, O., Fischer, P., & Brox, T. (2015). U-Net: Convolutional Networks for Biomedical Image Segmentation. http://arxiv.org/abs/1505.04597
[9] Hanke M, Baumgartner FJ, Ibe P, Kaule FR, Pollmann S, Speck O, et al. A high-resolution 7-Tesla fMRI dataset from complex natural stimulation with an audio movie. Sci Data. 2014; pmid:25977761
Figures