3766
The effectiveness of the volume transfer constant (Ktrans) as an aid to regional segmentation of nasopharyngeal tumors1Paul C. Lauterbur Research Center for Biomedical Imaging, Shenzhen Institute of Advanced Technology, Chinese Academy of Sciences, ShenZhen, China, 2Faculty of Information Engineering and Automation, Kunming University of Science and Technology, Kunming, China, 3Department of Radiology, National Cancer Center/National Clinical Research Center for Cancer/Cancer Hospital & Shenzhen Hospital, Chinese Academy of Medical Sciences and Peking Union Medical College, Shenzhen, China, 4Paul C. Lauterbur Research Center for Biomedical Imaging, Shenzhen Institute of Advanced Technology, Chinese Academy of Sciences, Shenzhen, China
Synopsis
Keywords: Segmentation, Machine Learning/Artificial Intelligence
Accurate segmentation of nasopharyngeal tumor lesions from dynamic contrast-enhanced magnetic resonance imaging (DCE-MRI) facilitates subsequent diagnosis and treatment. However, current segmentation methods do not incorporate the pathological properties of the tumor. Therefore, this paper proposes a multimodal DCE-MRI segmentation method that uses the pharmacokinetic features of NPC, Ktrans, as modal information to assist nasopharyngeal tumor segmentation. We validated our method in several classical deep learning segmentation networks, and DCE-MRI with fused Ktrans eigenmodes had higher Dice coefficients than DCE-MRI with a single modality. The best segmentation results were obtained by this method on the ResUNet model (dice=74.39).
INTRODUCTION
Nasopharyngeal carcinoma (NPC) is an epithelial cancer originating from the inner mucosa of the nasopharynx 1, which is most commonly seen in men and has a high incidence mainly in southern China, Southeast Asia and North Africa. Patients with early detection and diagnosis of NPC disease have a higher 10-year survival rate, while the median survival of patients with advanced disease is only 3 years 2. Therefore, correct diagnosis plays a crucial role in reducing mortality from NPC. Dynamic contrast-enhanced magnetic resonance imaging (DCE-MRI) is a functional noninvasive imaging modality. Researchers can obtain information about the physiological characteristics of tissue from DCE-MRI for tumor diagnosis. Among the features extracted from DCE-MRI using pharmacokinetics are the volume transfer constant (Ktrans). As the blood vessels in the NPC region are rapidly generated, the vessel walls are weaker and more permeable, allowing for significantly faster diffusion of contrast from the interior of the new vessels into the tissue interstitium. Ktrans represents the process of contrast transfer from the vessels to the tissue interstitium, i.e., contrast uptake. The description of the Ktrans characteristics shows that there is a difference between Ktrans in tumor areas and Ktrans in nontumor areas. Therefore, this study explores the use of Ktrans as modal information to assist in the segmentation of nasopharyngeal tumors.METHODS
This prospective study acquired DCE-MRI data from 96 patients on a Siemens 3.0T MRI instrument. Thirty-five phases of DCE-MRI were acquired for each patient. The time-signal intensity curve (TIC) for each patient was drawn from the 35-phase data. The TIC was then converted to a tissue contrast concentration transformation curve according to equation (1.1) 3 and equation (1.2) 4.$${{S{I_{post}}(t)} \over {S{I_{pre}}}} = {{1 - {e^{ - {{TR} \over {{T_{1post(t)}}}}}}} \over {1 - {e^{ - {{TR} \over {{T_{1pre}}}}}}}}, (1.1)$$
$${1 \over {{T_{1post(t)}}}} = {1 \over {{T_{1pre}}}} + {r_1}{C_t}, (1.2)$$
where SIpre is the initial signal intensity, SIpost(t) is the signal intensity over time, T1pre is the relaxation time of the initial trial, T1post(t) is the relaxation time over time and TR is the repetition time (msec). Ct is the tissue contrast concentration, and r1 (mM-1s-1) is the longitudinal contrast agent relaxation factor, which depends on the temperature, field strength and chemical structure of the contrast agent. In this study, the extended Tofts and Kermode (ETK) model was used to fit tissue contrast concentration profiles and to derive point-by-point Ktrans values for DCE-MRI. The calculation formula is shown in equation (1.3).
$${C_t}(t) = {v_p}{C_p}(t) + {K_{{\mathop{\rm t}\nolimits} rans}}\int_0^t {{C_p}(t')} {e^{ - (({K_{trans}}/{v_e})(t - t'))}}dt', (1.3)$$
where vp is the fractional plasma volume per unit of tissue volume and ve is the extravascular space volume. Contrast agent concentration Cp(t) in plasma was obtained using a population-based arterial input function (AIF). The Ktrans map obtained according to the above equation is shown in Figure 1.
We used the obtained Ktrans maps together with the DCE-MRI of the sixth phase as input to the model. The ratio of the training set, validation set and test set is approximately 8:1:1. The Dice, Hausdorff distance (HD) and average symmetric surface distance (ASSD) were used as evaluation indicators.
RESULTS
Table I shows the test results for single modality (DCE-MRI) and multimodality (DCE-MRI+Ktrans) under different models. Comparing the results of Dice, the comparison of multimodal and single modalities on the 5 typical segmentation models were CENet (63.17 vs 60.34), R2UNet (68.25 vs 67.84), ResUNet (74.39 vs 68.95), SegNet (66.44 vs 66.50) and UNet (69.64 vs 68.76). Comparing the results of HD, the comparison of multimodal and single modalities on five typical segmentation models were CENet (131.36 vs 146.68), R2UNet (129.50 vs 130.86), ResUNet (129.49 vs 129.49), SegNet (130.24 vs 148.25) and UNet (133.75 vs 131.80). Comparing the results of ASSD, the comparison of multimodal and single modalities on the five typical segmentation models were CENet (37.16 vs 33.16), R2UNet (37.86 vs 27.07), ResUNet (37.86 vs 37.86), SegNet (38.13 vs 53.26) and UNet (32.58 vs 34.55). The segmentation results for each method are shown in Figure 2.DISCUSSION
As seen in Table I, it is possible to improve segmentation using a multimodal approach, with the greatest increase in dice values in ResUNet, where dice improved by 5.44%. With the exception of SegNet, the dice of all the models have been improved. As dice responds to the overall segmentation effect, it indicates that the Ktrans map can provide more information on the overall shape of the tumor. HD and ASSD respond to the effect of edge segmentation of the tumor. The HD and ASSD results show that multimodality is not overly helpful in improving the edge segmentation of the model, but it is helpful in keeping the edge segmentation results stable. The mean ± standard deviation of HD and ASSD for multimodal and single modality were HD (130.87±1.59 vs 137.45±8.25) and ASSD (36.72±2.09 vs 37.27±8.73).CONCLUSION
Our experiments show that the pharmacokinetic feature Ktrans is effective in aiding deep learning models to segment tumor regions; Ktrans provides more information about the tumor shape, making the overall segmentation results more accurate and the edge segmentation more stable.Acknowledgements
No acknowledgement found.References
[1] Chang E T, Adami H O. The enigmatic epidemiology of nasopharyngeal carcinoma. Cancer Epidemiology Biomarkers & Prevention, 2006, 15(10): 1765-1777.
[2] Wu L, Li C, Pan L. Nasopharyngeal carcinoma: A review of current updates. Experimental and therapeutic medicine, 2018, 15(4): 3687-3692.
[3] Daldrup H, Shames D M, Wendland M, et al. Correlation of dynamic contrast-enhanced MR imaging with histologic tumor grade: comparison of macromolecular and small-molecular contrast media. AJR. American journal of roentgenology, 1998, 171(4): 941-949.
[4] Khalifa F, Soliman A, El‐Baz A, et al. Models and methods for analyzing DCE‐MRI: A review. Medical physics, 2014, 41(12): 124301.
Figures
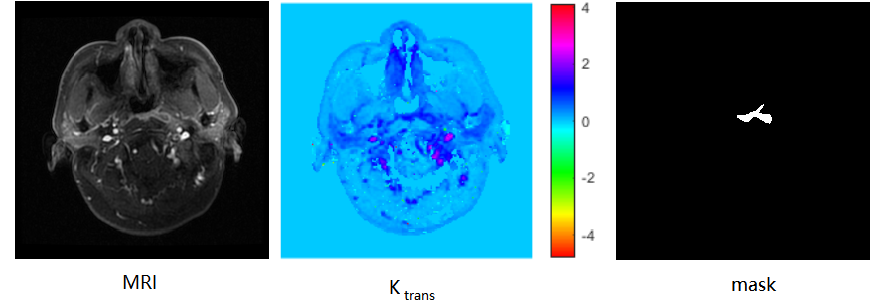
Figure 1 shows the Ktrans map and the MRI and mask corresponding to the Ktrans map
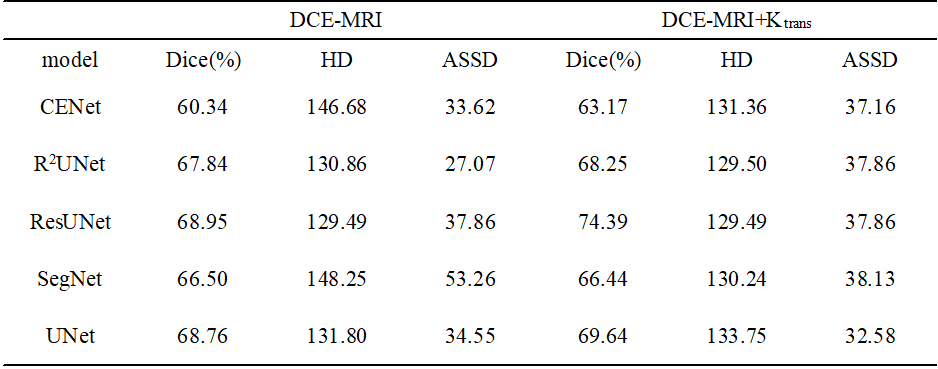
Table 1 Segmentation results for single modality and multimodal in different models
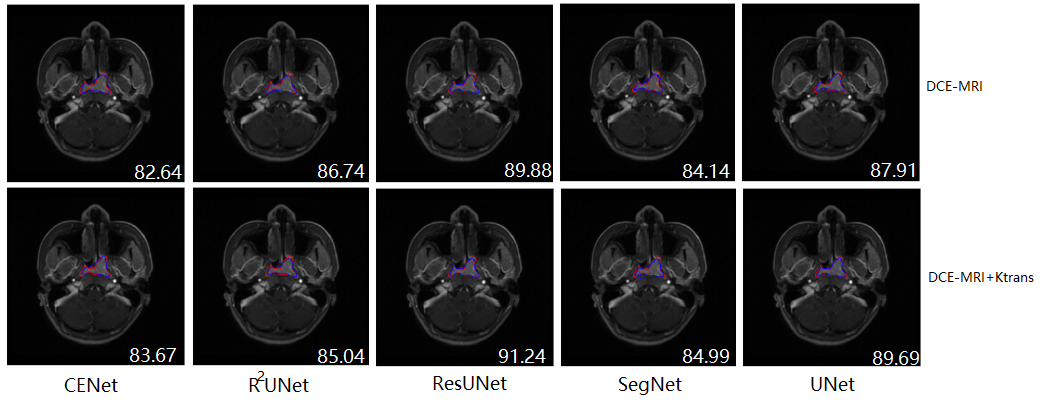
Figure 2 Segmentation results for unimodal and multimodal models