3758
In vivo T1-mapping template of the mouse brain at 4.7T and 7T with a MP2RAGE sequence1CNRS, CRMSB, Bordeaux, France, 2CNRS, GIN IMN, Bordeaux, France
Synopsis
Keywords: Data Analysis, Animals, brain parcellation
3D T1 templates of the mouse brain at 7T and 4.7T were created with a MP2RAGE pulse sequence. The template was next coregistered with the DORR atlas. The resulting parcellation allows volume and T1 measurements for each labels. The values obtained can be compared according to the magnetic field, intra and inter individual. Volumes were found in agreement with the literature. The T1 measurements are reproducible between individuals and significantly different at 4.7T and 7T.INTRODUCTION
Quantitative biomarkers are more often used for diagnostic, prognostic, and predictive purposes. In magnetic resonance imaging (MRI), one of the most intrinsic biomarkers is tissue relaxation times. For instance, the longitudinal relaxation time T1 has great value in various applications, for human or small animal preclinical imaging. However, in mice models, obtaining 3D T1 maps of the brain is not trivial. Indeed, this can lead to extremely long acquisition times for high spatial resolutions. Nevertheless, we have recently shown that the MP2RAGE sequence can be used to characterize the whole mouse brain in acceptable acquisition times. The method can even be accelerated with the Compressed Sensing technique1. However, the accuracy, robustness and reproducibility of the MP2RAGE method for T1 quantification in different areas of the mouse brain has never been studied in detail. The aim of our study was therefore to create two 3D T1 templates of the mouse brain at 7T and 4.7T and to compare the values obtained according to the magnetic field, intra and inter individual.METHODS
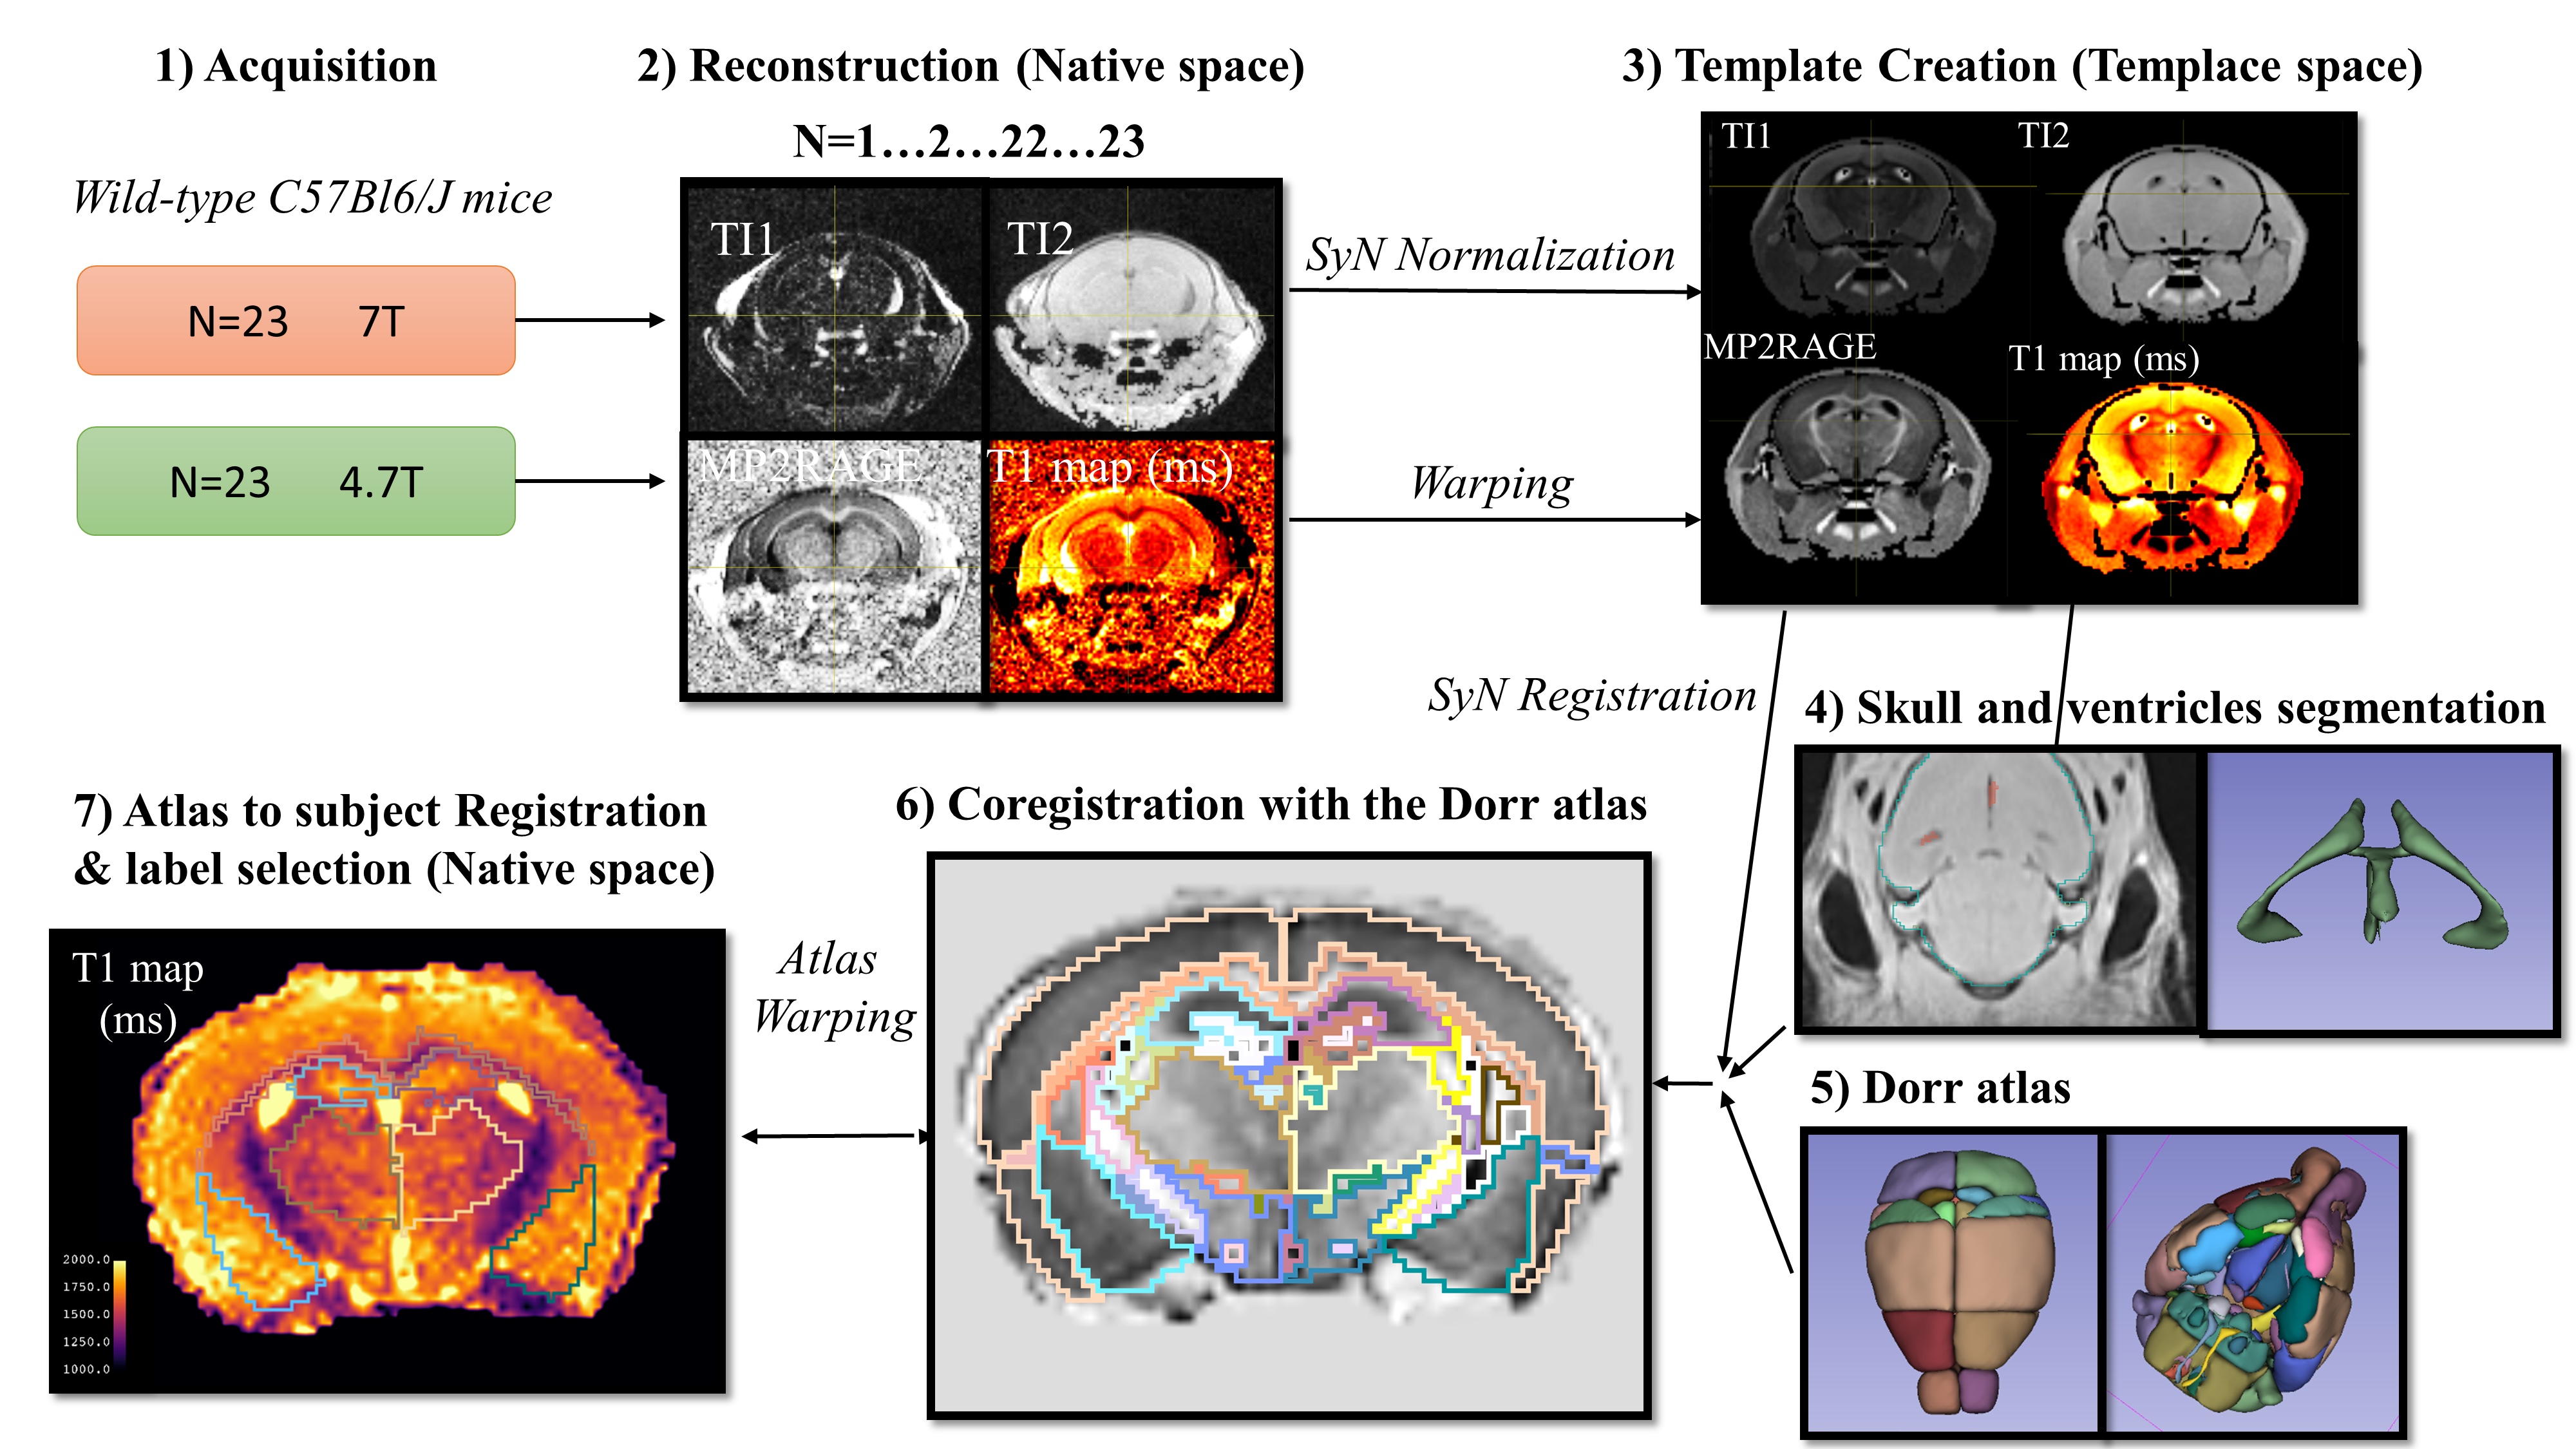
MRI acquisition: An in vivo mouse brain template was created from 23 wild-type C57Bl6/J mice (23 females) ranging from 12 to 22 weeks of age at 4.7T and 7T. Experiments were performed on Bruker BioSpec systems (Ettlingen, Germany) equipped with a volume resonator (75.4 mm inner diameter, active length 70 mm) for excitation, and a 4‐element phased array surface reception coil (outer dimensions 26 ×21 mm2). Mice were anesthetized with isoflurane (1.5‐2% in air) and positioned with the brain at the center of the NMR coil. Animal breathing and temperature were monitored during the scanning session (SA Instruments, Stony Brook, NY) and maintained at 60-90 resp/min and 37°C +/- 0.8. The MP2RAGE parameters were as follows. TI1/TI2/MP2RAGE TR = 800 ms/2200 ms/6250 ms; flip angle = 7°; TE = 2.1ms, FOV = 20 × 20 × 15 mm; Matrix = 128 x 128 x 96; spatial resolution = 156 μm isotropic. Number of Averages/Total acquisition time = 5/50 min at 7T and 8/80 min at 4.7T.Sequence and reconstruction processing are available at : https://github.com/aTrotier/SEQ_BRUKER_A_MP2RAGE_CS_PUBLIC
Template generation: Template generation2, from coarse resolution to the final resolution, was performed iteratively with 4 levels of resolution (1 mm, 0.6 mm, 0.3 mm, 0.15 mm) using echo 1 (TI1) and echo 2 (TI2) after N4 bias correction3 and brainmask generation using intensity based thresholding. MP2RAGE and T1 maps were then warped to template space and averaged.
Parcellation: The template was coregistered with the Dorr atlas4 . Skulls and ventricles were manually delineated to guide the registration. Atlas was then mapped from atlas space to individual subjects’ space (also referred as native space) on each individual echo and T1 map using the set of forward (or inverse) transformations. The resulting parcellations were displayed in 3DSlicer for all labels. Mean volume ± standard deviation (mm3) and mean T1 ± standard deviation (ms) were computed for each label. (Figure 1). Figures were generated with MRtrix and 3DSlicer.
RESULTS
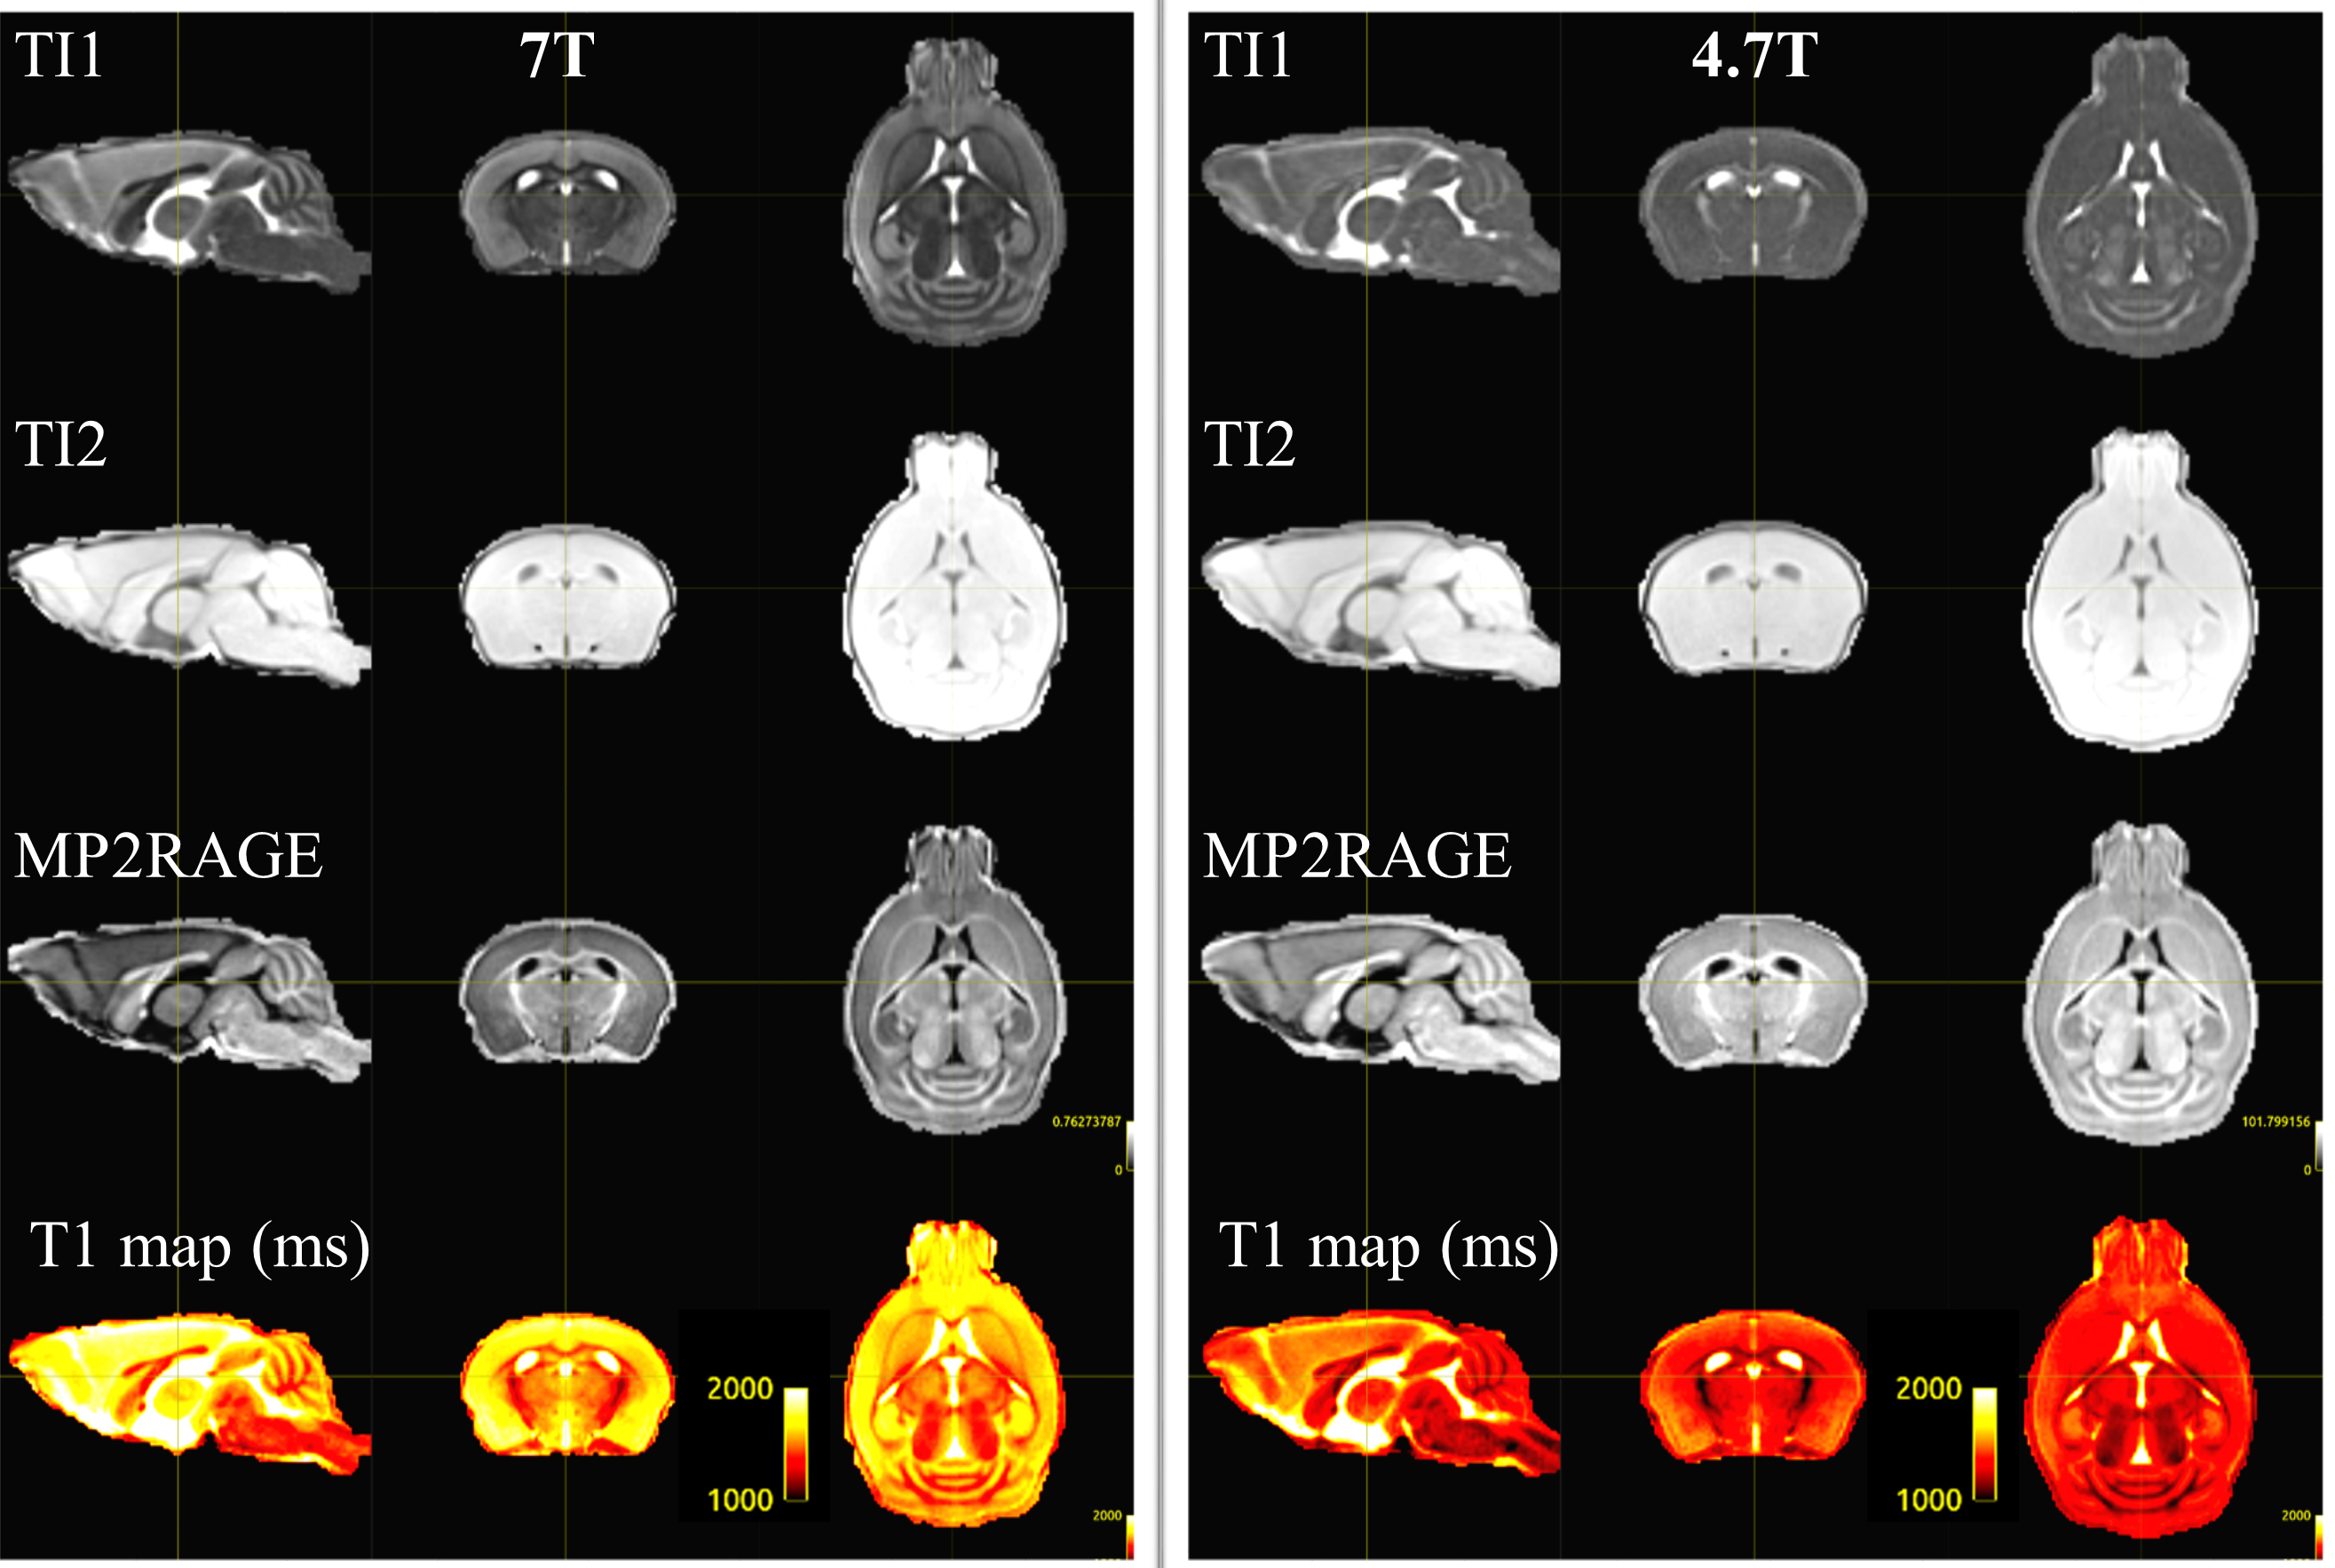
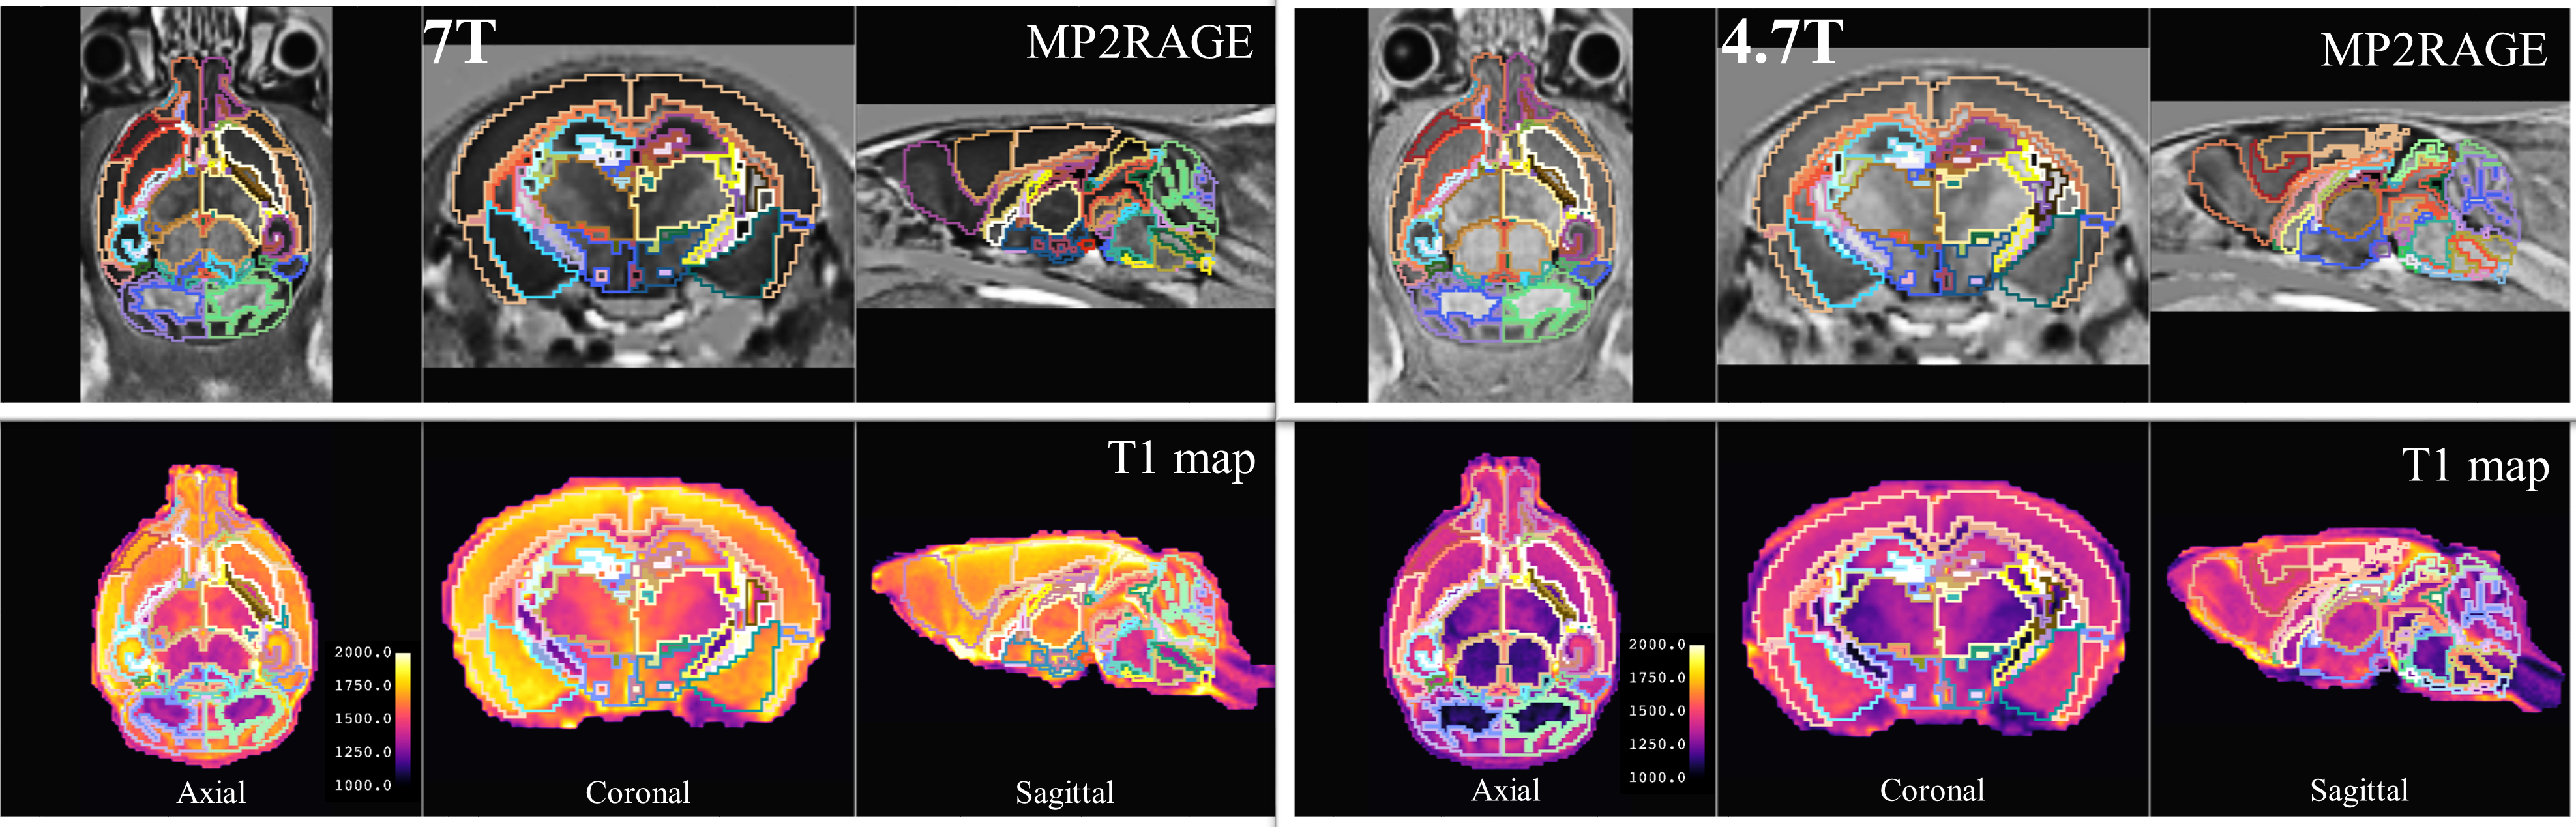
Figure 2 displayed the high-resolution brain template (150 µm3) in coronal, sagittal and axial orientations at 7T and 4.7T for every contrasts. The template provided better contrast and sharpness than the individual subject. Structures, such as the corpus callosum (CC), hippocampus (HC) and cerebellum are well visible. The templates were of comparable quality in terms of signal-to-noise ratio and spatial resolution.Figure 3 displays the coregistered Dorr Atlas on the high-resolution brain template. The application of Dorr atlas to the templates enables the easy identification of the different brain areas. The atlas delineation looks in agreement with homogenous T1 values in many regions (CC, HC, …), while other structures like the thalamus show a larger heterogeneity of T1 values.
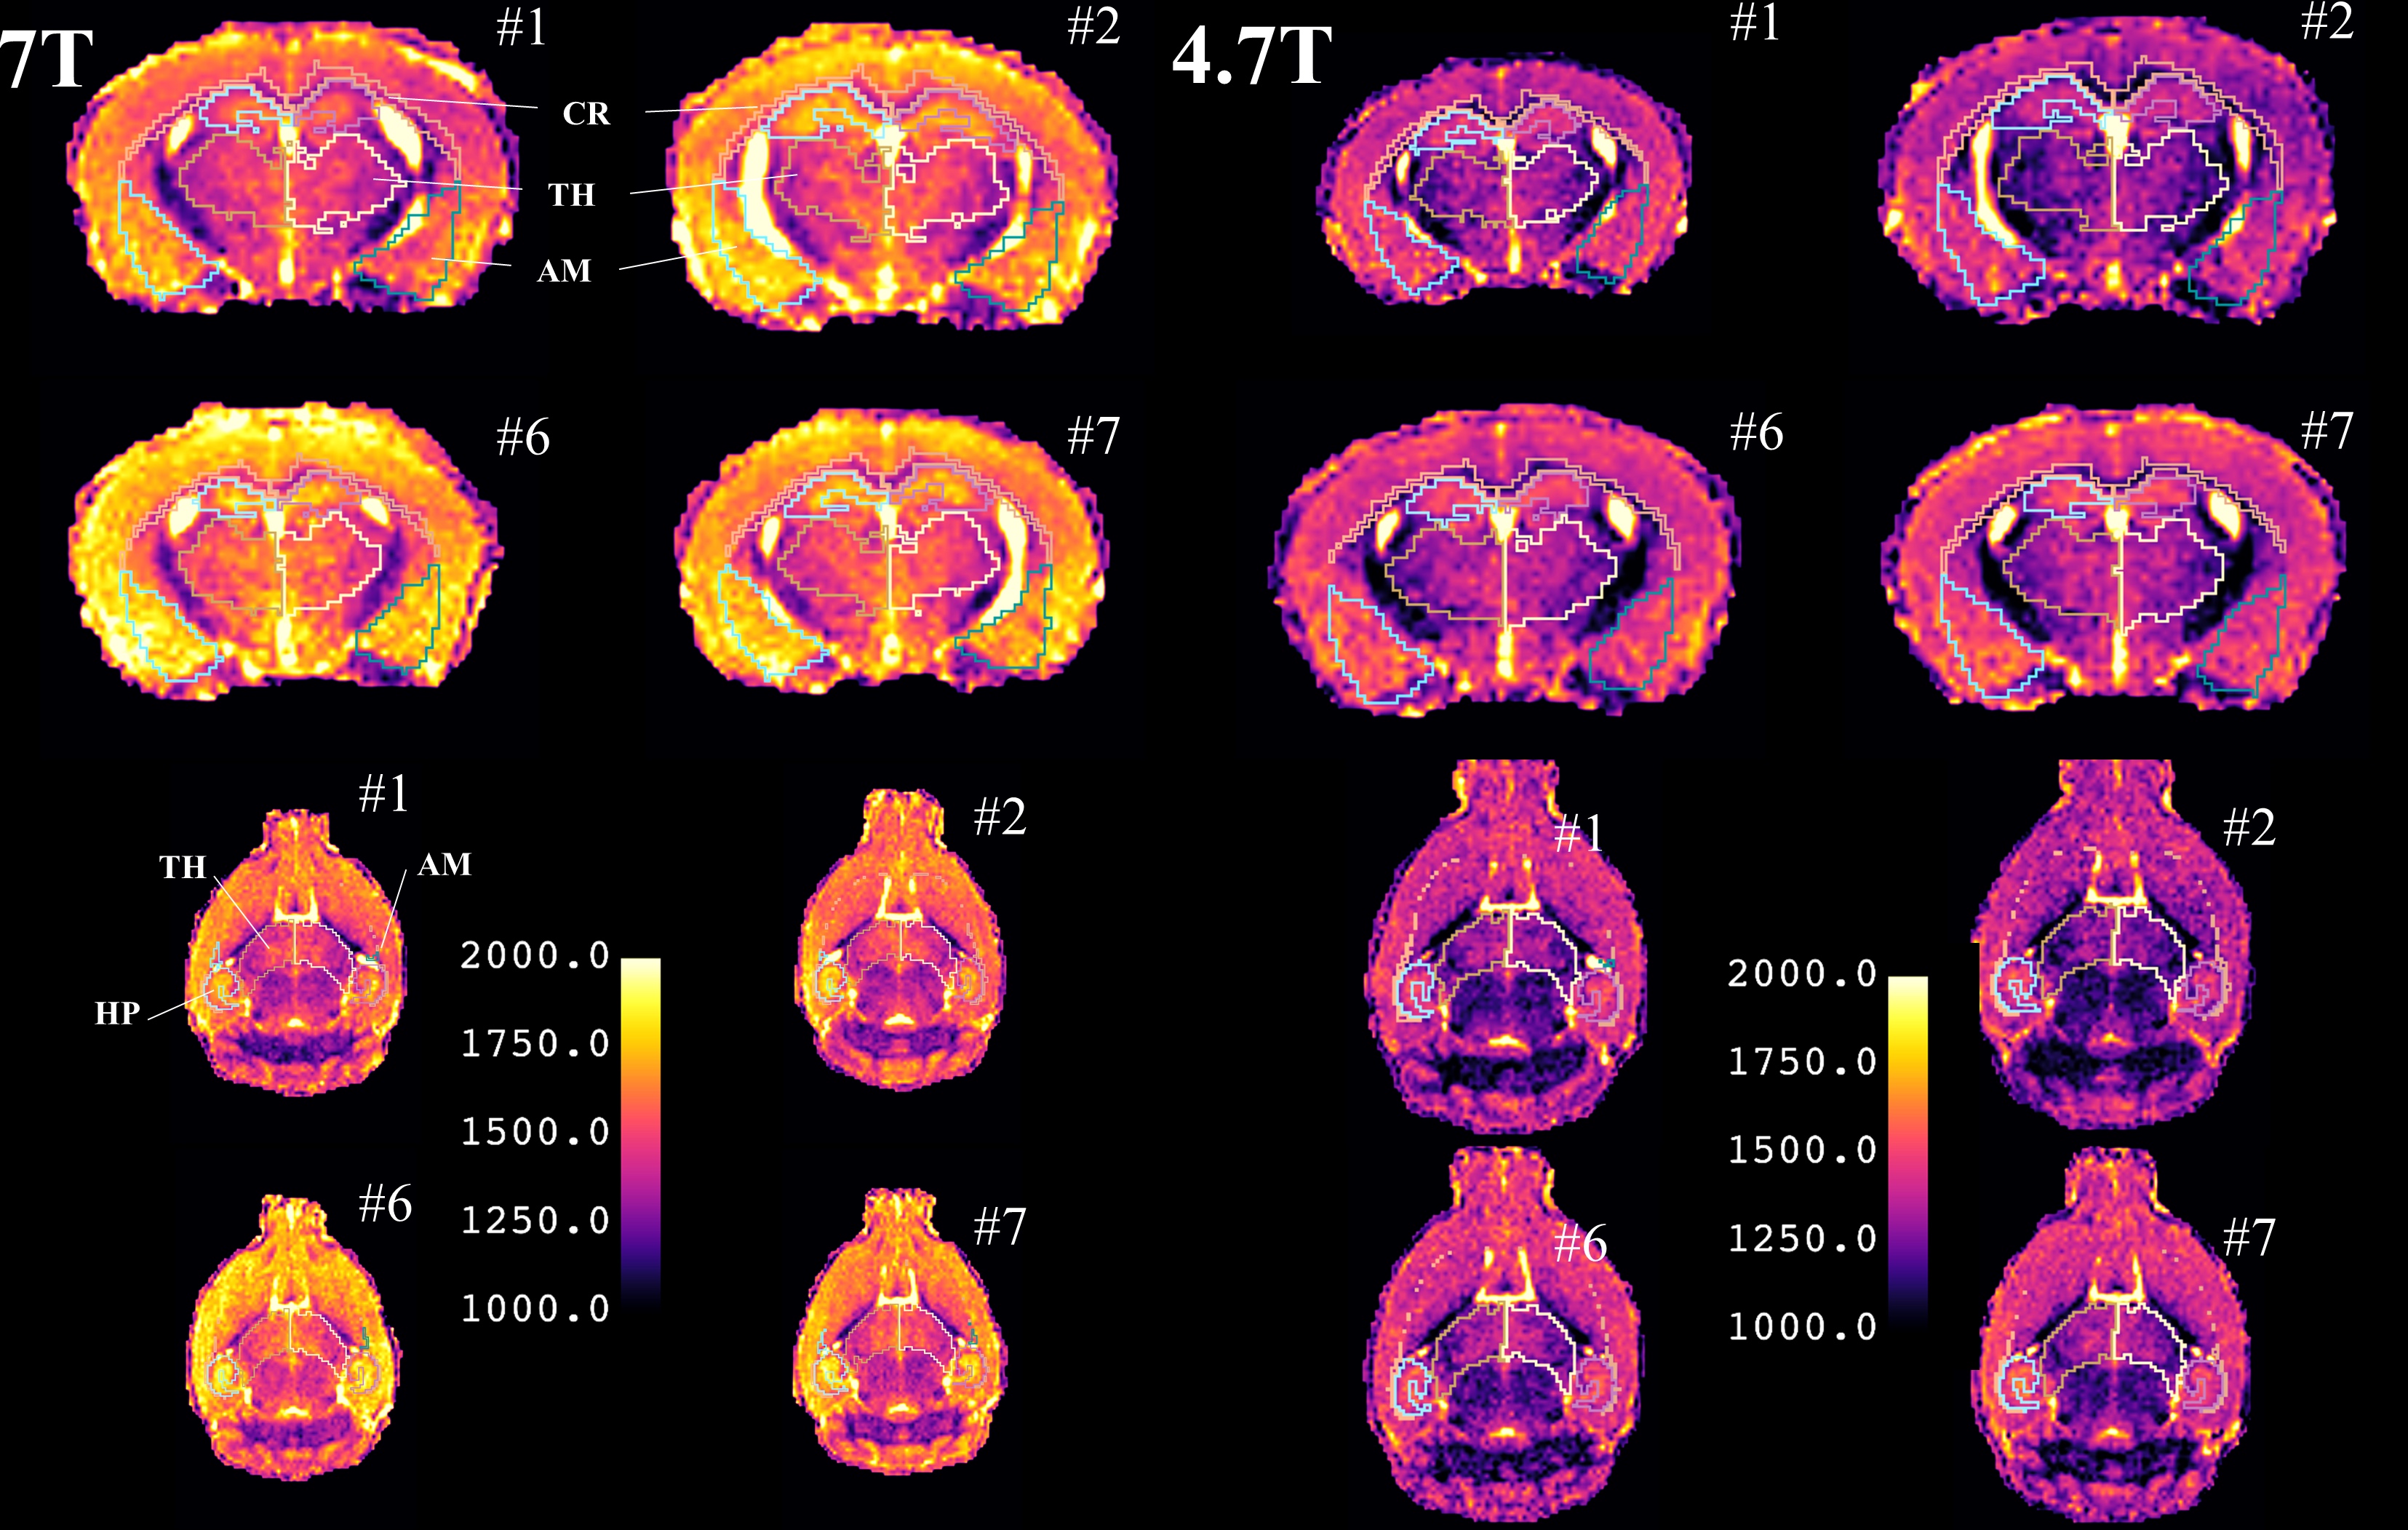
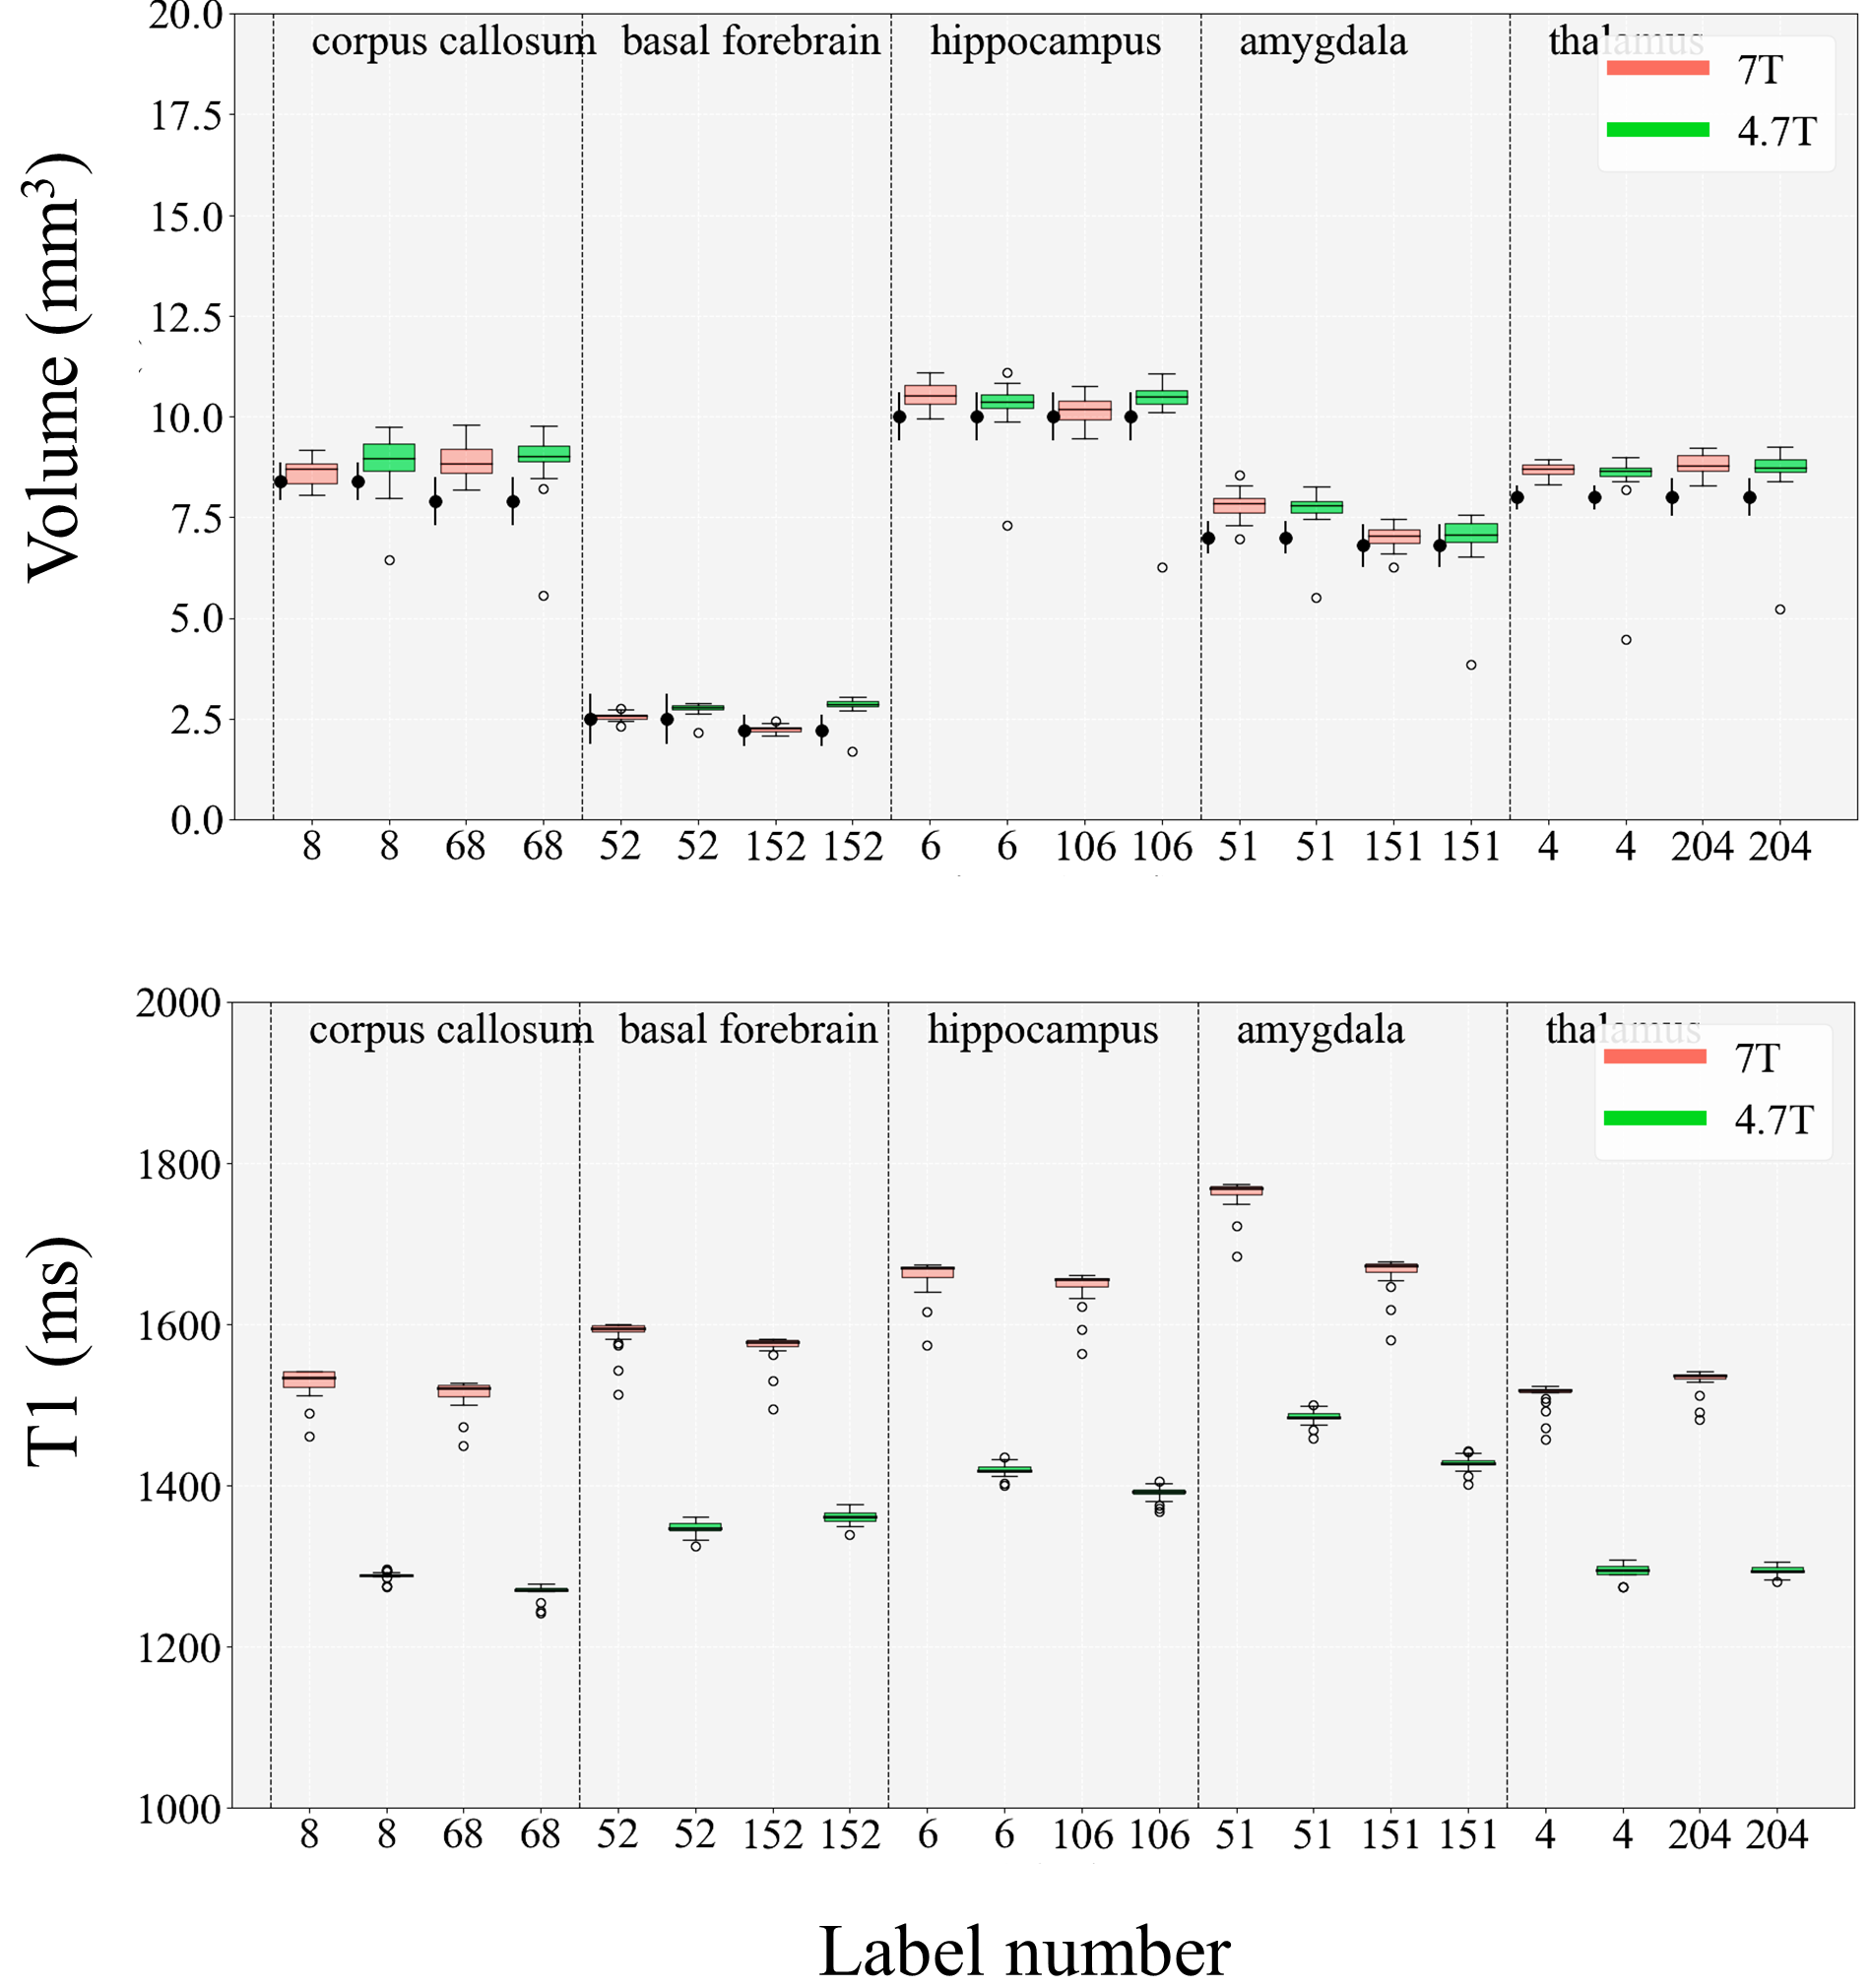
Figure 4 displays the Dorr atlas delineation in native space for selection areas: corpus callosum, basal forebrain, hippocampus, amygdala and thalamus. The volumes and T1 values measured of all subjects for the selected areas are shown in Figure 5. As expected, the volume values are comparable between the left and right hemispheres and between 7T and 4.7T. As well, the T1 values are higher at 7T than at 4.7T.
DISCUSSION
We created a high-resolution T1 map brain template using high resolution in vivo MRI acquisitions at 7T and 4.7T. Spatial normalization was performed using non-linear registration algorithms and resulted in sharp images. After coregistration of the literature atlas, it is possible to automatically delineate the different brain areas and measure the T1 value in these different areas. Volumes were found in agreement with the literature. The T1 measurements are reproducible between individuals and significantly different at 4.7T and 7T.CONCLUSION
The templates obtained in vivo can be used to compare the volumes of the different brain areas of the animals, inter and intra individual, as well as the T1 values for in vivo mouse neuroimaging studies.Acknowledgements
No acknowledgement found.References
1. Trotier AJ, Rapacchi S, Faller TL, Miraux S, Ribot EJ. Compressed-Sensing MP2RAGE sequence: Application to the detection of brain metastases in mice at 7T. Magn Reson Med. 2019 Jan;81(1):551-559. doi: 10.1002/mrm.27438.
2. Avants BB, Tustison NJ, Song G, Cook PA, Klein A, Gee JC. A reproducible evaluation of ANTs similarity metric performance in brain image registration. Neuroimage. 2011;54(3):2033–44
3. Tustison NJ, Avants BB, Cook PA, Zheng Y, Egan A, Yushkevich PA, et al. N4ITK: improved N3 bias correction. IEEE Trans Med Imaging. 2010;29(6):1310–20
4. Dorr, A. E., Lerch, J. P., Spring, S., Kabani, N., & Henkelman, R. M. (2008). High resolution three-dimensional brain atlas using an average magnetic resonance image of 40 adult C57Bl/6J mice. Neuroimage, 42(1), 60-69
Figures