3756
Contrast Kinetic Model-based GRASP Reconstruction for Small Animal Imaging at 7T1Weill Cornell Medical College, New York, NY, United States
Synopsis
Keywords: Image Reconstruction, DSC & DCE Perfusion
In this study, we propose a contrast kinetic model-based GRASP (mGRASP) method which can improve the spatial image quality as well as temporal characteristics of DCE-MRI. The proposed mGRASP method was assessed with 9L rat glioma model and GL261 mouse glioma model in an Active Contrast Encoding (ACE)-MRI experiment which simultaneously measures the pre-contrast T1 and contrast kinetic model parameters including intracellular water lifetime. The results show that mGRASP provides improved image quality and temporal patterns compared to GRASP.Introduction
Recent development of fast MRI methods, such as Golden-angle Radial Sparse and Parallel (GRASP)1, has been successfully applied to Dynamic Contrast-Enhanced MRI (DCE-MRI) studies of small animal tumor models to obtain images with high spatial and temporal resolutions simultaneously2. However, it remains challenging to utilize these fast-imaging techniques to achieve an isotropic spatial high resolution with sufficient data quality when the signal-to-noise ratio is limited such as in small animal imaging. Previously, GRASP-Pro (GRASP MRI with improved performance)3 was proposed to use low-resolution dynamic images to estimate orthogonal temporal bases that can be used to reconstruct images with improved spatial quality. In this study, we propose a contrast kinetic model-based GRASP (mGRASP) method which can further improve the spatial and temporal quality of the dynamic images.Methods
mGRASP: The mGRASP framework is a low-rank subspace constrained image reconstruction method that utilizes a set of numerically generated contrast enhancement data to estimate the orthogonal bases used for image reconstruction. A similar concept was introduced, by Feng et al,3 as GRASP-Pro, in which the temporal bases were estimated from low-resolution dynamic images. In mGRASP, a set of contrast enhancement data, $$$S_M \in \mathbb{R}^{P \times M}$$$, is generated using a contrast kinetic model with wide ranges of parameters along with a range of T1 values, where $$$P$$$ is the number of dynamic frames and $$$M$$$ is the number of simulated dynamic curves using a contrast kinetic model. The orthonormal bases were estimated using the principal component analysis (PCA): $$$S_M=UV_M$$$, where $$$U \in \mathbb{R}^{P \times P}$$$ are the bases and $$$V_M \in \mathbb{R}^{P \times M}$$$ are the associated coefficients. It is assumed that the first $$$K$$$ dominant components are sufficient to represent $$$S_M$$$ such that $$$UV_M\approx U_KV_{MK}$$$ where $$$U_K \in \mathbb{R}^{P \times K}$$$ and $$$V_{MK} \in \mathbb{R}^{K \times M}$$$, and $$$K \ll P$$$. Then, mGRASP image reconstruction is performed by solving the following:$$$\hat V_{NK}= \underset{V_{NK}}{\arg\min} \left \{\frac {1}{2}\|\Phi F C\left(U_K V_{NK}-y\right)\|^2_2 + \lambda\|\Theta\left(U_K V_K\right)\|_1\right \} $$$
where $$$y$$$ is the measured k-space data, $$$N$$$ the number of voxels, $$$\Phi$$$ the undersampling operator, $$$F$$$ the NUFFT operator, $$$C$$$ the coil sensitivity operator, $$$\lambda$$$ a regularization factor, and $$$\Theta$$$ the temporal total variation operator.
MRI experiment: Three F344/NHsd rats with 9LLUC rat glioma model and three C57BL/6 mice with GL261 mouse glioma model (n = 6) were used. Bruker 7T micro-MRI system, with a four-channel phased array rat(mouse) head receive-only surface coil and a volume transmit coil, were used. Dynamic image acquisition was performed using a 3D UTE pulse sequence with 3D golden angle scheme2 (TR = 5ms, TE = 0.028ms), and image matrix = 128x128x128. Field of view = 37x37x37 mm3 (25x25x25 mm3 for mouse) and spatial resolution = 0.289x0.289x0.289 mm3 (0.195x0.195x0.195 mm3 for mouse). It was continuously run to acquire 48,500 spokes (9,700 spokes each flip angle segment, totally 14 segments, with flip angels in each segment were: 10o-10o-10o-10o-2o-10o-20o-10o-5o-10o-15o-10o-25o-10o) for 11 min 19 s. This is a protocol for Active Contrast Encoding (ACE)-MRI4 to simultaneously measure pre-contrast T1 along with contrast kinetic parameters, without using a separate pre-contrast T1 mapping5. A bolus of gadobutrol (Bayer) at the dose of 0.1 mmol/kg was injected through a tail vein catheter, starting 60 seconds after the start of data acquisition.
Image reconstruction and analysis: The image reconstruction was conducted using GRASP and mGRASP methods to acquire 3D isotropic resolution DCE-MRI data. An experimentally measured Arterial Input Function (AIF) was used5. The ACE-MRI data with the above scan parameters were generated using the two compartment exchange model (TCXM)6 with the water exchange model7 which includes 5 parameters: PS(permeability surface-area product), Fp(blood flow), ve(extracellular space volume fraction), vp(plasma space volume fraction) and τi (intracellular water lifetime). A large cluster of ACE-MRI curves were generated by using possible ranges of the parameters including pre-contrast T1 for tumor, normal brain, and blood (Figure 1A). PCA was carried out to get the bases (Figure 1B) for mGRASP reconstruction. Reconstruction of temporal frame resolution was T = 5 s/frame. The TCXM model was used for voxel-wise analysis of the GRASP and mGRASP images.
Results and Discussion
In all cases, the mGRASP images have superior image quality and sharpness as shown in Figure 2. In terms of the temporal patterns, the mGRASP data appear to be less noisy than the GRASP data as shown in Figure 3. Furthermore, the mGRASP data match the level and pattern of the NUFFT data better than the GRASP data, particularly for a vascular signal in Figure 3C. Tumor contrast kinetic parameter maps of the GRASP and mGRASP images (Figure 4) shows similar patterns. But those of the mGRASP provide more internal structure and heterogeneity of tumor. In terms of the image reconstruction time, mGRASP was two times faster than GRASP in this study. In Figure 5, the image quality and dynamic data comparison between GRASP and mGRASP using a mouse brain tumor were also shown, which showed consistent observations as those from rat tumor model above.Conclusion
This study demonstrates the feasibility of using mGRASP for small animal imaging at 7T. Further study is warranted to optimize the hyper-parameters including the number of bases and regularization factor.Acknowledgements
NIH R01CA160620, R01CA219964, and UH3CA228699References
1. Li Feng, Robert Grimm, Kai Tobias Block, Hersh Chandarana, Sungheon Kim, Jian Xu, Leon Axel, Daniel K. Sodickson, and Ricardo Otazo, Golden-angle radial sparse parallel MRI: combination of compressed sensing, parallel imaging, and golden-angle radial sampling for fast and flexible dynamic volumetric MRI, MRM, 2014 Sep;72(3):707-172. Jin Zhang, Li Feng, Ricardo Otazo and S. Gene Kim, Rapid dynamic contrast-enhanced MRI for small animals at 7T using 3D ultra-short echo time and golden-angle radial sparse parallel MRI, MRM, 2019 Jan;81(1):140-152.
3. Li Feng, Qiuting Wen, Chenchan Huang, Angela Tong, Fang Liu, and Hersh Chandarana, GRASP-Pro: imProving GRASP DCE-MRI through self-calibrating subspace-modeling and contrast phase automation, MRM, 2020 Jan; 83(1): 94–108.
4. Jin Zhang, Kerryanne Winters, Olivier Reynaud, Sungheon Gene Kim, Simultaneous measurement of T1/B1 and pharmacokinetic model parameters using active contrast encoding (ACE)-MRI, NMR Biomed. 2017 Sep;30(9):10.1002/nbm.3737.
5. Jin Zhang, Karl Kiser, Ayesha Bharadwaj Das, Sawwal Qayyum, and Sungheon Gene Kim, Simultaneous estimation of longitudinal relaxation time and intracellular water lifetime using Active Contrast Encoding, ISMRM 2022 abstract 4447.
6. David L. Buckley, Steven P. Sourbron, Tracer kinetic modelling in MRI: estimating perfusion and capillary permeability, Phys Med Biol. 2012 Jan 21;57(2):R1-33.
7. Xin Li, William D. Rooney, Charles S. Springer Jr, A unified magnetic resonance imaging pharmacokinetic theory: intravascular and extracellular contrast reagents, MRM, 2005 Dec;54(6):1351-9.
Figures
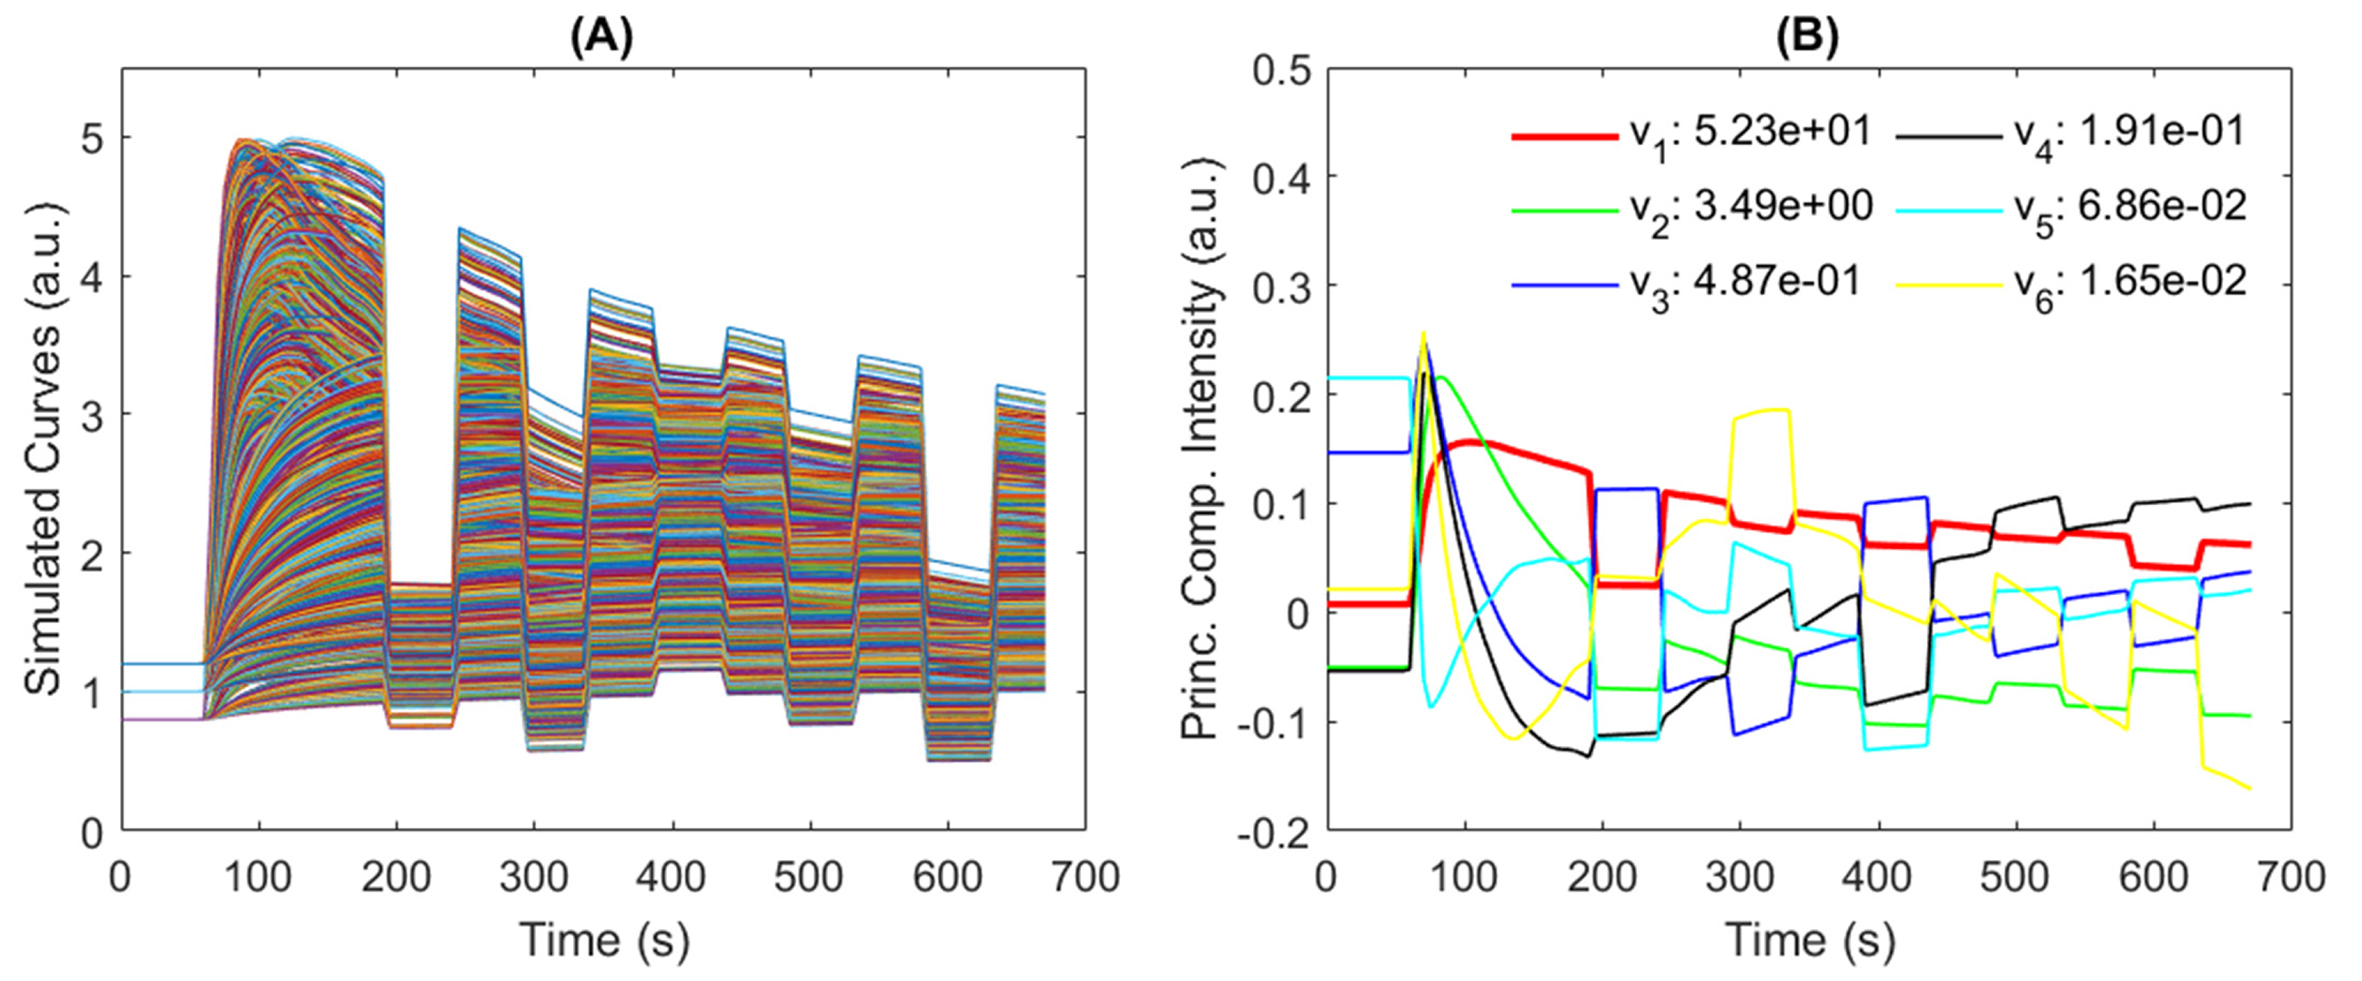
Figure 1. Simulated contrast kinetic curves (A) and orthogonal bases (B) obtained using the PCA for mGRASP. The vi value shown in (B) is the i-th eigenvalue.
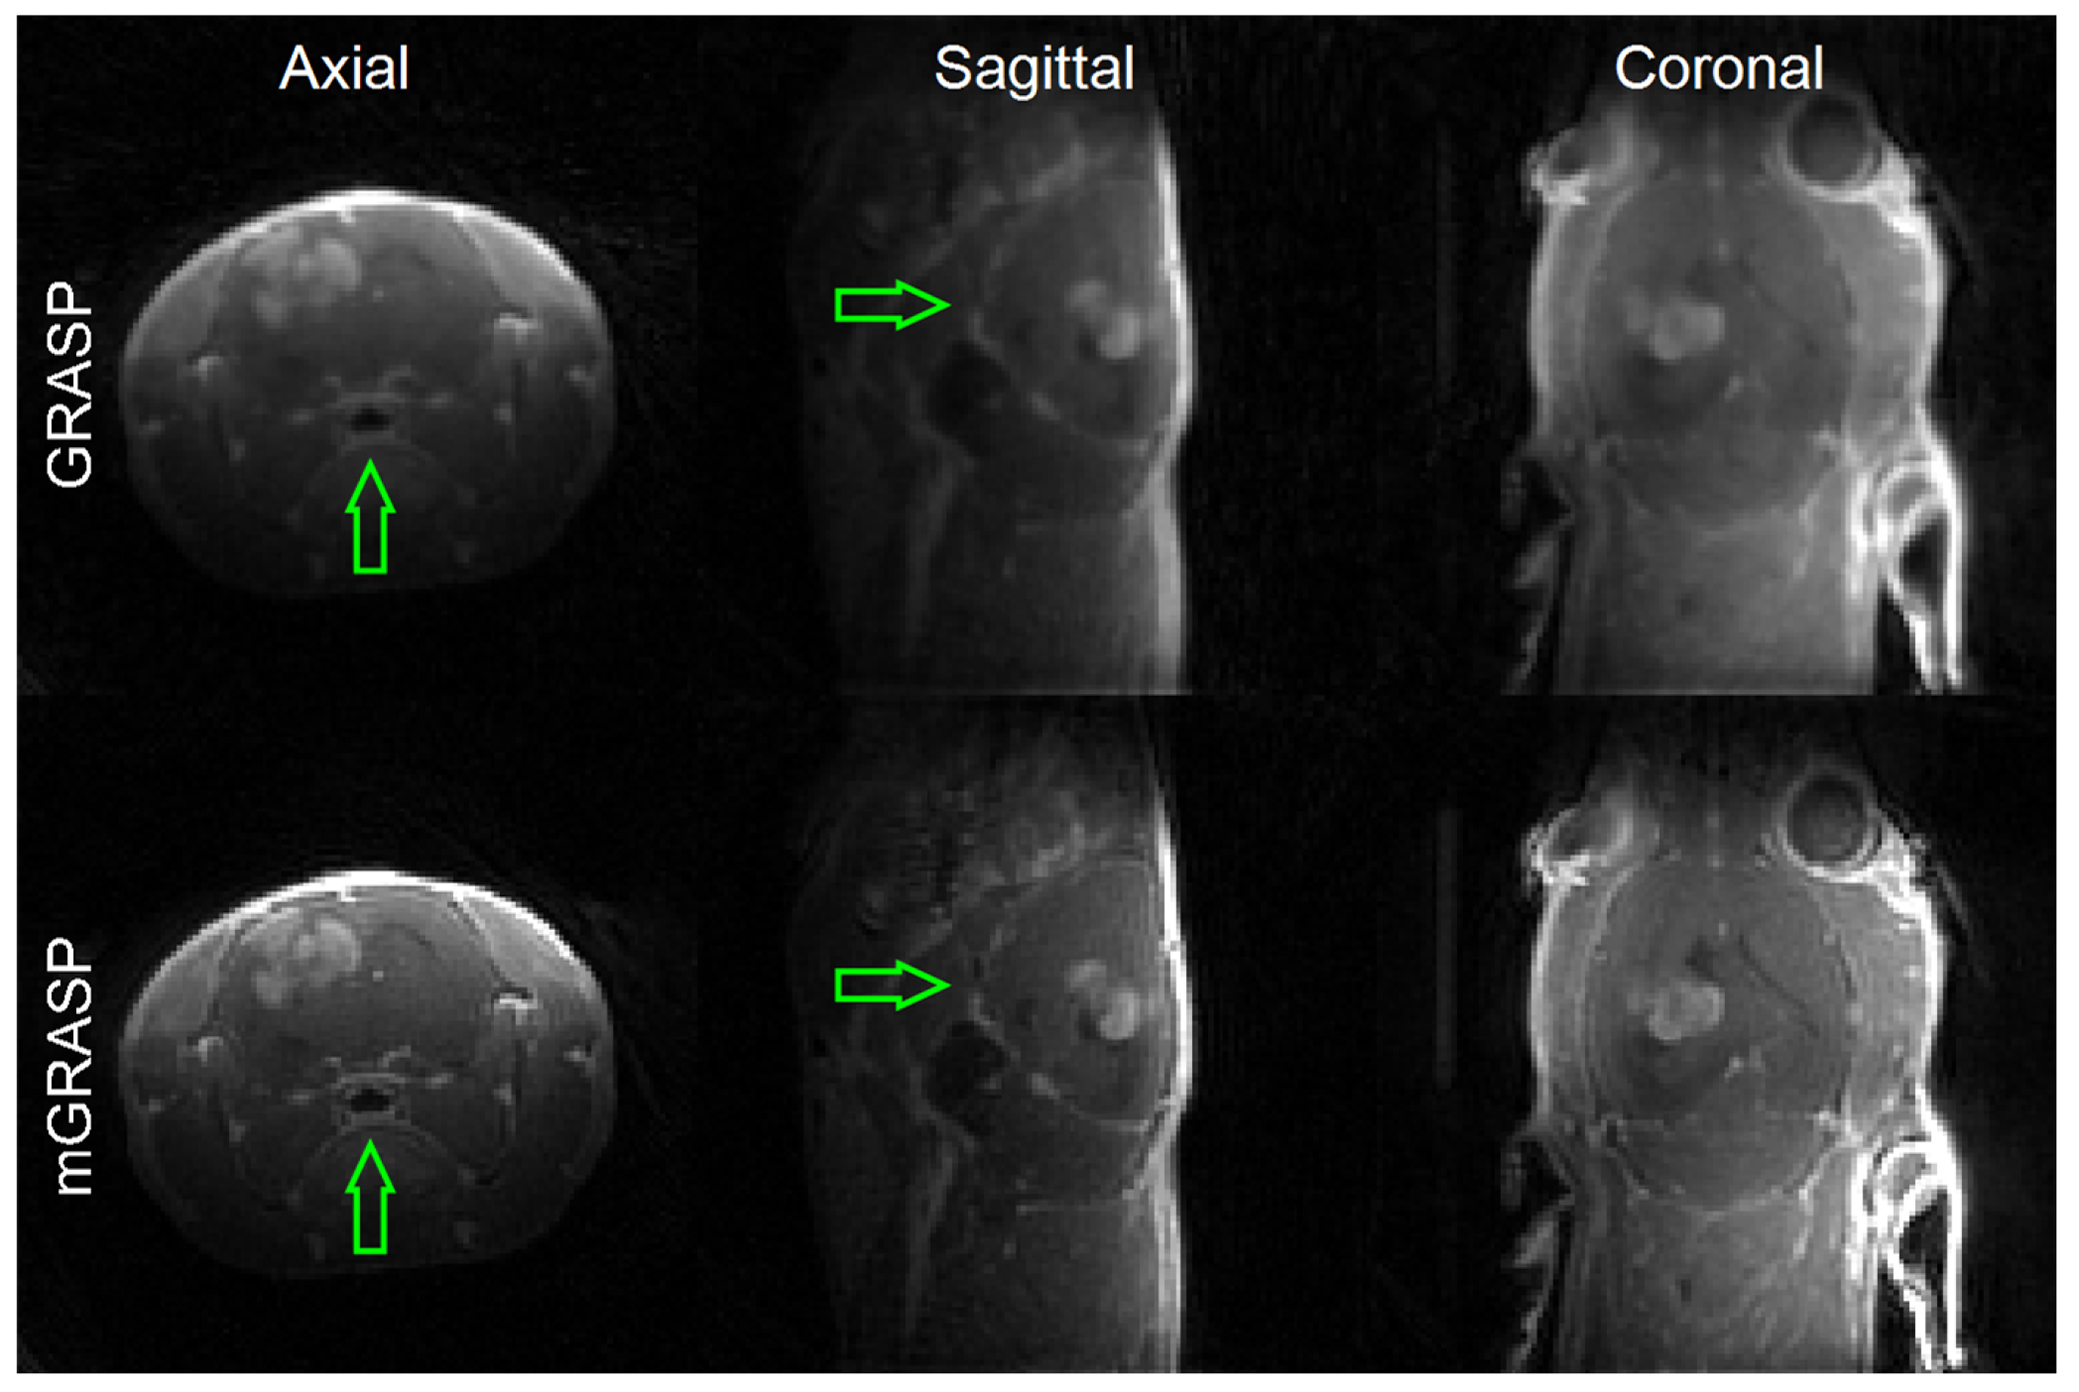
Figure 2. Comparison of images reconstructed using GRASP and mGRASP methods for a rat brain tumor. All reconstruction was conducted using the isotropic 3D data. The images shown are the tumor center slices in axial/sagittal/coronal planes. mGRASP images show noticeable improvement in image quality across the whole brain, while the improvement can be noticed more clearly in the ventral side of the animal with the low signal sensitivity of the coil due to the physical distance from the coil (green arrows in axial and sagittal planes).
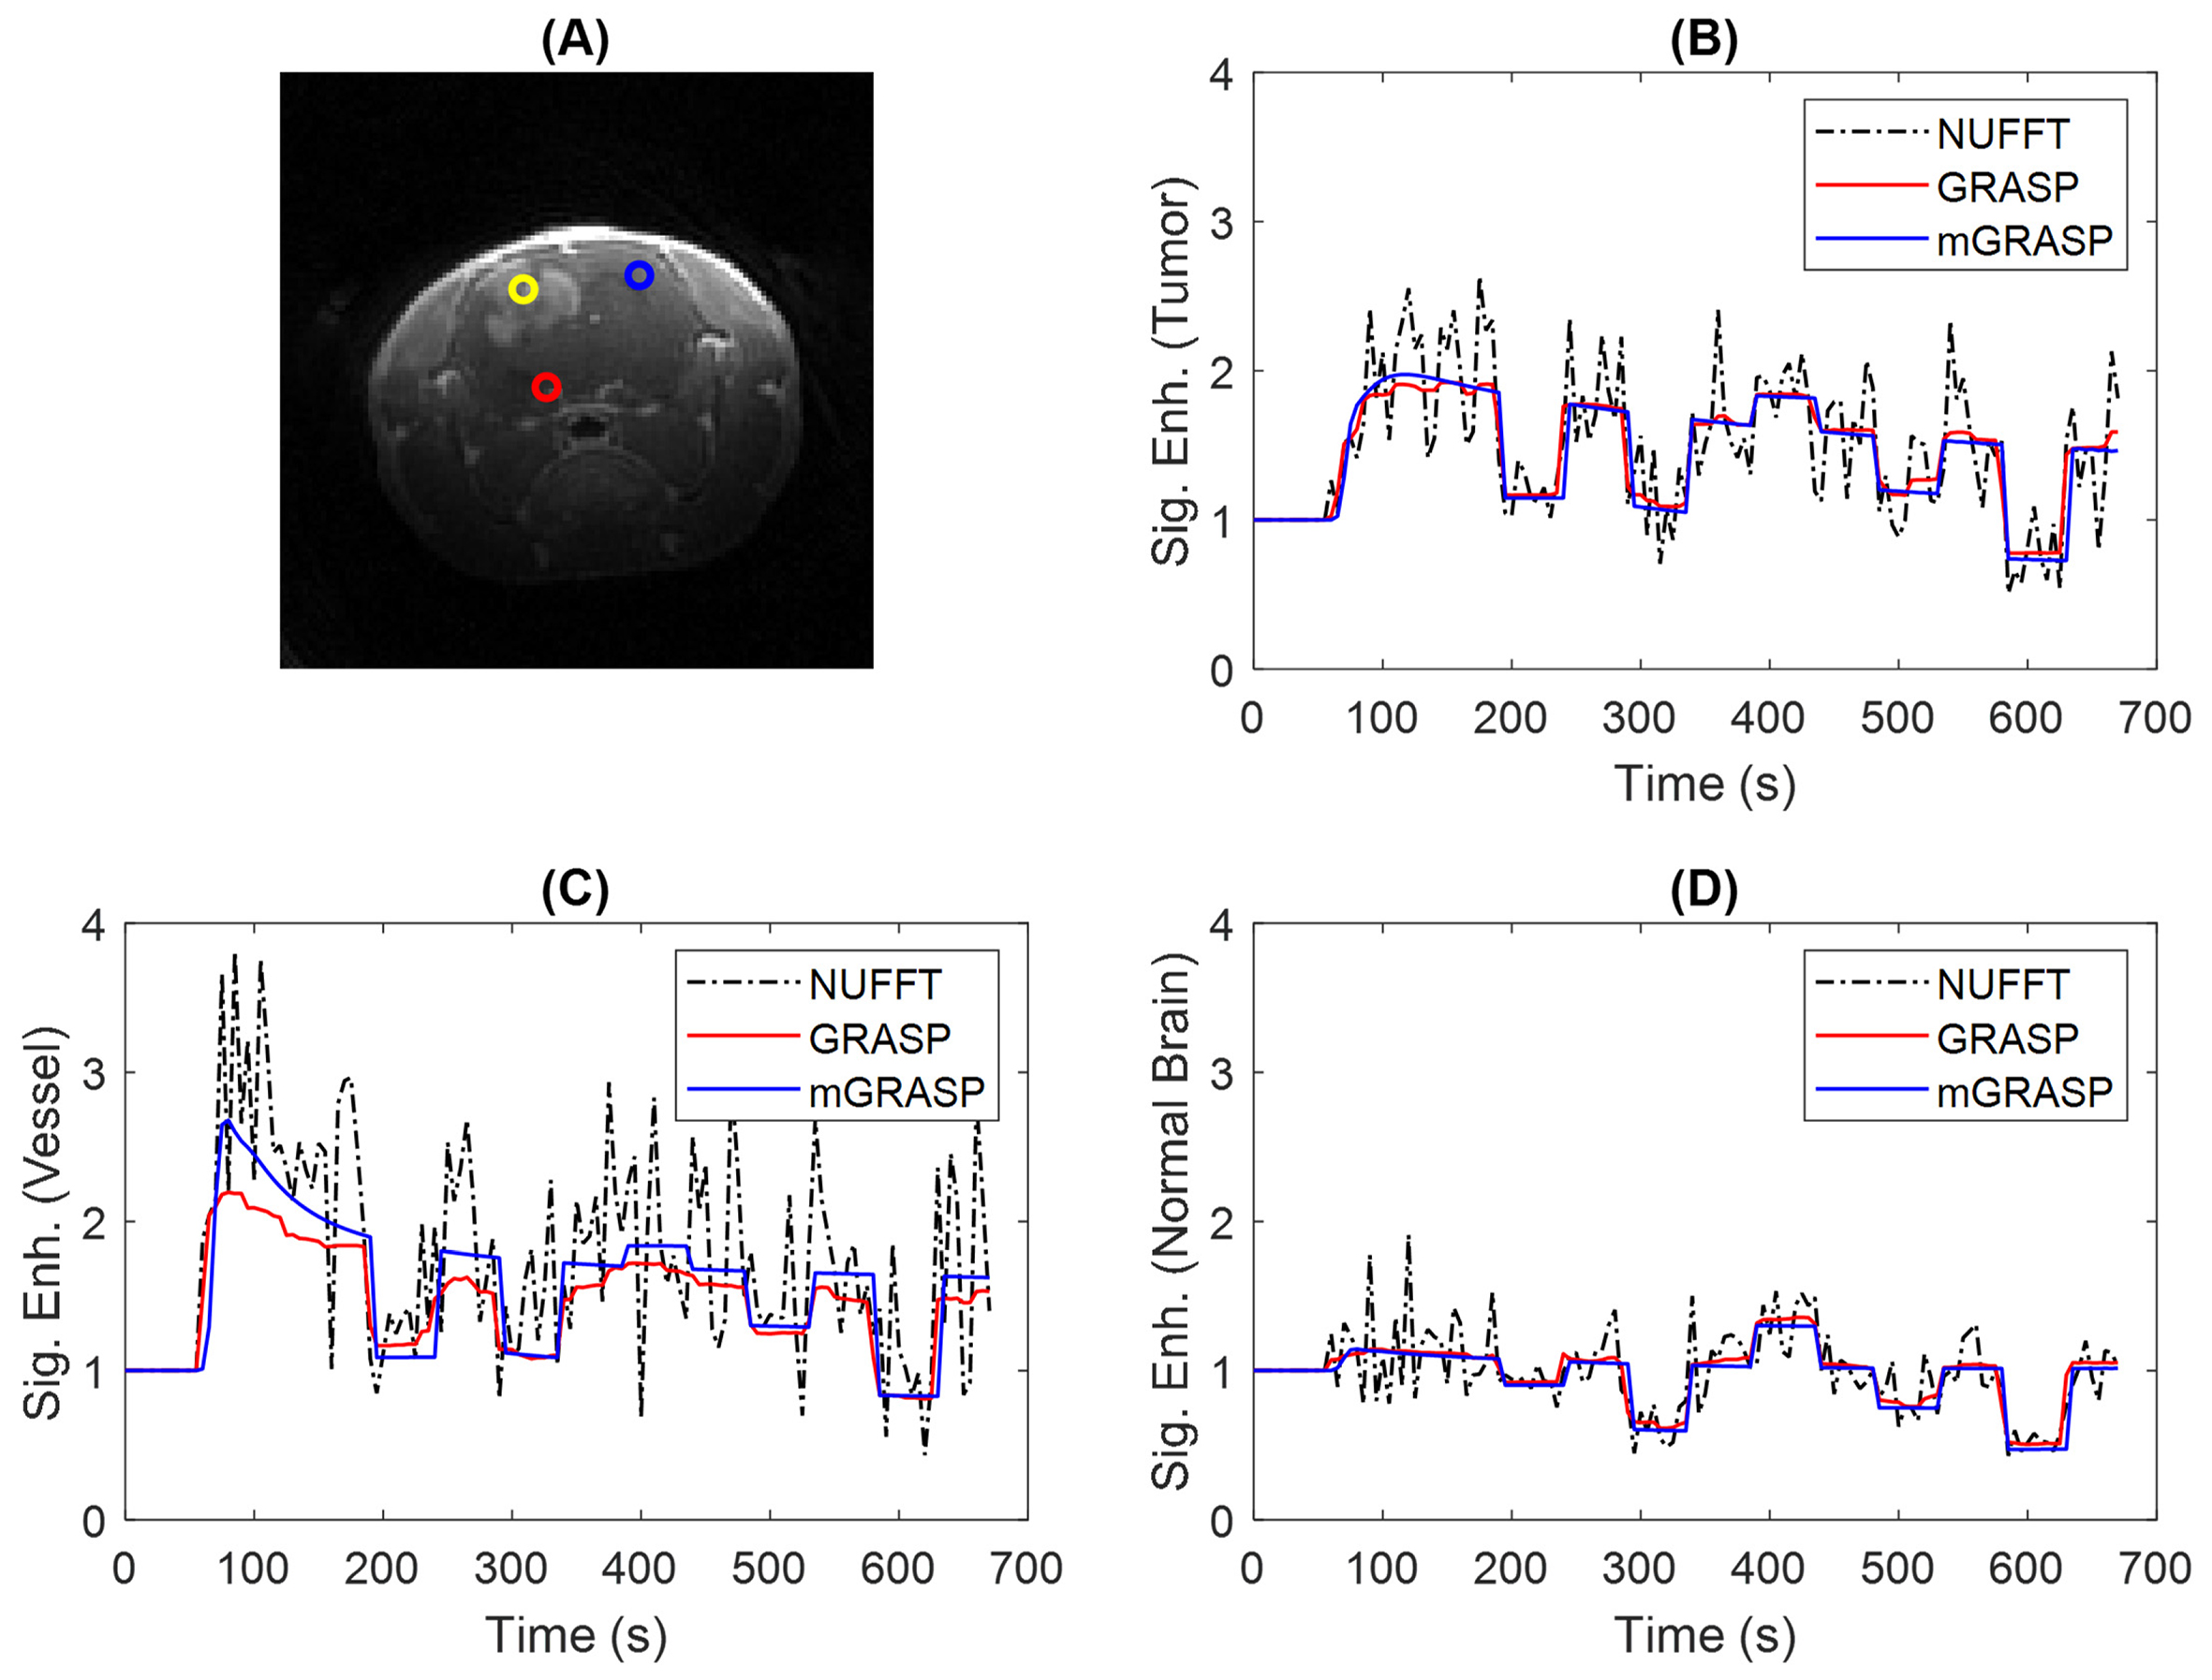
Figure 3. Representative voxels for tumor (yellow circle), vessel (red circle) and normal brain (blue circle) in a rat brain as shown in (A). Their corresponding contrast enhancement curves from NUFFT, GRASP and mGRASP reconstructions are shown for tumor (B), vessel (C) and normal brain (D) voxels. In comparison to GRASP, the mGRASP data appear to be less noisy.
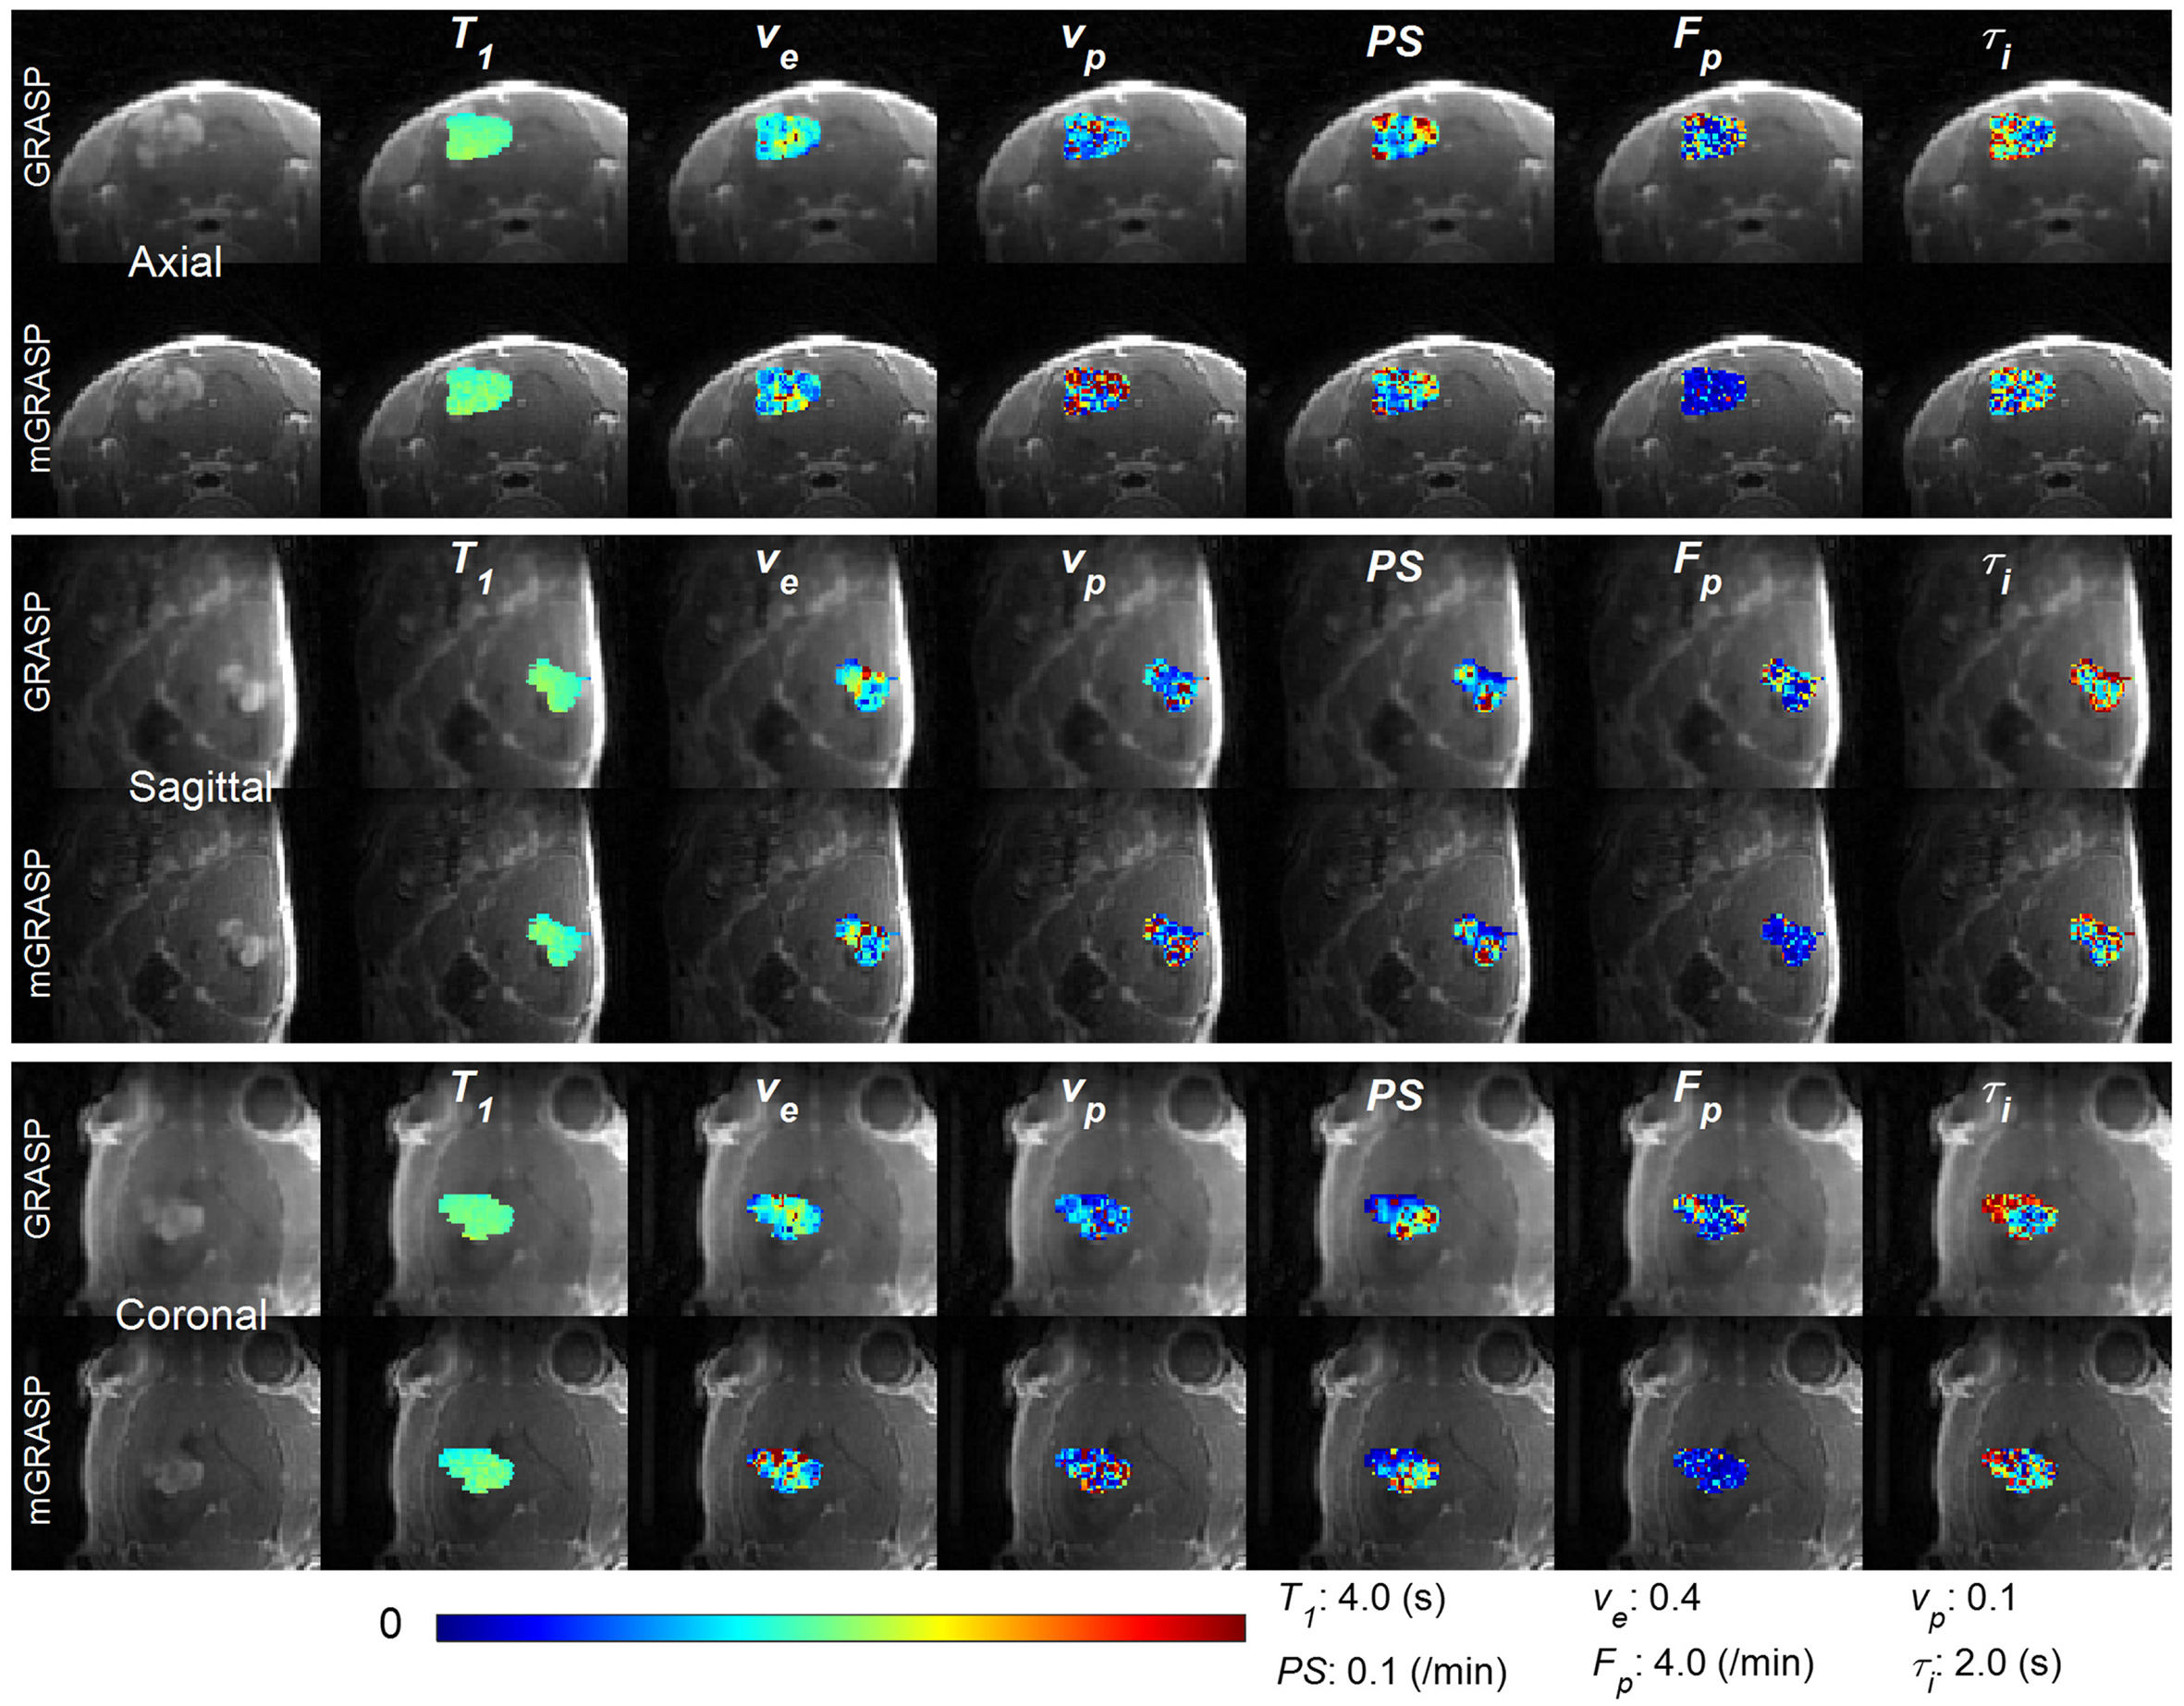
Figure 4. Pharmacokinetic model parameter color maps of rat brain tumor center slices in axial/sagittal/coronal planes from the GRASP and mGRASP images.
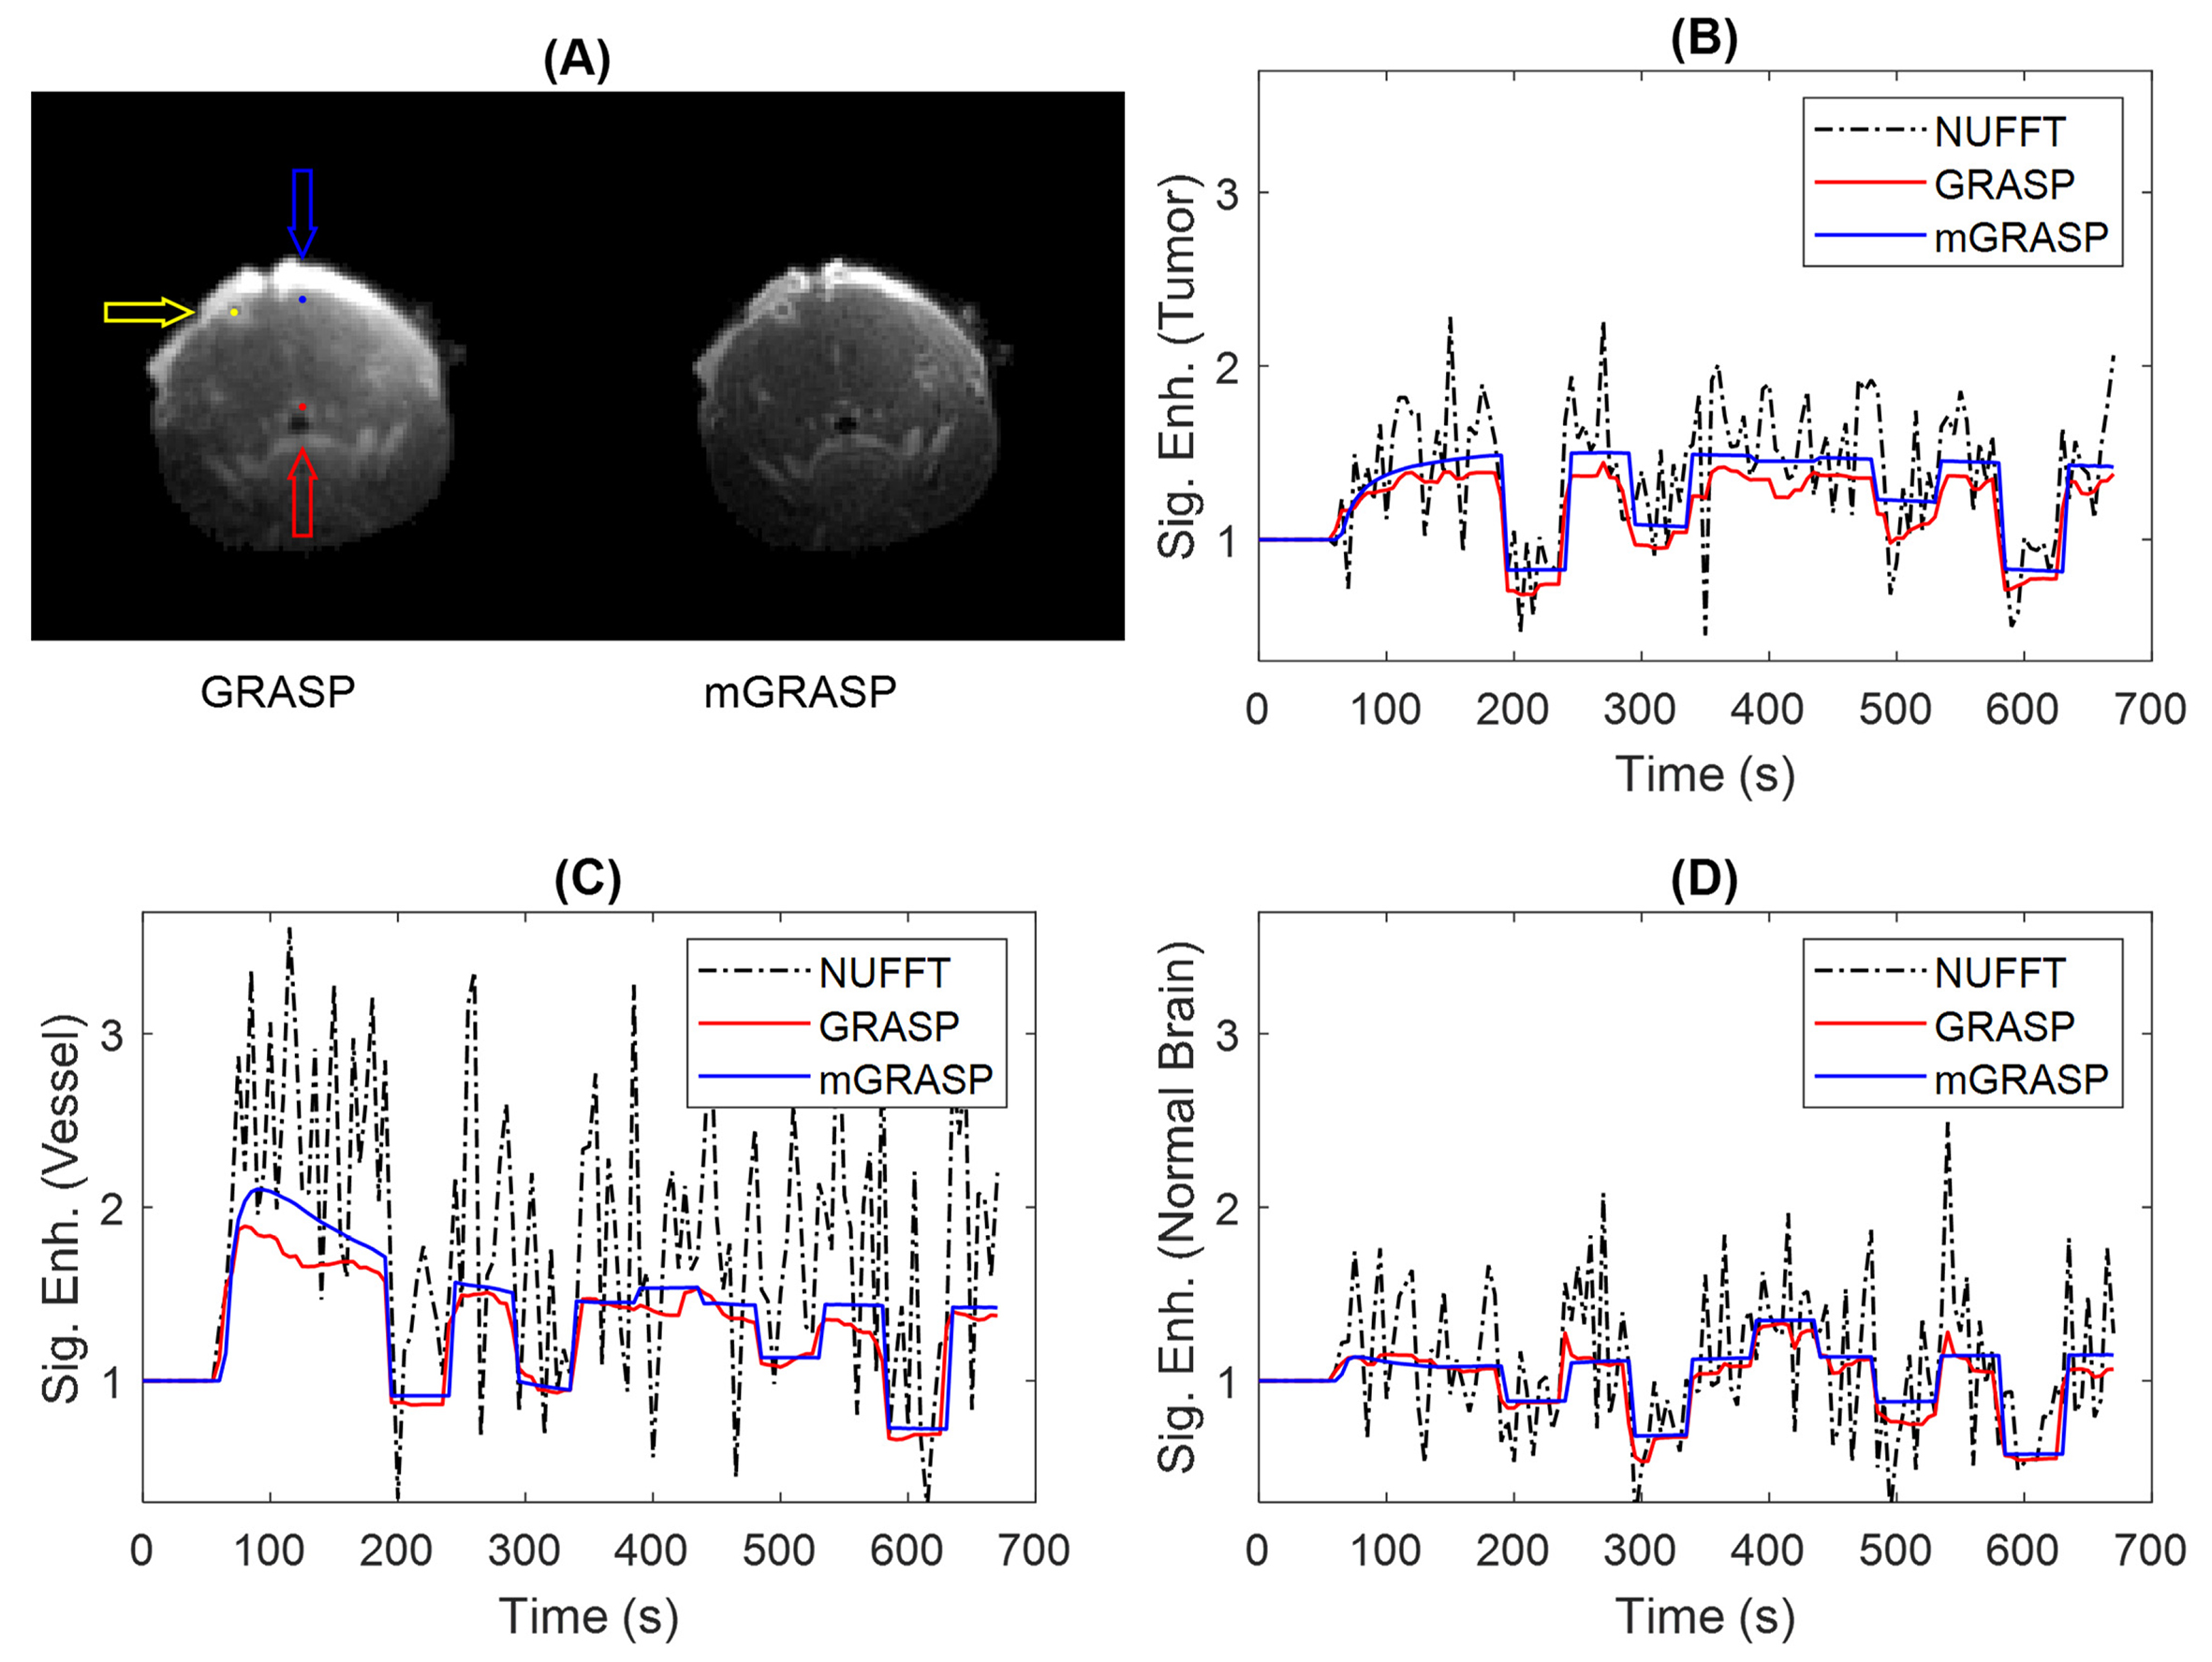
Figure 5. A representative case of mouse brain tumor shown for the two reconstruction methods with the tumor (yellow arrow), vessel (red arrow) and normal brain (blue arrow) voxels (A). Their corresponding contrast enhancement curves from NUFFT, GRASP and mGRASP reconstructions are show in (B) tumor, (C) vessel and (D) normal brain voxels. Compared with GRASP, the mGRASP data appear to be less noisy.