3755
Optimized metabolic imaging of rat’s kidney on clinical MRI scanners. Comparison to small-animal high-field imaging
El-Sayed H. Ibrahim1, Abdul Parchur1, Srividya Kidambi1, Mingyu Liang1, and Allen Cowley1
1Medical College of Wisconsin, Milwaukee, WI, United States
1Medical College of Wisconsin, Milwaukee, WI, United States
Synopsis
Keywords: Kidney, Hypertension
T2*-based blood oxygenation level-dependent (BOLD) MRI has been used to investigate renal metabolism in the rat’s kidney, which is typically conducted on high-field small-animal MRI scanners. However, T2* is very small at high-field strength, e.g., 9.4T, which results in borderline signal-to-noise ratio and questions the measurements accuracy. In this study, we investigated the capability of BOLD imaging of the rat’s kidney on a clinical 3T MRI scanner, where T2* is much higher, and compared the results to those acquired on 9.4T small-animal scanner. The results showed the capability for distinguishing different oxygenation levels in the kidney on clinical 3T scanners.Introduction
About 70% to 90% of the oxygen consumed by the kidney is used to support renal tubular transport which plays an essential role in the regulation of fluid and electrolyte homeostasis and blood pressure. Increased renal tubular fluid and sodium reabsorption contribute to the development of hypertension in a variety of settings. Enhanced sensitivity of blood pressure to a salty diet in animal models is associated with abnormal mitochondrial function and substrate utilization in the kidney. Therefore, T2*-based blood oxygenation level-dependent (BOLD) MRI can be used to investigate renal metabolism in the rat’s kidney, which is typically conducted on high-field small-animal MRI scanners. However, T2* values are very small at high-field strength, e.g., 9.4T, which results in borderline signal-to-noise ratio (SNR) and questions the measurements accuracy. In this study, we investigated the capability of BOLD imaging of the rat’s kidney on a clinical 3T MRI scanner, where T2* is much larger with a higher dynamic range, and compared the results to those acquired on a 9.4T small-animal scanner.Methods
Six Sprague-Dawley rats fed a normal 1% NaCl diet were included in this study. Three rats were scanned on a 9.4T small-animal MRI scanner with a 30-cm bore diameter (Bruker, Ettlingen, Germany) using a 4-element surface coil positioned at the kidney level adjacent to the right kidney. The three other rats were scanned on a Premier 3T clinical MRI scanner (GE Healthcare, Waukesha, WI) using an 8-channel wrist coil to acquire coronal images. The rats were imaged under continuous delivery of anesthesia via a nose cone with 2-2.5% isoflurane. After scout imaging, T2*-based BOLD images were acquired using echo-planar imaging (EPI) and multi-echo gradient-echo sequences on the 9.4T scanner and using segmented gradient-echo (GRE) sequence on the 3T scanner. The optimized imaging parameters for the 9.4T EPI sequence were: repetition time (TR)=3s, three echoes acquired with echo times (TE)=16.6, 33.1, and 49.6 ms, flip angle=90°, matrix=96×96, field-of-view (FOV)=60×60mm2, slice thickness=1mm, acquisition bandwidth=3125 Hz/pixel, #averages=1. The optimized imaging parameters for the 9.4T multi-echo gradient-echo sequence were: TR=2s, six echoes acquired with TE=4-31ms with equal increments of 5.5ms, flip angle=50°, matrix=176×176, FOV=60×60 mm2, slice thickness=1mm, acquisition bandwidth=426 Hz/pixel, #averages=2. The optimized imaging parameters for the 3T segmented GRE sequence were: TR=43.1s, eight echoes acquired TE=5.5-39ms with equal increments of 4.8ms, flip angle=20°, matrix=200×200, FOV=120×120mm2, slice thickness=1.8mm, acquisition bandwidth=122 Hz/pixel, #averages=2. The T2*-weighted images were analyzed using the Circle cvi42 analysis software. Data from the images at different echo times were fitted to a monoexponentially decaying function, from which pixel-wise T2* values were measured to generate color-coded T2*-based BOLD maps. SNR was measured in all images as the ratio between mean signal intensity in the whole kidney divided by standard deviation of background noise. Student’s t-test was used to compare measurement differences between different sequences. P<0.05 was considered significant.Results
Figure 1 shows the resulting EPI and gradient-echo BOLD images from the 9.4T scanner, while Figure 2 shows the resulting images from the 3T scanner. T2* measurements in the kidney (mean±SD) were 8±2, 13.7±1.5, and 32.7±9.8ms in the 9.4T EPI, 9.4T GRE, and 3T GRE images, respectively. SNR measurements were 1.2±0.2, 2.8±0.1, and 6.6±2.2 in the 9.4T EPI, 9.4T GRE, and 3T GRE images, respectively. Both GRE sequences showed significant differences in SNR compared to the EPI sequence. Although SNR was higher in the 3T GRE sequence compared to the 9.4T GRE sequence, the difference was not significant (P=0.09). The low SNR in the 9.4T EPI sequence resulted in T2* values that are comparable to the noise level, which affected the usefulness of the acquired BOLD image. With improved SNR in the GRE sequence, more details could be visualized in the BOLD map, for example the gradient in tissue oxygenation between cortex and medulla in Figure-1. This could also be appreciated in the 3T GRE sequence where the T2* values are much higher than the background noise, which allows for distinguishing different oxygenation levels in different regions of the kidney (Figure-2). Although spatial resolution was lower on the 3T scanner compared to 9.4T scanner, the kidney could still be easily visualized and contoured in the 3T BOLD map.Discussion and Conclusions
Alternations of renal metabolism may be linked to the progressive reduction of renal oxygenation as uncoupling of oxidative phosphorylation occurs with high salt feeding. The measurement of such sequential changes in tissue oxygenation of the same animal has not been previously possible due to the invasive nature of the techniques traditionally utilized. With the availability of MRI BOLD imaging, such longitudinal studies could be achieved. However, T2*-based BOLD imaging at 9.4T results in very small T2* values that are comparable to the background noise level, which affects the measurements accuracy and usefulness. Therefore, the possibility of acquiring adequate BOLD images at the lower magnetic field of clinical scanners, as shown in this study, results in higher dynamic range secondary to the increased T2* values at the lower magnetic field. This approach provides a robust method to non-invasively and sequentially determine the progressive effects of different interventions, e.g., administering a high salt diet, on renal tissue oxygenation in small animals.Acknowledgements
No acknowledgement found.References
1. Pruijm et al. Nephrol Dial Transplant, 33: ii22-ii28.
2. Bane et al. MAGMA, 33:199-215.
3. Textor et al. Am J Kidney Dis, 59: 229-237.
Figures
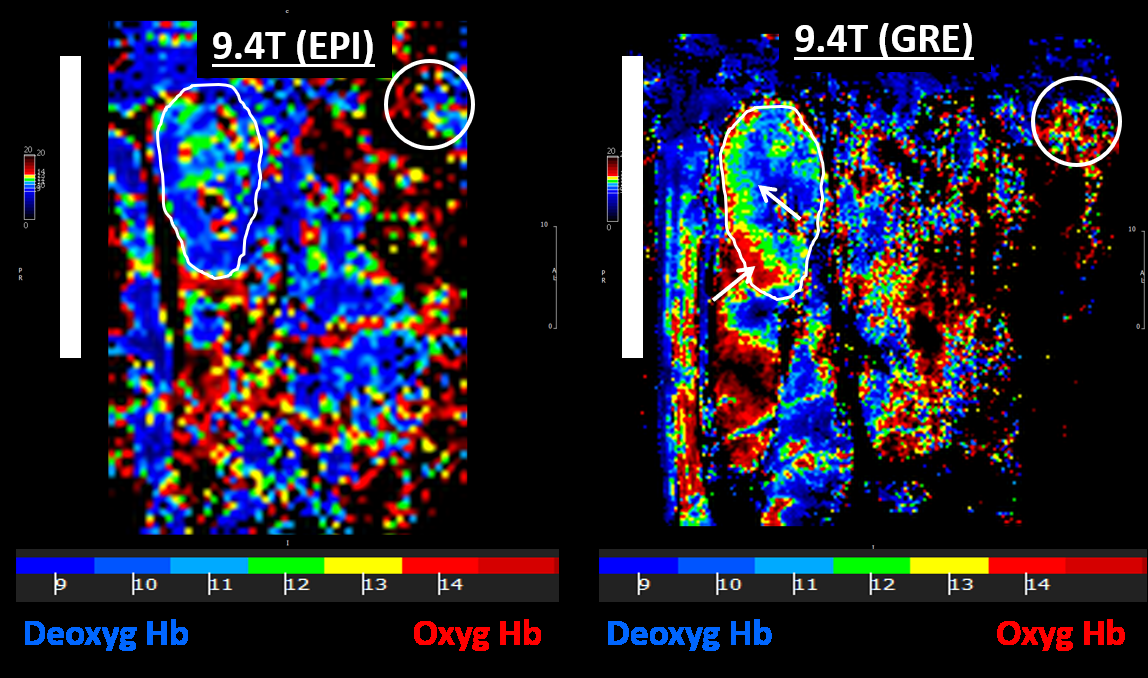
Fig 1. 9.4T BOLD
images. T2*-based BOLD images acquired in the same Sprague Dawley rat
using echo planar imaging (EPI; left) and gradient echo (GRE; right) sequences
on 9.4T MRI scanner using a surface coil (location of the coil is represented
by the vertical white bar). T2* values in the contoured kidney are comparable
to the background noise level in the white circle. However, the GRE image shows
useful information, e.g., the gradient
in tissue oxygenation between cortex and medulla (arrows).
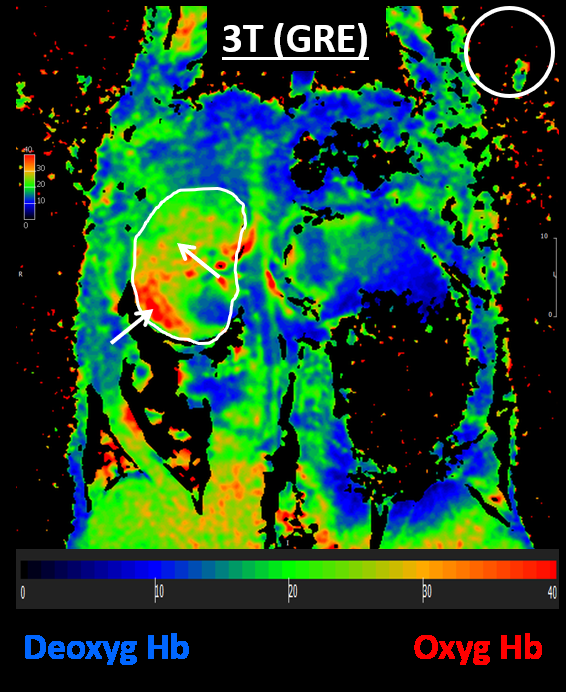
Fig 2. 3T BOLD
image. T2*-based BOLD image acquired in a Sprague Dawley
rat using segmented gradient echo (GRE) sequence on a 3T MRI clinical scanner
using an 8-element wrist coil. Note significantly increased T2* values in the
contoured kidney compared to the background noise in the white circle. The
kidney could be easily visualized in the resulting BOLD image, which shows
different oxygenation level in different regions of the kidney (arrows).
DOI: https://doi.org/10.58530/2023/3755