3753
1H-MRS reveals changes of metabolites in the olfactory bulb of PM2.5-exposed mice1Institute of Science and Technology for Brain-Inspired Intelligence, Fudan University, 200433, Shanghai, China, 2GE. Healthcare, shanghai, China
Synopsis
Keywords: Spectroscopy, Quantitative Imaging, PM2.5
PM2.5 has been shown to be harmful to the central nervous system of mammals. Long term exposure to PM2.5 may cause changes in brain neural metabolites. However, there were few magnetic resonance spectroscopy (MRS) studies in rodents under PM2.5 exposure. In this work, we developed an air enrichment system to concentrate PM2.5. Using 1H-MRS, we successfully observed the brain metabolic profile of olfactory bulb in PM2.5-exposed mice, and found the concentration changes of some key metabolites in the brain, indicating that PM2.5 has a non-negligible impact on brain metabolism.Introduction
It is important to understand brain metabolic changes occurred during brain development, aging, and in a pathological state [1, 2]. MRS can be used to evaluate the changes of brain metabolism in both clinical and preclinical studies. Fine particulate matter with an aerodynamic equivalent diameter ≤ 2.5 microns or less, named as PM2.5. As the main component of air pollution, PM2.5 may affect significantly change brain metabolism and thus result in altered imaging results. Therefore, it is necessary to detect brain metabolism under PM2.5 exposure. In this work, using ultra-high field MR scanner (11.7T), we aimed to investigate the longitudinal effects of different PM2.5 exposure durations on brain metabolism.Materials and Methods
Animal preparationMale adult C57BL/6 mice were used in the current study. All experimental protocols were approved by the Animal Ethics Committee of Fudan University. After 1week adaptation feeding, the mice were divided into two groups. The control group and exposure group were respectively exposed to filtered air or concentrated PM2.5 in “Shanghai Meteorological and Environmental Animal Exposure System (Shanghai-METAS)”. The concentrated PM2.5 was generated using a versatile aerosol concentration enrichment system (VACES) that has been published previously [3,4,5]. The duration of the exposure was 8 h per day, 6 days per week (except Sunday) for 90 days. The real-time concentrations of PM2.5 were continuously measured by TEOM 1405 (Thermo, USA), and simultaneously followed by sampling the PM2.5 on filters to determine the accurate concentrations. During exposure, the average PM2.5 concentrations in the exposure chamber were 13.7μg/m³ for the control group and 255.1μg/m³ for the exposure group. MRI was performed at the 3rd month, the 6th month, and the 12th month of the exposure durations, respectively.
MRI and MRS Measurements
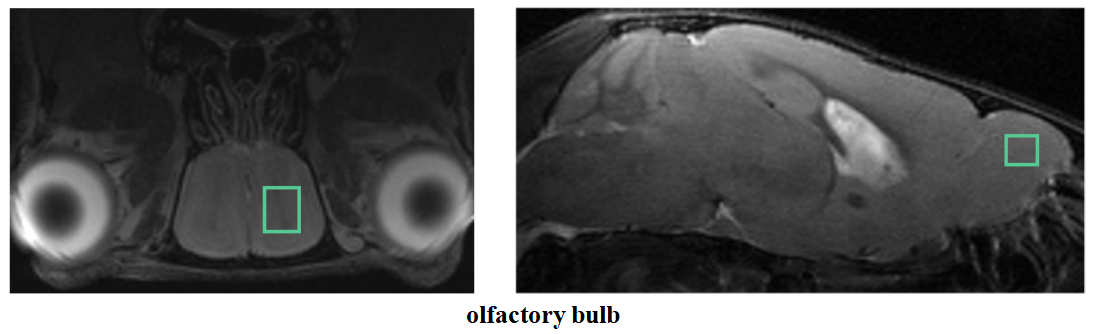
All MRI data were acquired with a Bruker BioSpec 11.7T scanner equipped with a CryoProbe (Ettlingen, Germany). Axial and sagittal multi-slice T2-weighted images (T2WI; TR = 3000 ms, TE = 12 ms, Rare Factor = 8, number of averages = 1, number of slices = 20) were acquired. Localized MRS was applied using Point Resolved Spectroscopy (PRESS) with the variable pulse power strengths and optimized relaxation delays (VAPOR) water suppression. The volumes of interest (VOIs)(1.5mm×2.0mm ×1mm)were located in the center of olfactory bulb. The 1H-MRS spectra were acquired with the following parameters: TR=1500 ms, TE=12.5 ms, number of averages=512. During MRS/MRI acquisition, the respiration of mice was monitored by a small animal monitoring system and mice body temperature was maintained.
Data analysis
The 1H-MRS data were analyzed by software, LCModel (http://s-provencher.com/pages/lcmodel.shtml). Total creatine (tCr) including creatine (Cr) and phosphocreatine (PCr) measured from the same VOI was used as an internal reference for the quantification of metabolites. Data were fitted to a linear combination of metabolites in simulated basis sets, containing: Cr, PCr, gamma-aminobutyric acid (GABA), glutamate (Glu), glutamine (Gln), glutathione (GSH), myo-inositol (mI), lactate (Lac), N-acetylaspartate (NAA), taurine (Tau), etc. Results were presented as mean ± standard deviation. All data were passed normality testing. Data were analyzed with two-sample, paired student’s t-tests. P < 0.05 was considered statistically significant.
Results and Discussion
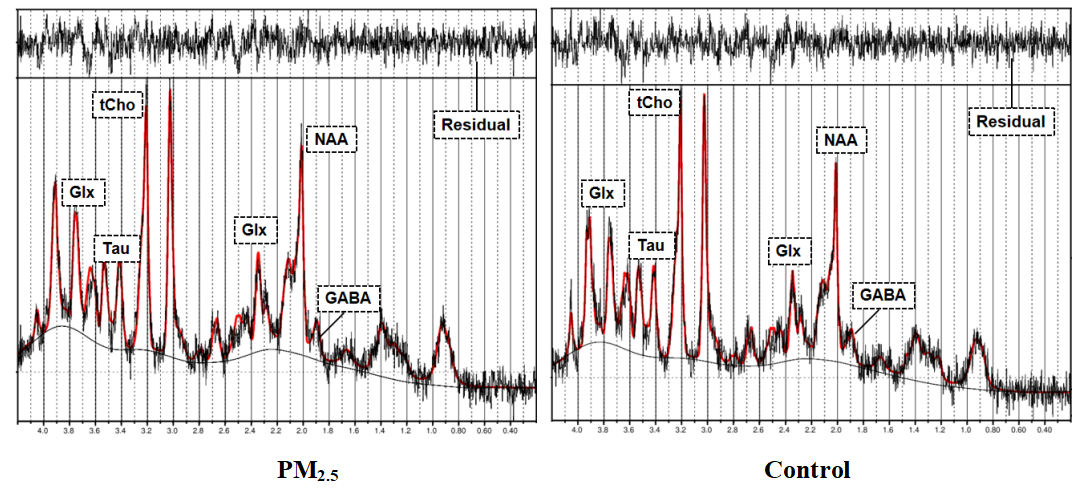
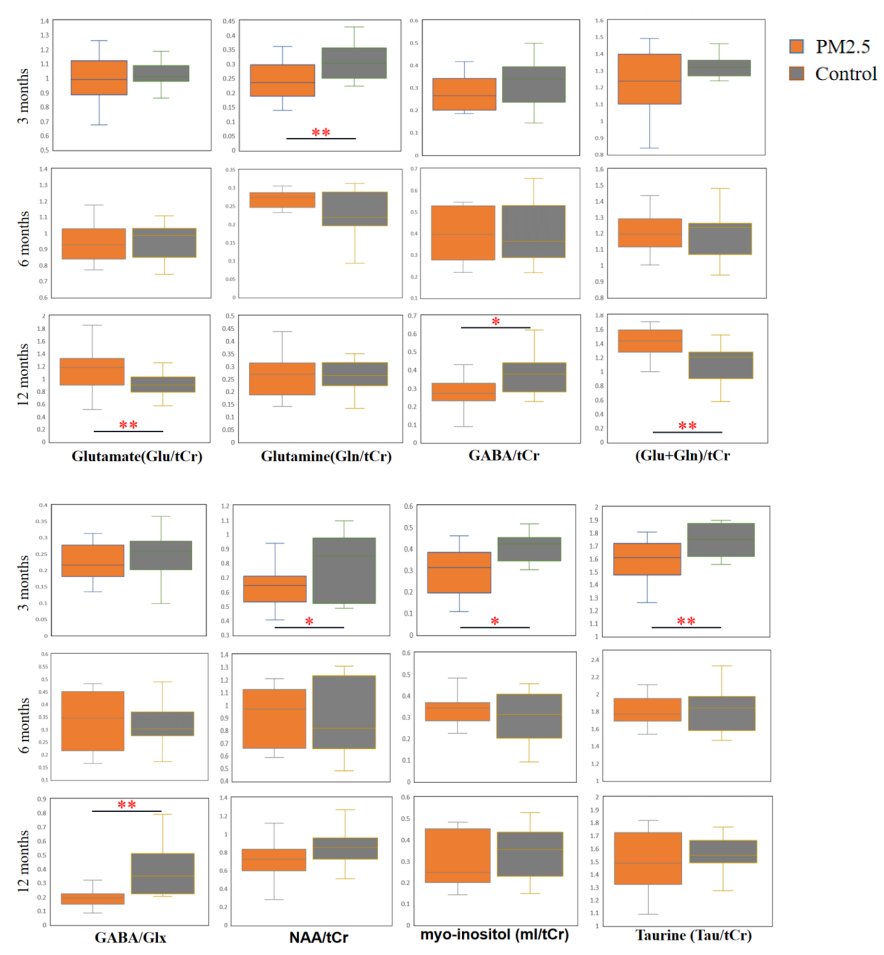
The VOI for 1H-MRS measurement were located on olfactory bulb (Figure 1). Figure 2 shows the representative 1H-MRS fitting results between exposure group and control group. As shown in Figure 3, compared with the control group, the exposure group shows significantly lower GABA/tCr levels (P=0.02) in the 12th month, but no significant alteration in the 3rd and 6th month. By contrast, the exposure group shows a significant increase of (Glu+Gln)/tCr levels in the 12th month (P=0.008). Note that as for NAA/tCr, mI/tCr, and Tau/tCr, compared with the control group, the exposure group shows a significant decrease (NAA: P=0.03; mI: P=0.03; Tau: P=0.008) in the 3rd month. Furthermore, we observed significantly higher Glu/tCr in the 12th month (P=0.01) and lower Gln/tCr in the 3rd month (P=0.007) in the exposure group. These results indicate that metabolic profiles in olfactory bulb are different between the exposure group and control group of different exposure duration.Glu serves as the main excitatory neurotransmitter, while GABA serves as the inhibitory neurotransmitter in the brain. Our results demonstrate that the effects of PM2.5 exposure on excitatory and inhibitory neurotransmitters vary in different exposure time durations. The longitudinal difference indicates that the influence of PM2.5 on brain may increase with the increase of exposure time. MI levels may have implications in the grading of cerebral astrocytomas [6]. The concentration change of mI may suggest that PM2.5 has a negative impact on neuroglial cells. As a neuronal biomarker, the concentration of NAA usually reflects neuronal density and viability [7]. The decrease of NAA in the exposure group may suggest impaired neuronal viability due to PM2.5. The reason for the decrease of Tau in the exposure group remains unclear. One possible explanation is that dynamic diffusion of these molecules occurred during exposure [8].
Conclusion
In this work, we developed an air enrichment system to concentrate PM2.5. Using 1H-MRS, we successfully observed the brain metabolic profile of olfactory bulb in PM2.5-exposed mice, and found the concentration changes of some key metabolites in the brain, indicating that PM2.5 has a non-negligible impact on brain metabolism.Acknowledgements
This work was supported in part by grants from the National Natural Science Foundation of China (81873893), Shanghai Municipal Science and Technology Major Project (No.2018SHZDZX01), ZJLab, and Shanghai Center for Brain Science and Brain-Inspired Technology.References
1. Detour J, Elbayed K, Piotto M, Moussallieh FM, Nehlig A, Namer IJ. Ultra fast in vivo microwave irradiation for enhanced metabolic stability of brain biopsy samples during HRMAS NMR analysis. J Neurosci Methods. 2011;201(1):89-97.
2. Epstein AA, Narayanasamy P, Dash PK, et al. Combinatorial assessments of brain tissue metabolomics and histopathology in rodent models of human immunodeficiency virus infection. J Neuroimmune Pharmacol. 2013;8(5):1224-1238.
3. Sun Q, Wang A, Jin X, Natanzon A, Duquaine D, Brook RD, Aguinaldo JG, Fayad ZA, Fuster V, Lippmann M, Chen LC, Rajagopalan S. Long-term air pollution exposure and acceleration of atherosclerosis and vascular inflammation in an animal model. JAMA. 2005 Dec 21;294(23):3003-10.
4. Sun Q, Yue P, Deiuliis JA, Lumeng CN, Kampfrath T, Mikolaj MB, Cai Y, Ostrowski MC, Lu B, Parthasarathy S, Brook RD, Moffatt-Bruce SD, Chen LC, Rajagopalan S. Ambient air pollution exaggerates adipose inflammation and insulin resistance in a mouse model of diet-induced obesity. Circulation. 2009 Feb 3;119(4):538-46.
5. Xu X, Liu C, Xu Z, Tzan K, Zhong M, Wang A, Lippmann M, Chen LC, Rajagopalan S, Sun Q. Long-term exposure to ambient fine particulate pollution induces insulin resistance and mitochondrial alteration in adipose tissue. Toxicol Sci. 2011 Nov;124(1):88-98.
6. Parthasarathy LK, Seelan RS, Tobias C, Casanova MF, Parthasarathy RN. Mammalian inositol 3-phosphate synthase: its role in the biosynthesis of brain inositol and its clinical use as a psychoactive agent. Subcell Biochem. 2006;39:293-314.
7. Moffett JR, Arun P, Ariyannur PS, Namboodiri AMA. N-Acetylaspartate reductions in brain injury: impact on post-injury neuroenergetics, lipid synthesis, and protein acetylation. Front Neuroenergetics. 2013;5(DEC):1-19.
8. Baxter CF, Parsons JE, Oh CC, Wasterlain CG, Baldwin RA. Changes of amino acid gradients in brain tissues induced by microwave irradiation and other means. Neurochem Res. 1989;14(9):909-913.
Figures