3752
Can dynamic gadoxetic acid-enhanced MRI combined with water specific T1 mapping predict the early-stage of Nonalcoholic Steatohepatitis in rat?1Shenzhen Institute of Advanced Technology, Chinese Academy of Sciences, Shenzhen, China, 2Peking University People's Hospital, Beijing, China
Synopsis
Keywords: Contrast Agent, Liver
The early detection of the inflammation and fibrosis grade are important to Nonalcoholic steatohepatitis (NASH) patients. Gadoxetic acid with MRI T1 quantitation is one of promising noninvasive method. However, intracellular hepatocyte lipid is a confounding factor for the accurate T1 quantitation in NASH case. Here, we used a water specific T1 (wT1) mapping with dynamic gadoxetic acid enhanced MRI in a rat NASH model induced by MCD diet. The results demonstrated that gadoxetic acid was not helpful to differentiate the inflammation and fibrosis severity in the early stage of NASH in rats.Introduction
Nonalcoholic steatohepatitis (NASH) is symptomless and may progress silently toward cirrhosis. The noninvasive assessment of liver progression is critical in the early-stage NASH. It has been reported that gadoxetic acid (Gd-EOB-DTPA) can differentiate NASH from fatty liver or stage advanced fibrosis in NASH1. However, intracellular hepatocyte lipid is a confounding factor for the accurate T1 quantitation in NASH case2. In this study, we aim to evaluate the feasibility of dynamic Gd-EOB-DTPA-enhanced MRI combined with a water specific T1 (wT1) mapping technique, which can address the interference of liver steatosis by calculated T1 solely depend on the water component of liver3, for staging of inflammation and fibrosis grade at early stage of NASH using a rat model.Materials and Methods
Animal Model Total of 65 male Wistar rats approximately 4 weeks old were received care in accordance with the Guidance Suggestions for the Care and Use of Laboratory Animals. Rats were divided into two groups: Control group (n = 10) fed with a standard chow ad libitum and NASH group (n = 55) fed with a methionine-choline deficient (MCD) diet (Research Diets Inc., A02082002BR) for 2, 4, 5, 6, 8 weeks, respectively.Image Acquisition and Analysis The animals were underwent a 3.0 T clinical MR scanner (uMR790, United imaging healthcare) with a twelve-channel small animal coil. The multi-echo variable flip angle GRE (VFA-GRE) sequence was performed before and after the tail vein injection of 0.125 mmol/kg Gd-EOB-DTPA (Primovist; Bayer Healthcare) manually. The parameters of the VFA-GRE were: TR = 20.5 ms, TE = 3.45/4.92/6.39/7.86/9.33/10.8 ms, slice thickness = 2 mm, slice number = 1, flip angle = 3°/7°/11°/15°, FOV = 80 × 60 mm, matrix = 128 × 96, ten averages, acceleration rate was 2, and acquisition time was 1 minute. The VFA-GRE sequence was continuously repeated for 40 times after Gd-EOB-DTPA administration.
Water-only images were firstly obtained through the fat-water separation algorithm proposed by our group using the multi-echo images under each flip angle. The water specific T1 (wT1) mapping of liver was then fitted from these water images under varying flip angles. The reduction rate of wT1 (rrT1) was calculated at each time point after the contrast enhancement as follows:rrT1 (%) = (T1pre -T1post) / T1pre X 100%, where T1pre and T1post are the wT1 relaxation times of the pre- and post-Gd-EOB-DTPA injection, respectively.
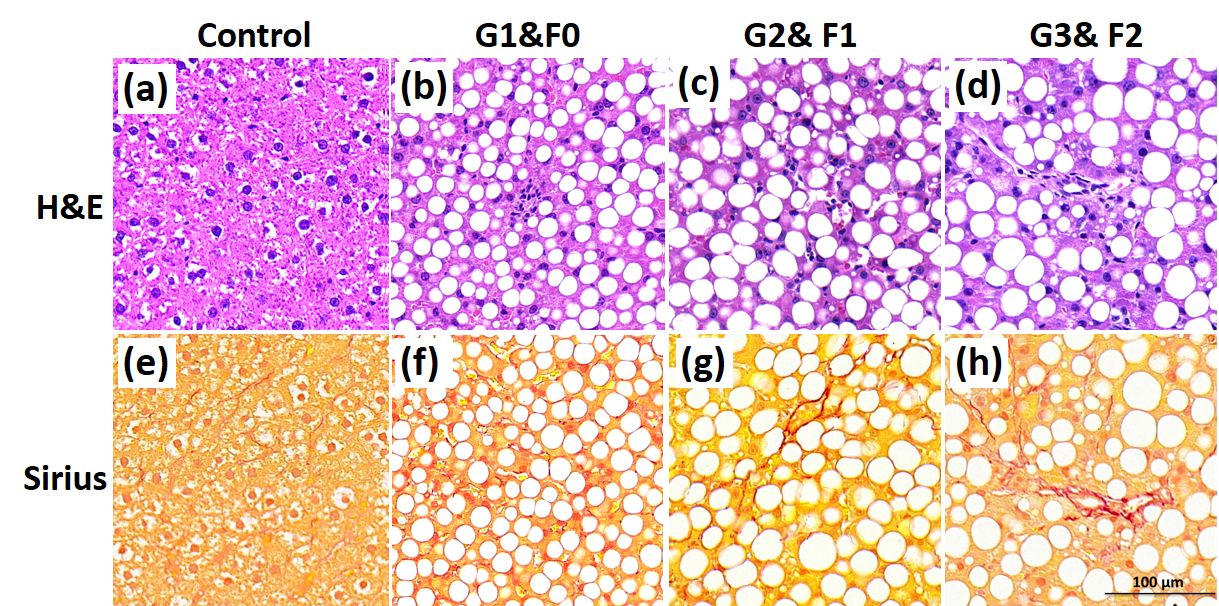
Histological and Pathological analysis Liver sections stained with H&E and Sirius red to observe the hepatic pathologic structure and liver fibrosis. The liver pathological score was classified according to the NASH Clinical Research Network (CRN) histological scoring system: lobular inflammation grade (G) was scored with G0 (none); G1 (mild): < 2 foci per 20 x field; G2 (moderate): 2-4 foci per 20 x field; G3 (severe): >4 foci per 20 x field and the fibrosis grade (F) was evaluated with F0-none; F1- perisinusoidal or periportal fibrosis; F2- perisinusoidal and periportal fibrosis.
Results
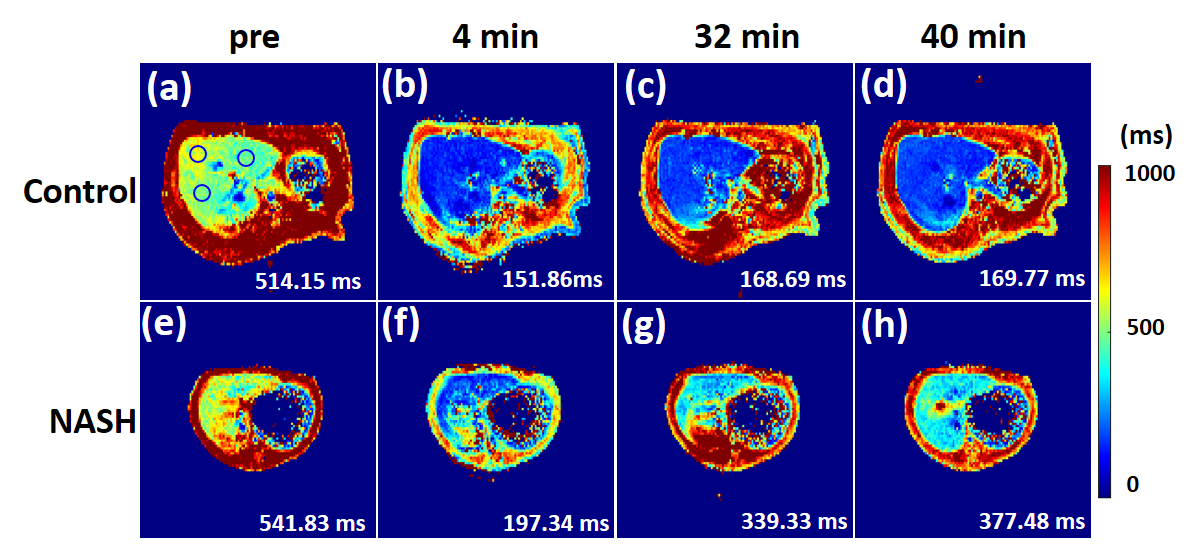
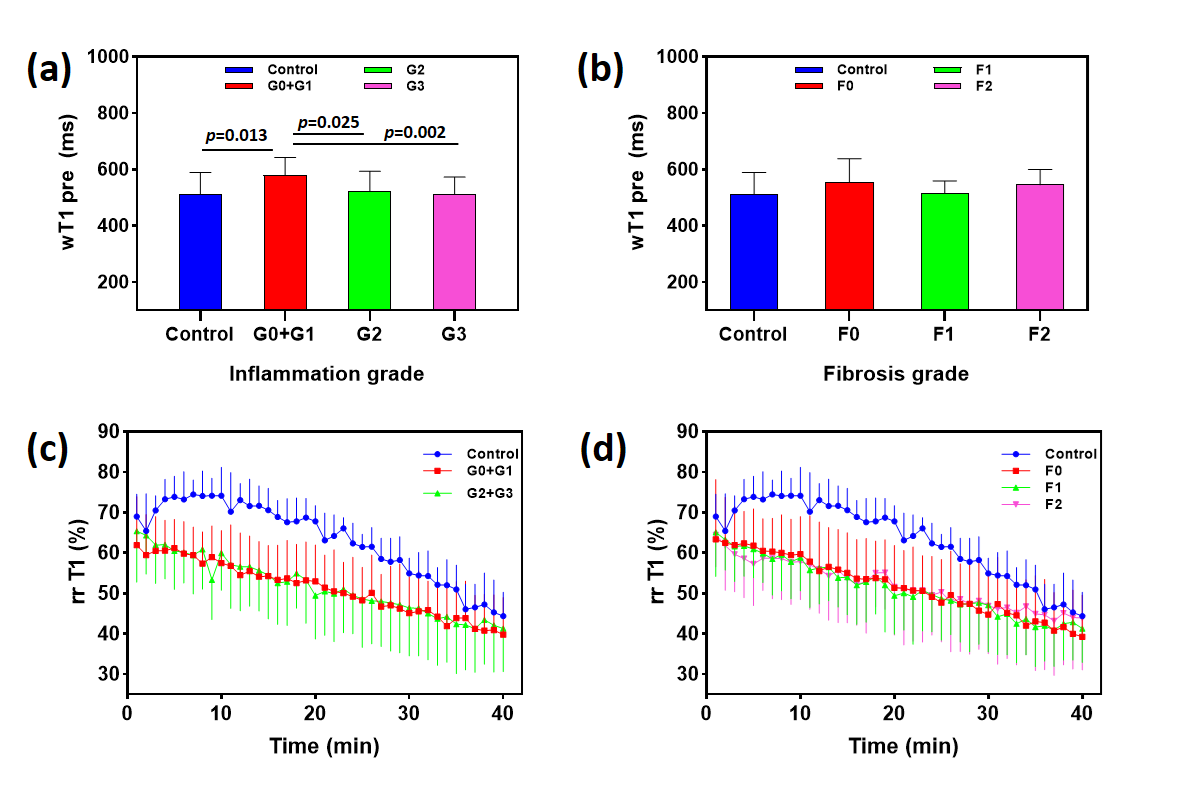
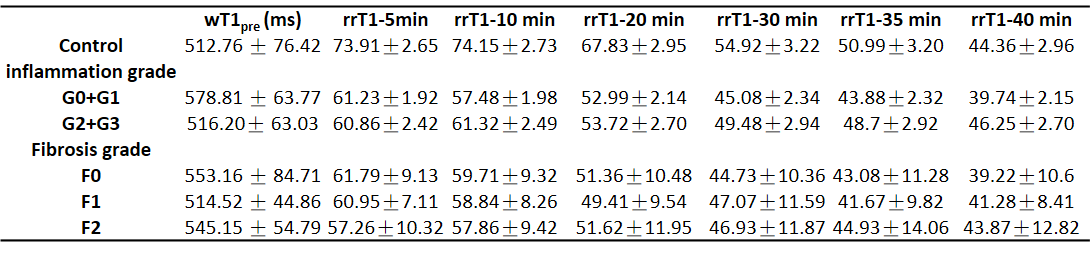
Histology of Experimental Mode The histopathological results are presented in Figure 1. The rats in NASH study were categorized as follows: steatosis (S3 = 54); inflammatory stage (G0=4, G1=15, G2=12, G3=23) and fibrosis stage (F0=26, F1=19, F2=9).T1 Relaxation Time Measurements Typical wT1 images are shown in Figure 2. The wT1pre and rrT1 classified by inflammation (G) or fibrosis (F) are shown in Figure 3. It is shown that the wT1pre of G0+G1 was significant higher compared with other groups (Fig. 3a), however, there was no significant difference between any fibrosis groups (Fig. 3b). After the infusion of the Gd-EOB-DTPA, the rrT1 had almost entirely overlaps among hepatic inflammation or fibrosis stages (Fig.3c-d). There was no significant difference of rrT1 in each group by the multiple comparison analysis. The representative wT1pre or rrT1 at several time points are provided in Table 1.
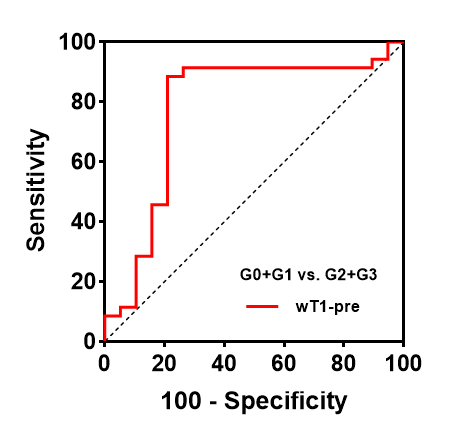
ROC analysis The wT1pre is used to differentiate rats with G2+G3 from G0+G1 with areas under the ROC curve (AUROC) of 0.78 (95% CI: 0.66-0.93), with a sensitivity of 88.57%, a specificity of 78.95% and a cutoff value of 562.4 msec (Fig. 4).
Conclusions
In this study, we aimed to evaluate the feasibility of gadoxetic acid with water specific T1 (wT1) technique for the noninvasive assessment of early stage NASH using methionine-choline deficient diet-induced NASH rats. The main results indicated that the administration of gadoxetic acid was not helpful to differentiate the inflammation and fibrosis severity or progression in the early stage of NASH in rats.Acknowledgements
This work was partially supported by NSFC (81971737) and the Key Laboratory for Magnetic Resonance and Multimodality Imaging of Guangdong Province (2020B1212060051).References
1. Bastati N, Feier D, Wibmer A, et al. Noninvasive differentiation of simple steatosis and steatohepatitis by using gadoxetic acid-enhanced MR imaging in patients with nonalcoholic fatty liver disease: a proof-of-concept study. Radiology 2014;271:739-747.
2. Ahn JH, Yu JS, Park KS, et al. Effect of hepatic steatosis on native T1 mapping of 3T magnetic resonance imaging in the assessment of T1 values for patients with non-alcoholic fatty liver disease. Magnetic resonance imaging 2021;80:1-8.
3. Wan Q, Peng H, Lyu J, et al. Water Specific MRI T1 Mapping for Evaluating Liver Inflammation Activity Grades in Rats With Methionine-Choline-Deficient Diet-Induced Nonalcoholic Fatty Liver Disease. Journal of magnetic resonance imaging : JMRI 2022;56:1429-1436.
Figures