3749
Fractional order calculus model in liver cancer with immunohistochemical indexes CK19 and Hep par-1: a preliminary animal study1The First Affiliated Hospital of Guangxi Medical University, Nanning, China, 2Siemens Healthineers, Wuhan, China
Synopsis
Keywords: Liver, Diffusion/other diffusion imaging techniques
The purpose of this study was to explore the feasibility of preoperative non-invasive evaluation of immunohistochemical indexes of hepatocellular carcinoma, CK19 and Hep par-1 positive, with Fractional Order Calculus (FROC) model using nude mice model. Results showed that the diffusion coefficient D and fractional order derivative in space β had statistically significant differences and good diagnostic performances between the CK19 and Hep par-1 positive groups. These finding showed that FROC is useful diffusion model and D and β are useful biomarkers in liver cancer with expression of the immunohistochemical indexes CK19 and Hep par-1.Introduction
Primary liver cancer is the fourth most common malignant tumor and the second leading cause of tumor death in China.1 Pathological diversity and complex immunohistochemical expression are important factors leading to poor clinical prognosis of liver cancer.2 Previous studies found that it was more aggressive and more resistant to chemotherapeutic drugs for hepatocellular carcinoma with positive expression of CK19, which was positively correlated with microvascular invasion and an independent risk factor for overall survival of patients.3,4 Hep par-1 in hepatocellular carcinoma suggests hepatocellular differentiation, and positive Hep par-1 is closely related to tumor differentiation.5 Previous studies found that the parameters from mono-exponential model and diffusion kurtosis imaging were correlated with histological classification,6,7 Recently, fractional order calculus (FROC) model were developed and applied in the tumor studies 8,9. FROC model yields a new set of parameters to describe the anomalous diffusion process in complex biologic tissues: diffusion coefficient (D), which is measured in square micrometers per millisecond; fractional order derivative in space (β); and a spatial parameter (μ), which is measured in micrometers. This study aimed to construct an animal model of liver cancer to demonstrate the diagnostic accuracy of the FROC model for differentiating different immunohistochemical positive indicators, CK19 and Hep par-1.Methods
Twenty female BALB/ C nude mice (4-5 weeks of age) of the same specific pathogen-free (SPF) were anesthetized, disinfected and turned on to their abdomen, and then the right liver of 10 mice were injected with hepatoma cell MHCC97H (for CK19 positive), and other 10 mice with HepG2 cells (for Hep par-1 positive). Then the nude mice were put back into the cage for SPF feeding. After 2-3 weeks, if the obvious masses with diameter ≥1cm appeared, the modeled nude mice underwent multi-b DWI scanning on a 3T MRI scanner (MAGNETOM Prisma, Siemens Healthcare, Erlangen, Germany) with a special coil for mice. Imaging parameters were as follows: TR/TE=2120/54 ms, matrix=96×100, FOV=96×100mm2, layer thickness=1.2 mm, layer spacing=0, b values=0, 50, 100, 150, 200, 600, 1000, 1500, 2000 s/mm2. Then the quantitative parameters from FROC models (D, β, and μ) were post-processed using a home-made software. Regions of interest of the lesion area included at least half of the maximum cross-section of the tumor tissue. After the scanning, the tumor tissue of nude mice was fully fixed with 4% paraformaldehyde for 24 hours, then it was embedded in paraffin and sliced. CK19 and Hep par-1 immunohistochemical staining were performed. Statistical analysis was performed on the SPSS software (version 19.0; IBM, Armonk, New York). Mann-Whitney U test and receiver operator characteristic (ROC) curve were used to assess the difference and diagnosis performance for quantitative parameters.Results
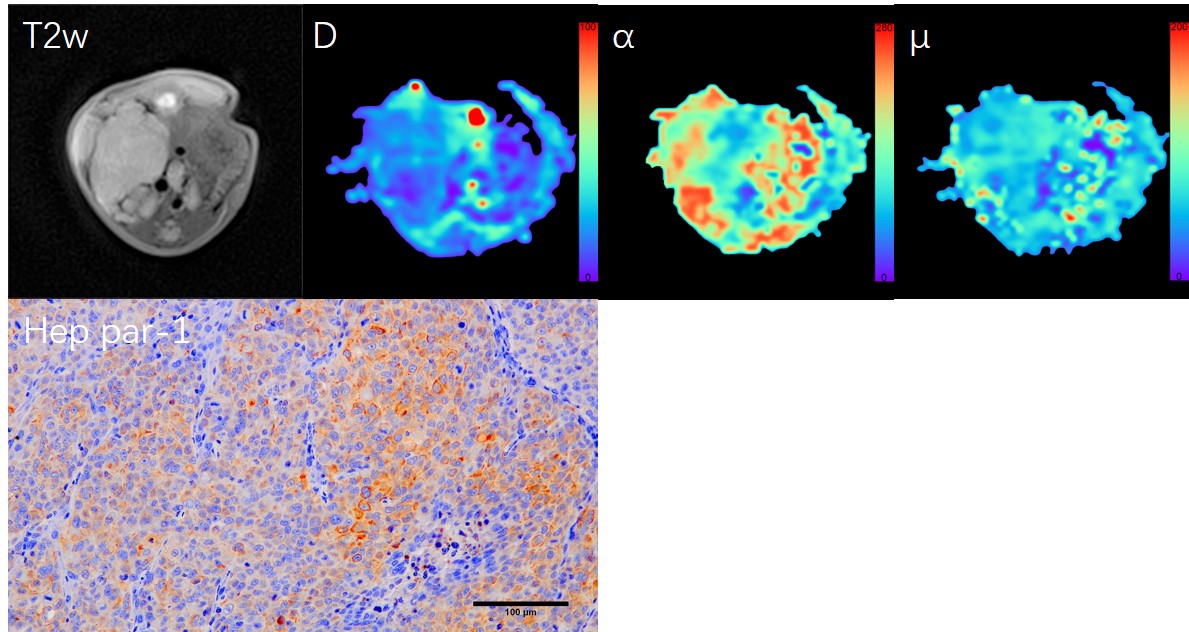
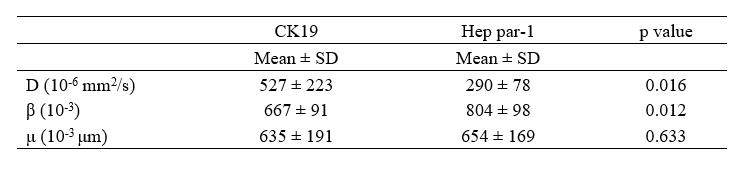
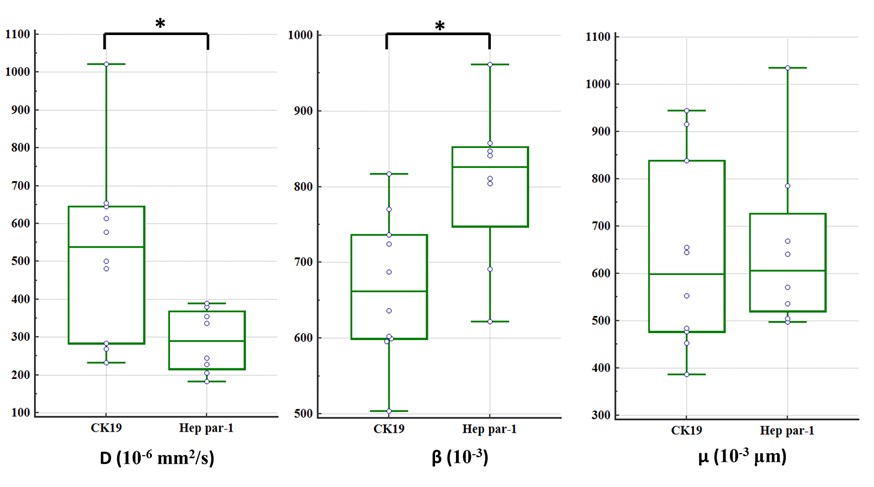
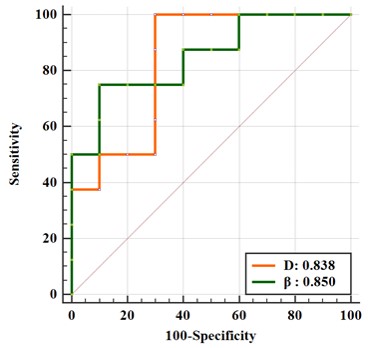
The immunohistochemical results showed that CK19 and Heppar-1 was positive in mice injected with MHCC97H and HepG2, respectively, meaning mice models were successfully established. There were significant differences in D and β between the CK19 and Heppar-1 groups (p<0.05), but μ had no significant difference between the two groups (Table 1). Representative parameter maps are shown in Figure 1 and Figure 2. The area under the curve (AUC) of D and β were 0.838 and 0.850, respectively.Discussion
In the study, we investigate the values of FROC model in mice with liver cancer with different immunohistochemical indexes, CK19 and Hep par-1. The results showed FROC model was a useful method in differentiating CK19 group from Heppar-1 group in nude mice. In histopathology, the cancer cells in Hep par-1 positive group were polygonal, numerous and densely arranged, and the cytoplasm is rich and eosinophilic, arranged into liver plate like beam cable structure. While the cancer cells in the CK19 positive group are mostly tubular or papillary structures composed of high columnar epithelium and cuboidal epithelium, and more fibrous stroma. Compared to CK19 positive group, the significant decreased diffusion coefficient in Hep par-1 positive group may be caused by its numerous and densely arranged structure, which can easily hinder water diffusion. In addition, the β also had significant differences and good diagnosis performances between the two group. Previous human studies have proved that β can reflect the intravoxel tissue structural heterogeneities, and it is a useful biomarker for identification of tumors.8,9 The results of our animal study with different cancer cell structure better confirmed their conclusion.Conclusion
FROC model can non-invasively evaluate the liver cancer with CK19 and Hep par-1 positive immunohistochemical indexes.Acknowledgements
This work was supported by the National Natural Science Foundation of China and the Innovation Project of Guangxi Graduate Education (Grant numbers 8203101220038D and YCSW2022228).References
1. Konyn P, Ahmed A, Kim D. Current epidemiology in hepatocellular carcinoma [published online ahead of print, 2021 Oct 22]. Expert Rev Gastroenterol Hepatol. 2021;1-13. doi:10.1080/17474124.2021.1991792
2. El Jabbour T, Lagana SM, Lee H. Update on hepatocellular carcinoma: Pathologists' review. World J Gastroenterol. 2019;25(14):1653-1665. doi:10.3748/wjg.v25.i14.1653
3. Fatourou E, Koskinas J, Karandrea D, et al. Keratin 19 protein expression is an independent predictor of survival in human hepatocellular carcinoma. Eur J Gastroenterol Hepatol 2015, 27(9): 1094-1102.
4. Govaere O, Komuta M, Berkers J, et al. Keratin 19: a key role player in the invasion of human hepatocellular carcinomas. GUT 2014, 63(4): 674-685.
5. Atta IS. Efficacy of expressions of Arg-1, Hep Par-1, and CK19 in the diagnosis of the primary hepatocellular carcinoma subtypes and exclusion of the metastases [published online ahead of print, 2021 Jul 13]. Histol Histopathol. 2021;18361. doi:10.14670/HH-18-361
6. Wang GZ, Guo LF, Gao GH, et al. Magnetic Resonance Diffusion Kurtosis Imaging versus Diffusion-Weighted Imaging in Evaluating the Pathological Grade of Hepatocellular Carcinoma. Cancer Manag Res. 2020;12:5147-5158. Published 2020 Jun 29. doi:10.2147/CMAR.S254371
7. Cao L, Chen J, Duan T, et al. Diffusion kurtosis imaging (DKI) of hepatocellular carcinoma: correlation with microvascular invasion and histologic grade. Quant Imaging Med Surg. 2019;9(4):590-602. doi:10.21037/qims.2019.02.14
8. Yi Sui, He Wang, Guanzhong Liu G, Damen FW, et al. Differentiation of Low- and High-Grade Pediatric Brain Tumors with High b-Value Diffusion-weighted MR Imaging and a Fractional Order Calculus Model. Radiology. 2015 Nov;277(2):489-96. doi: 10.1148/radiol.2015142156.
9. Chen W, Zhu L, Dai Y, et al. Differentiation of salivary gland tumor using diffusion-weighted imaging with a fractional order calculus model. Br J Radiology. 2020 Sep 1;93(1113):20200052. doi: 10.1259/bjr.20200052
Figures