3744
ALAw-CEST MRI of the ASCT2 transporter in a mouse model of prostate cancer1Johns Hopkins University, Baltimore, MD, United States, 2Kennedy Krieger Institute, Baltimore, MD, United States
Synopsis
Keywords: Cancer, Preclinical, Prostate Cancer
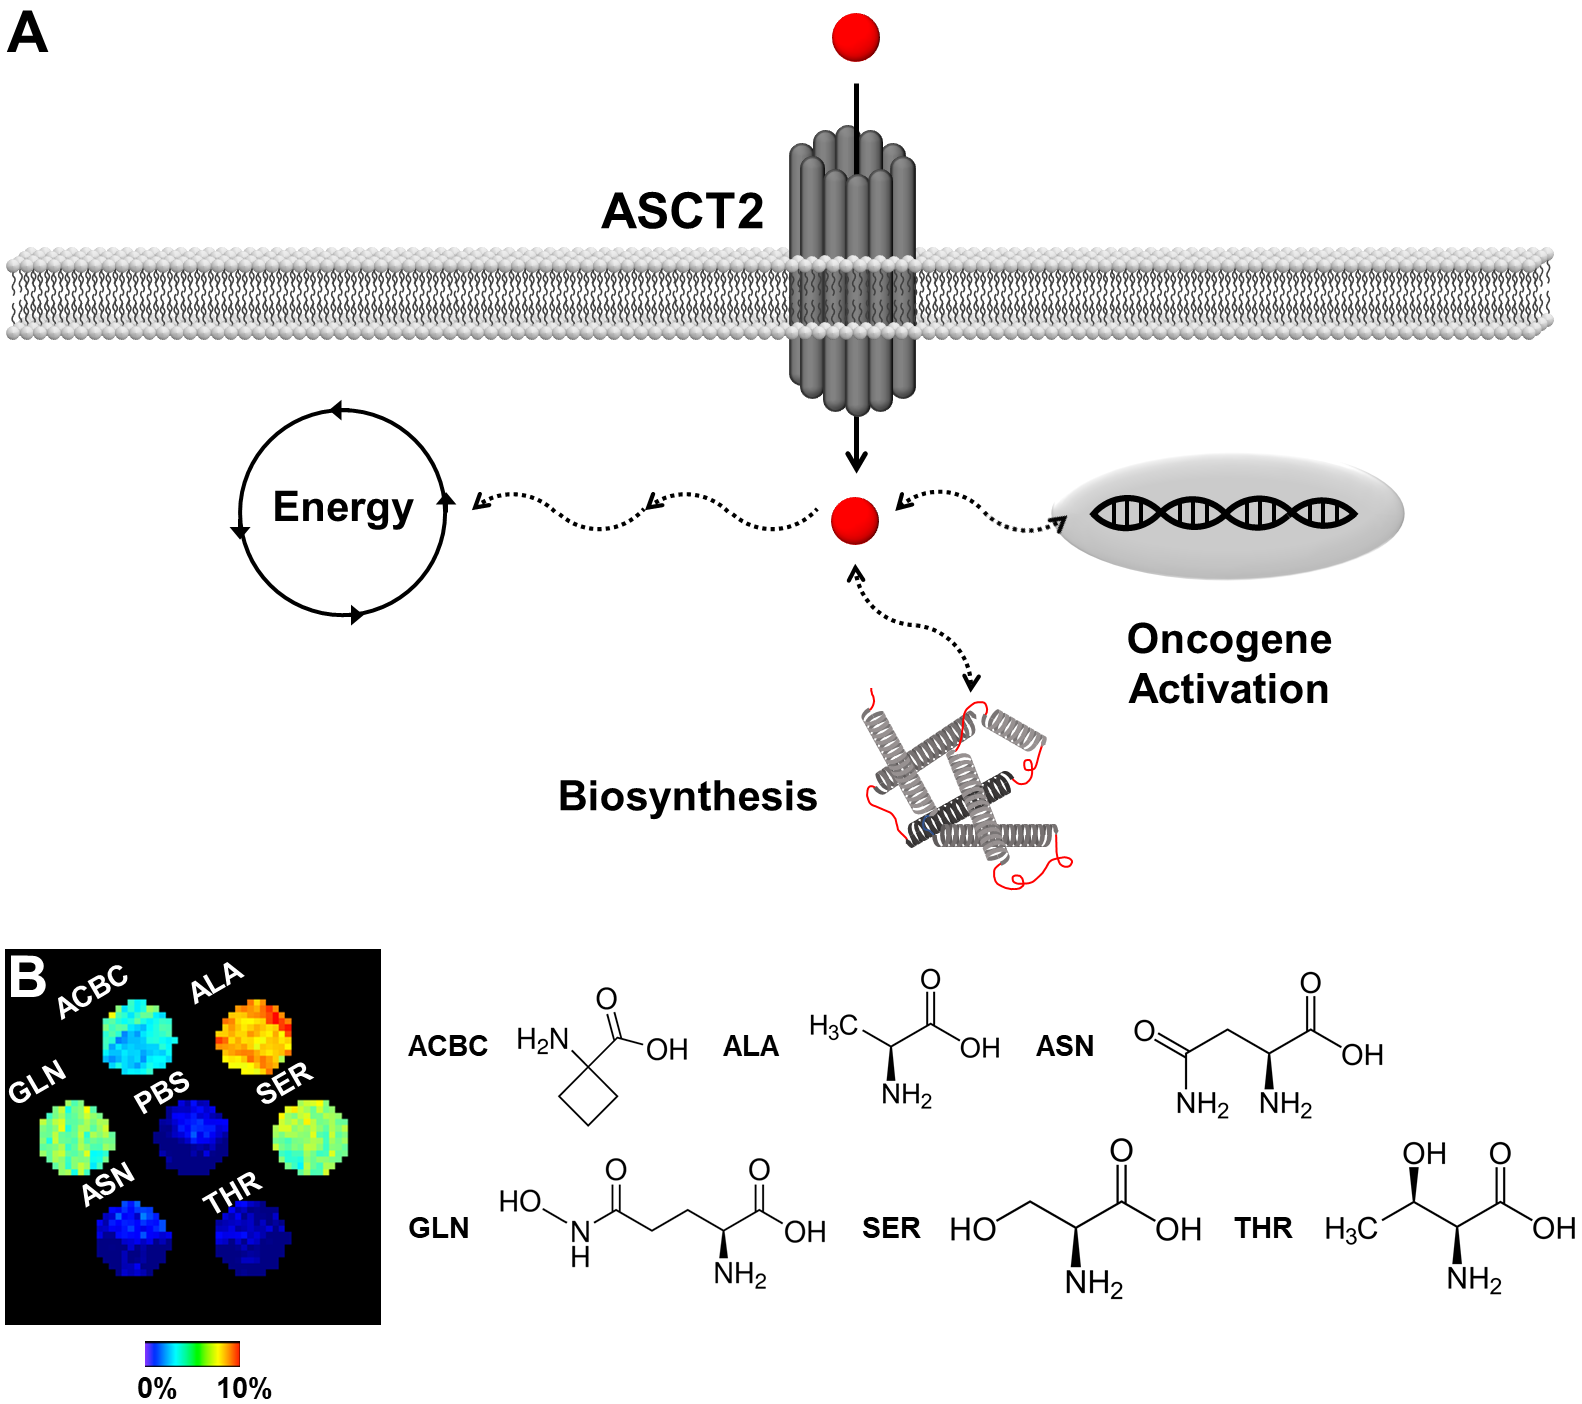
Increased utilization of glutamine is characteristic of many advanced, aggressive cancers. Established glutamine imaging strategies require the use of labeled probes (positron emission tomography, hyperpolarized spectroscopy) that can limit their accessibility. Here, we investigated the utility of chemical exchange saturation transfer (CEST) MRI upon intravenous injection of unlabeled alanine to monitor differences in cellular glutamine uptake as a potentially complementary imaging biomarker for profiling cancers and monitoring their progression.Introduction
Alanine serine cysteine transporter 2 (ASCT2) is the primary transporter for glutamine and a prognostic marker for many cancers1-4. Immunohistochemical grading is the current metric for evaluating ASCT2 clinically; however, in vivo imaging can provide a spatiotemporal profile of this biomarker in the context of the tumor microenvironment. Current clinical strategies for imaging glutamine in vivo utilize isotopic5 or radio-labeled6 probes derived primarily from these substrates. CEST MRI can detect alanine, a well-recognized substrate for ASCT27, without modification or the need for specialized equipment by exploiting the water-exchanging protons in its amine group8-10. Alanine has already been intravenously injected at a dose of 6 mmoles/kg into humans for other applications without symptoms11. We investigated the utility of CEST MRI to evaluate ASCT2 by comparing LNCaP and DU-145 prostate cancer cells, which are known to have higher and lower ASCT2 expression, respectively12-13.Methods
Prostate cancer model: DU-145 (2-3x10⁶; n=9) or LNCaP (3-5x10⁶; n=8) cells were subcutaneously injected into 6-10 week old Rag2-/- mice.Immunostaining: Samples were stained with rabbit anti-ASCT2 (Cell Signaling Technology, clone v501) and/or rat anti-CD31 (Novus Biologicals, NB600-1475).
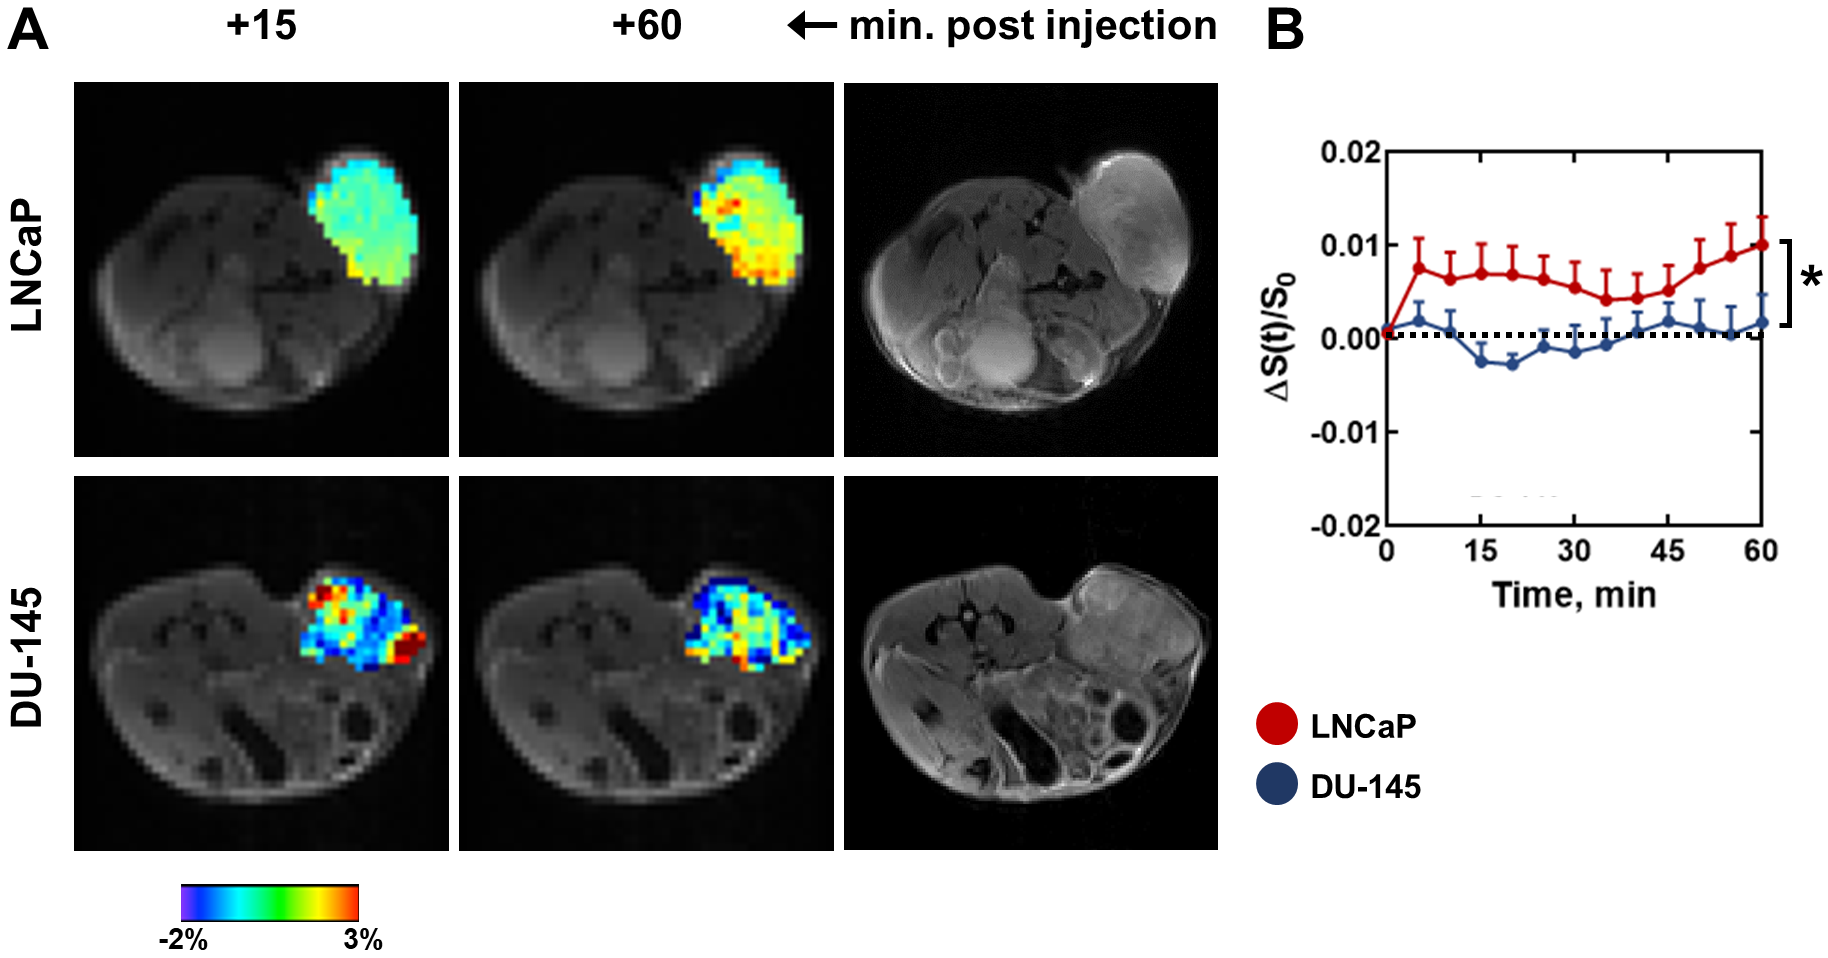
CEST MRI: Mice were imaged using a Bruker 11.7T horizontal bore spectrometer and an 8-channel TR coil. Dynamic CEST images were collected at the +3.1 ppm amine proton frequency (B1 = 3.6 μT, tsat = 3 s) prior to intravenous alanine injection (6 mmole/kg) to establish a baseline and over a period of 60 minutes after injection. Dynamic CEST enhancement (ΔS(t)/S0) was quantified by subtracting the signal (S/S0) at time t from the average signal obtained prior to injection.
Statistics: An ANOVA or Student’s t-test was performed, as appropriate, with p<0.05 considered significant.
Results
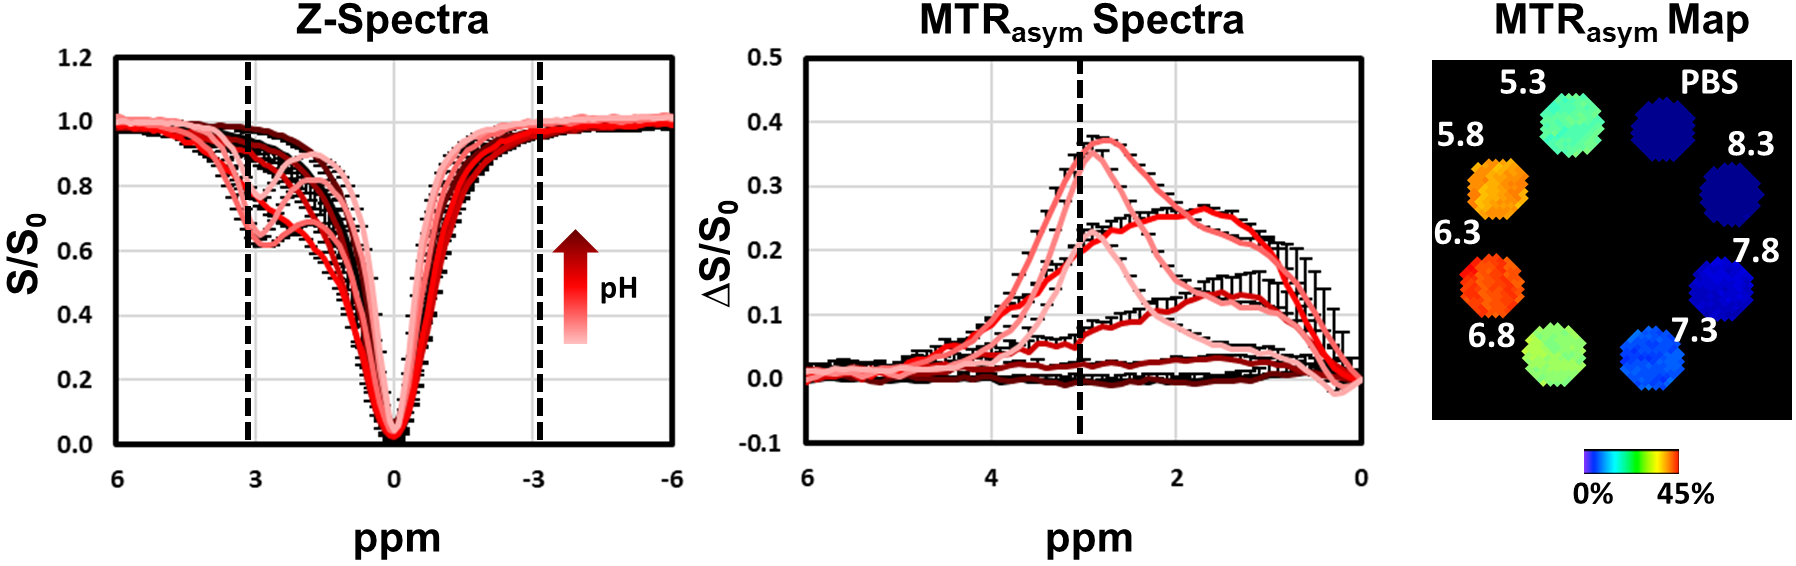
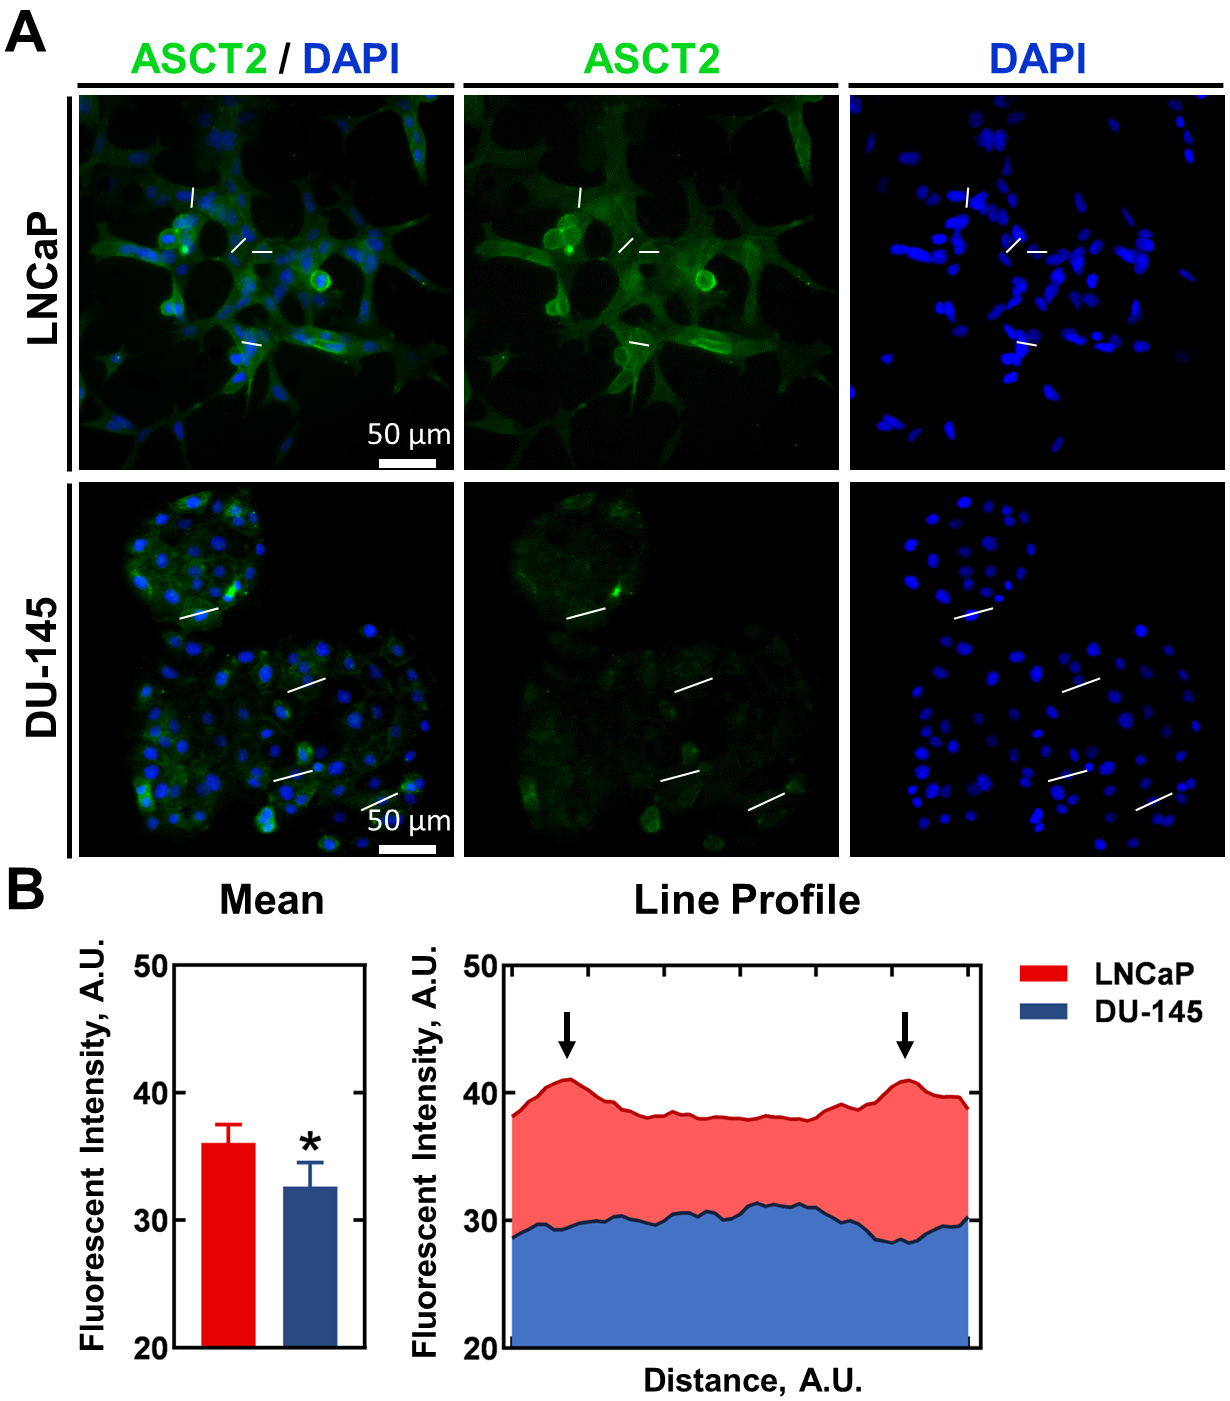
We first screened the CEST signal generated at pH 7.3 by naturally-occurring ASCT2 substrates (20 mM) in phantoms (Figure 1). Alanine generated higher CEST signal compared to glutamine, asparagine, serine, and threonine. 1-aminocyclobutane carboxylic acid, the precursor of glutamine PET probe fluciclovine, is included for comparison. Subsequently, we expanded our investigation of alanine at cancer-relevant pH values (from 5.3 to 8.3; Figure 2). For the majority of this range, alanine (20 mM) generated CEST contrast above baseline (PBS).We then quantified the expression of ASCT2 in the prostatic cancer cell lines DU-145 and LNCaP (Figure 3). The average intensity of ASCT2 in LNCaP was 11% higher than that of DU-145. Since ASCT2 function requires translocation to the plasma membrane14, we also investigated the intensity across the cellular space. A line profile revealed that for LNCaP the expression at the cell membrane was higher than that in the cytoplasm. It also revealed that LNCaP had higher fluorescent intensity compared to DU-145 throughout the cellular space.
We then investigated CEST signal enhancement at the +3.1 ppm frequency when alanine was administered intravenously (Figure 4). For DU-145 tumors, CEST signal was near baseline levels throughout the scan. For LNCaP tumors, CEST signal was enhanced throughout the 60-minute scan. CEST signal was significantly higher in LNCaP compared to DU-145 tumors at 60 minutes (p=0.012).
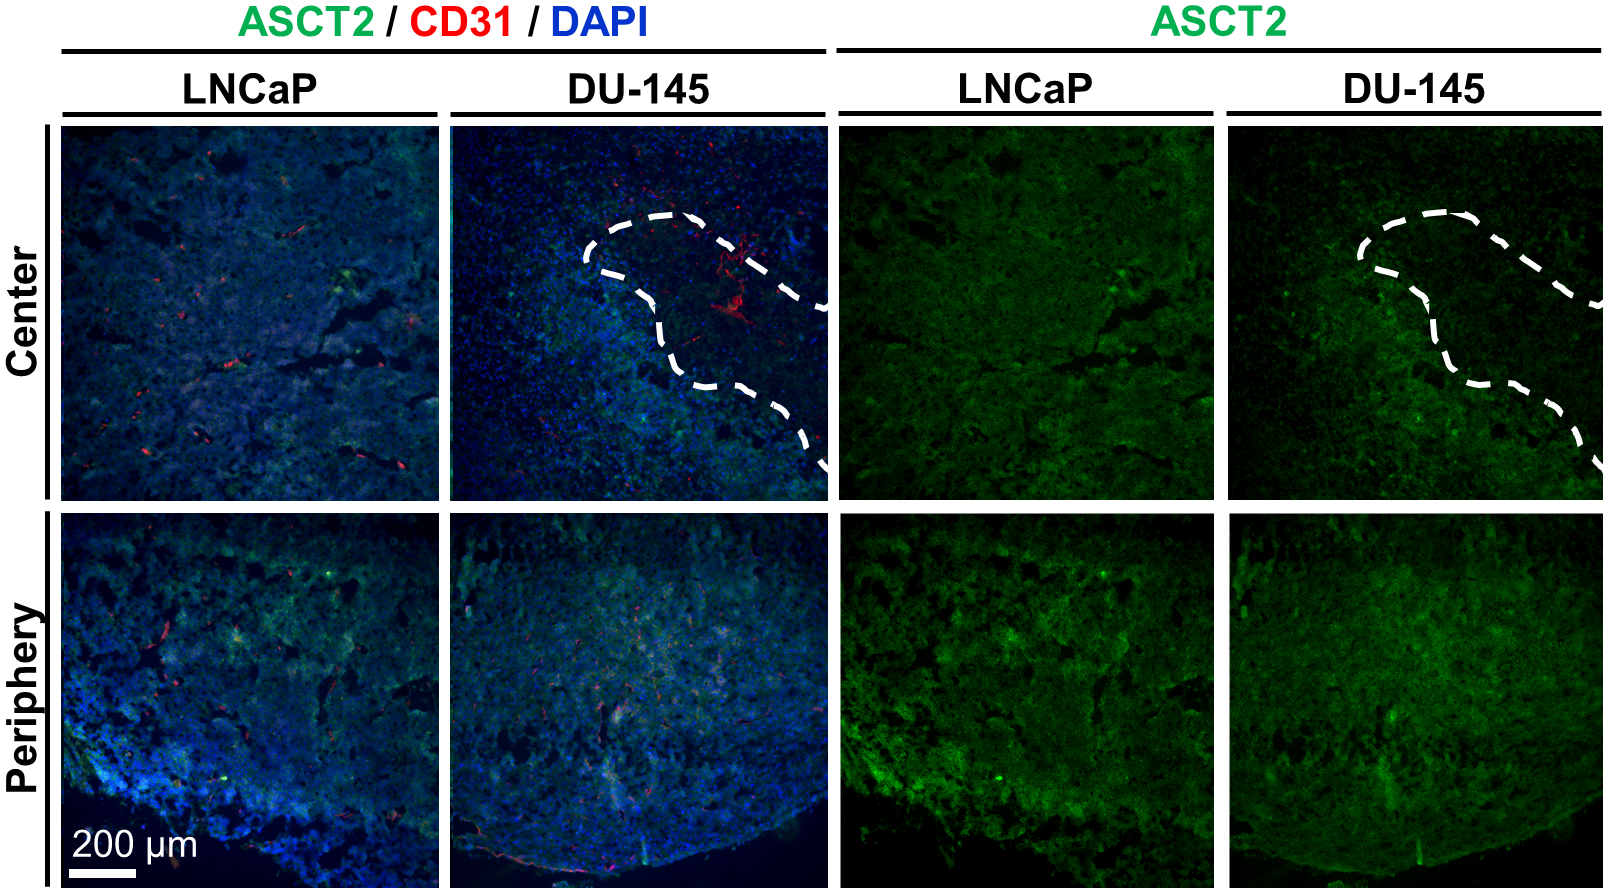
Lastly, we characterized ASCT2 and CD31 expression in LNCaP and DU-145 tumors (Figure 5) since differences in ASCT2 and vascular expression and/or function can contribute to the signal differences we observed. ASCT2 staining intensity in the periphery of DU-145 tumors was comparable to that in LNCaP tumors, but in the center of DU-145 tumors, staining levels were heterogenous proximal to necrotic (acellular) lesions. Endothelial (CD31) levels were generally comparable, in line with what is reported in the literature for these two tumor models15-18. Still, CD31 staining patterns were also heterogenous in the center of DU-145 tumors, but localized independently of ASCT2 staining.
Discussion and Conclusion
CEST MRI detected the higher uptake of unlabeled alanine, a naturally-occurring ASCT2 substrate, in LNCaP versus DU-145 tumors, as expected based on the uptake of [14C]-labeled glutamine and other ASCT2 substrates in vitro19-20. This work preliminarily demonstrates the potential of CEST MRI to noninvasively monitor ASCT2, a prognostic marker of many cancers and an active target for cancer therapy.Acknowledgements
This work was funded by the NIH (P41 EB024495, R01 EB030376, K01 EB030612).References
1. Sun, H.-W.; Yu, X.-J.; Wu, W.-C.; Chen, J.; Shi, M.; Zheng, L.; Xu, J., GLUT1 and ASCT2 as Predictors for Prognosis of Hepatocellular Carcinoma. PloS one 2016, 11 (12), e0168907.
2. Shimizu, K.; Kaira, K.; Tomizawa, Y.; Sunaga, N.; Kawashima, O.; Oriuchi, N.; Tominaga, H.; Nagamori, S.; Kanai, Y.; Yamada, M.; Oyama, T.; Takeyoshi, I., ASC amino-acid transporter 2 (ASCT2) as a novel prognostic marker in non-small cell lung cancer. British Journal of Cancer 2014, 110 (8), 2030-2039.
3. Luo, Y.; Li, W.; Ling, Z.; Hu, Q.; Fan, Z.; Cheng, B.; Tao, X., ASCT2 overexpression is associated with poor survival of OSCC patients and ASCT2 knockdown inhibited growth of glutamine-addicted OSCC cells. Cancer Medicine 2020, 9 (10), 3489-3499.
4. Bernhardt, S.; Bayerlová, M.; Vetter, M.; Wachter, A.; Mitra, D.; Hanf, V.; Lantzsch, T.; Uleer, C.; Peschel, S.; John, J.; Buchmann, J.; Weigert, E.; Bürrig, K.-F.; Thomssen, C.; Korf, U.; Beissbarth, T.; Wiemann, S.; Kantelhardt, E. J., Proteomic profiling of breast cancer metabolism identifies SHMT2 and ASCT2 as prognostic factors. Breast Cancer Research 2017, 19 (1), 112.
5. Gallagher, F. A.; Kettunen, M. I.; Day, S. E.; Lerche, M.; Brindle, K. M., 13C MR spectroscopy measurements of glutaminase activity in human hepatocellular carcinoma cells using hyperpolarized 13C-labeled glutamine. Magnetic Resonance in Medicine 2008, 60 (2), 253-257.
6. Cabella, C.; Karlsson, M.; Canapè, C.; Catanzaro, G.; Colombo Serra, S.; Miragoli, L.; Poggi, L.; Uggeri, F.; Venturi, L.; Jensen, P. R.; Lerche, M. H.; Tedoldi, F., In vivo and in vitro liver cancer metabolism observed with hyperpolarized [5-13C]glutamine. Journal of Magnetic Resonance 2013, 232, 45-52.
7. Foster, A. C.; Farnsworth, J.; Lind, G. E.; Li, Y.-X.; Yang, J.-Y.; Dang, V.; Penjwini, M.; Viswanath, V.; Staubli, U.; Kavanaugh, M. P., D-Serine Is a Substrate for Neutral Amino Acid Transporters ASCT1/SLC1A4 and ASCT2/SLC1A5, and Is Transported by Both Subtypes in Rat Hippocampal Astrocyte Cultures. PloS one 2016, 11 (6), e0156551.
8. Chen, J.; Yadav, N. N.; Stait-Gardner, T.; Gupta, A.; Price, W. S.; Zheng, G., Thiol-water proton exchange of glutathione, cysteine, and N-acetylcysteine: Implications for CEST MRI. NMR in Biomedicine 2020, 33 (1), e4188.
9. Cai, K.; Xu, H. N.; Singh, A.; Moon, L.; Haris, M.; Reddy, R.; Li, L. Z., Breast Cancer Redox Heterogeneity Detectable with Chemical Exchange Saturation Transfer (CEST) MRI. Molecular Imaging and Biology 2014, 16 (5), 670-679.
10. Walker-Samuel, S.; Ramasawmy, R.; Torrealdea, F.; Rega, M.; Rajkumar, V.; Johnson, S. P.; Richardson, S.; Gonçalves, M.; Parkes, H. G.; Årstad, E.; Thomas, D. L.; Pedley, R. B.; Lythgoe, M. F.; Golay, X., In vivo imaging of glucose uptake and metabolism in tumors. Nature Medicine 2013, 19 (8), 1067-1072.
11. Fernandes, J.; Blom, W., The intravenous L-alanine tolerance test as a means for investigating gluconeogenesis. Metabolism - Clinical and Experimental 1974, 23 (12), 1149-1156.
12. Wang, Q.; Hardie, R.-A.; Hoy, A. J.; van Geldermalsen, M.; Gao, D.; Fazli, L.; Sadowski, M. C.; Balaban, S.; Schreuder, M.; Nagarajah, R.; Wong, J. J.-L.; Metierre, C.; Pinello, N.; Otte, N. J.; Lehman, M. L.; Gleave, M.; Nelson, C. C.; Bailey, C. G.; Ritchie, W.; Rasko, J. E.; Holst, J., Targeting ASCT2-mediated glutamine uptake blocks prostate cancer growth and tumour development. The Journal of Pathology 2015, 236 (3), 278-289.
13. Cardoso, H. J.; Figueira, M. I.; Vaz, C. V.; Carvalho, T. M. A.; Brás, L. A.; Madureira, P. A.; Oliveira, P. J.; Sardão, V. A.; Socorro, S., Glutaminolysis is a metabolic route essential for survival and growth of prostate cancer cells and a target of 5α-dihydrotestosterone regulation. Cellular Oncology 2021, 44 (2), 385-403.
14. Console, L.; Scalise, M.; Tarmakova, Z.; Coe, I. R.; Indiveri, C., N-linked Glycosylation of human SLC1A5 (ASCT2) transporter is critical for trafficking to membrane. Biochimica et Biophysica Acta (BBA) - Molecular Cell Research 2015, 1853 (7), 1636-1645.
15. Mussawy, H.; Viezens, L.; Schroeder, M.; Hettenhausen, S.; Sündermann, J.; Wellbrock, J.; Kossow, K.; Schaefer, C., The bone microenvironment promotes tumor growth and tissue perfusion compared with striated muscle in a preclinical model of prostate cancer in vivo. BMC Cancer 2018, 18 (1), 979.
16. Adeno-Associated Virus 2-Mediated Intratumoral Prostate Cancer Gene Therapy: Long-Term Maspin Expression Efficiently Suppresses Tumor Growth. Human Gene Therapy 2005, 16 (6), 699-710.
17. Li, Y.; Zhong, W.; Zhu, M.; Li, M.; Yang, Z., miR-185 inhibits prostate cancer angiogenesis induced by the nodal/ALK4 pathway. BMC Urology 2020, 20 (1), 49.
18. Kai, L.; Wang, J.; Ivanovic, M.; Chung, Y.-T.; Laskin, W. B.; Schulze-Hoepfner, F.; Mirochnik, Y.; Satcher Jr., R. L.; Levenson, A. S., Targeting prostate cancer angiogenesis through metastasis-associated protein 1 (MTA1). The Prostate 2011, 71 (3), 268-280.
19. Okudaira, H.; Oka, S.; Ono, M.; Nakanishi, T.; Schuster, D. M.; Kobayashi, M.; Goodman, M. M.; Tamai, I.; Kawai, K.; Shirakami, Y., Accumulation of Trans-1-Amino-3-[18F]Fluorocyclobutanecarboxylic Acid in Prostate Cancer due to Androgen-Induced Expression of Amino Acid Transporters. Molecular Imaging and Biology 2014, 16 (6), 756-764.
20. Oka, S.; Okudaira, H.; Yoshida, Y.; Schuster, D. M.; Goodman, M. M.; Shirakami, Y., Transport mechanisms of trans-1-amino-3-fluoro[1-14C]cyclobutanecarboxylic acid in prostate cancer cells. Nuclear Medicine and Biology 2012, 39 (1), 109-119.
Figures