3743
Modeling Mouse Placental Perfusion Dynamics and Contractions via Dynamic Contrast Enhancement MRI1Department of Bioengineering, University of Pittsburgh, Pittsburgh, PA, United States, 2Department of Developmental Biology, School of Medicine, University of Pittsburgh, Pittsburgh, PA, United States, 3Department of Bioengineering, Swanson School of Engineering, University of Pittsburgh, Pittsburgh, PA, United States, 4Rangos Research Center Small Animal Imaging Core, Children's Hospital of Pittsburgh of UPMC, Pittsburgh, PA, United States, 5Rangos Research Center Animal Imaging Core, Children's Hospital of Pittsburgh of UPMC, Pittsburgh, PA, United States, 6Department of Pediatrics, University of Pittsburgh, School of Medicine, Pittsburgh, PA, United States, 7Rangos Research Center Small Animal Imaging Core, University of Pittsburgh, Pittsburgh, PA, United States, 8Biomedical Imaging Research Institue, Cedars-Sinai Medical Center, Los Angeles, CA, United States, 9Department of Pediatrics, School of Medicine, University of Pittsburgh, Pittsburgh, PA, United States
Synopsis
Keywords: Contrast Agent, Placenta, Perfusion, PCA, FASD, DCE
Placental development is a dynamic process, and the timing of placental development events is crucial for appropriate fetal development. However, the placenta itself remains critically understudied in the context of fetal development disorders. We propose novel models for correlating DCE-MRI perfusion estimation with biologically relevant compartments and extracting dynamic biomarkers for placental development. We validate this model by demonstrating that placental perfusion is disrupted in a murine model of peri-conceptual alcohol exposure, and that this disruption occurs differently across various compartments from E14.5 to E17.5.
Background
The placenta plays a crucial role in the regulation of nutrient and gas exchange between the developing fetus and the maternal blood supply1,2, which has a prominent role in fetal somatic growth and neurodevelopment1, 2. Placental dysfunctions can result in fetal loss, fetal growth restrictions, preterm birth, congenital anomalies, or still birth3-6. The placenta is also a source of fetal growth factors, and a neuroendocrine organ, providing neurohormones and signaling molecules crucial for fetal brain development7. However, it is lacking effective non-invasive tools for simultaneous investigation of placental structures and functions over time.Fetal alcohol spectrum disorder (FASD)8 is a significant public health concern in the U.S. (prevalence ~3-10%), because of the difficulty in reducing women’s alcohol consumption in the days and weeks around conception (peri-conception). Alcohol use during pregnancy is associated with impaired placentation9-11.
The goal of this study is to model longitudinal placental development and contraction with dynamic contrast enhancement (DCE) MRI in a mouse model of peri-conceptual alcohol (PCA) exposure. We aim to develop a biologically relevant model of placental perfusion and compartments to extract developmental biomarkers non-invasively.
Methods
Animal ModelWe implemented a clinically relevant PCA model12, mimicking human drinking pattern. Female C57BL6/J mice are allowed for ad libitum oral alcohol intake (12.5% v/v) 4 days before and 4 days after conception (timed by vaginal plugs).
DCE-MRI
We successfully established a less invasive subcutaneous (subQ) catheter for gadolinium (Gd) contrast agent administration (0.1 mmol/kg) in the MRI, allowing longitudinal imaging of the same mice for multiple timepoints.
Mouse placental13 labyrinth, junction zone, and villi vascularization is formed around embryonic day E9.5 ~ E10.5. Chorioallantoic placenta and fetoplacental circulation are established around E13.5 ~ E14.5, and mature on E17.5. DCE-MRI was carried out on E14.5 and E17.5 on the same mice with dynamic Intragate FLASH sequence on a Bruker 7-T scanner. R1 mapping was achieved by varied flip angles.
Perfusion Estimation
The steepest slope modeling method was used to estimate the peak tissue perfusion from the CA kinetics DCE-MRI datasets. The steepest-slope method simplifies to the following equation:
$$$\frac{F}{V_t}=\frac{[dC_T(t)/dt]_{max}}{[C_A(t)]_{max}}$$$
Where dCT/dt is the change in MR signal amplitude for each voxel, and CA(t) is the Arterial Input Function (AIF) of the administered contrast agent. The AIF is derived from a hand-annotated region over the litter dam’s renal hilum.
Physiological Thresholding
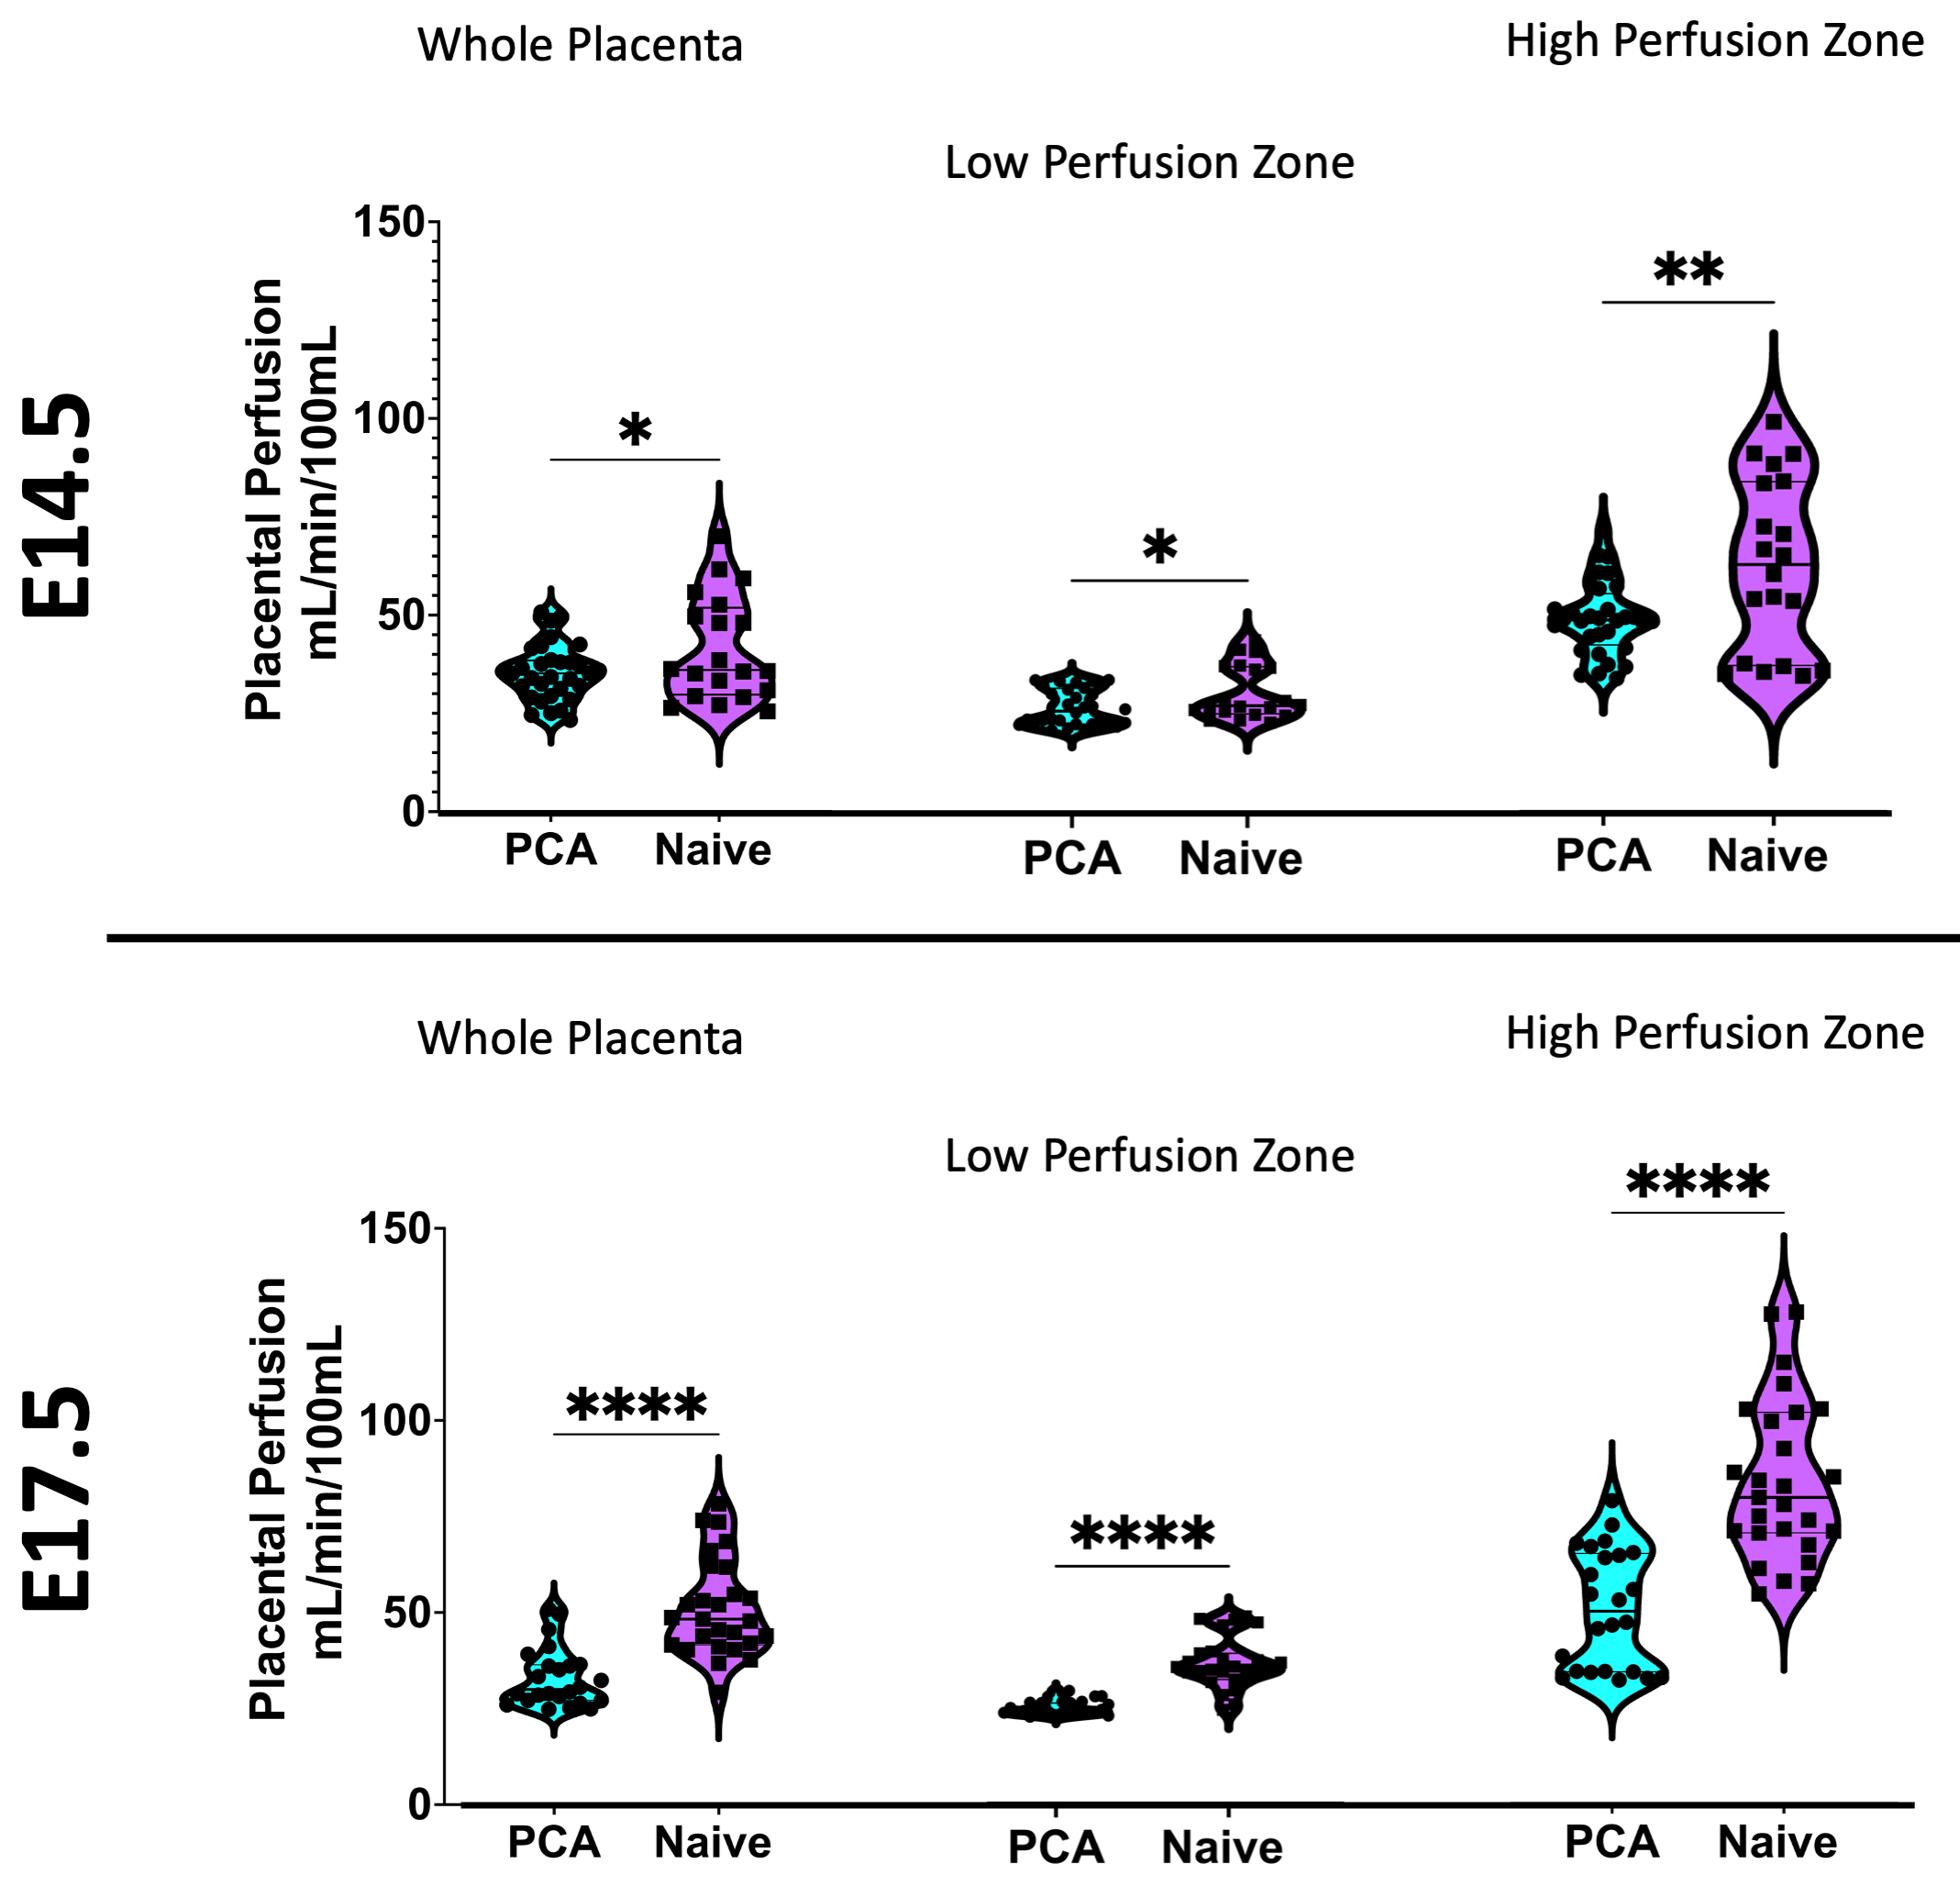
Placental segmentation was achieved by physiologically based thresholding. That is, automatic localization by calculating the 55th and 45th percentile of placental perfusion values at E14.5 and E17.5, respectively. Voxels above and below this threshold are deemed in the ‘High Perfusion Zone,’ representing the Lz, and the ‘Low Perfusion Zone,’ representing the Decidua (Dc).
Perfusion Biomarkers
The steepest-slope parameter from the perfusion modeling, the mean total perfusion, and relative sizes of placental compartments were all collected for comparison across E14.5 to E17.5, separated by the different perfusion compartments. The total blood volume (BV) was estimated as the AUC of the DCE kinetics MR signal trace for the placenta and it’s corresponding perfusion compartments. Gaussian-Mixture modelling was performed on perfusion distributions using the Expectation-Maximization algorithm. Total Gd+ uptake as a proportion of the total compartment volume was calculated from quantitative R1 Maps.
Placental Motion
DCE-MRI kinetics datasets for the same spatial slice, over time, reveal drastic placental motion with much greater incidence at E17.5 than E14.5. This motion was quantified by tracking motion from frame-to-frame of the kinetic time series via Optical Flow14. The corresponding motion data was separated by perfusion compartments and time-frequency analysis was performed using the spectrogram and the periodogram.
Results
Our image acquisition and subcutaneous contrast agent administration demonstrated proper visualization of fetal and litter dam structures in all imaging studies and allowed for longitudinal studying of the same litter dam over time. We successfully utilize the steepest-slope modeling method to quantify placental perfusion and our physiologically based thresholding method not only localizes biologically relevant perfusion compartments, but demonstrated that the high perfusion, low perfusion zone, and whole placenta increase in perfusion from E14.5 to E17.5, with the high perfusion zone growing dramatically (Figure 1).Our model is further validated by the ability to successfully isolate high- and low- perfusion zones within the quantitative R1-space. R1 is directly proportional to the amount of Gd+ uptake and is estimated by scaling the average region R1 by the size of compartment (Figure 2).
The placental motion had increased incidence in E17.5, with 82.1% incidence compared to 11.1% at E14.5 Figure 3 reveals that much of the frequency power is localized to the high perfusion zone, representing asymmetrical motion through the fetal structures. Our model also revealed that placental perfusion is drastically decreased in the PCA animals, specifically in the high perfusion zone (Figure 4).
Conclusions
We successfully created a physiological model of placental perfusion dynamics that automatically localizes biologically relevant perfusion zones as well as extracts critical developmental biomarkers from DCE-MRI data, non-invasively. These biomarkers fall in-line with placental development trends, and we have validated this model in a murine model of PCA that demonstrates disruption of the high perfusion zone in PCA placentas.Acknowledgements
No acknowledgement found.References
1. Sandovici I, Hoelle K, Angiolini E and Constancia M. Placental adaptations to the maternal-fetal environment: implications for fetal growth and developmental programming. Reproductive biomedicine online. 2012;25:68-89.
2. Shallie PD and Naicker T. The placenta as a window to the brain: A review on the role of placental markers in prenatal programming of neurodevelopment. International journal of developmental neuroscience : the official journal of the International Society for Developmental Neuroscience. 2019;73:41-49.
3. Lean SC, Heazell AEP, Dilworth MR, Mills TA and Jones RL. Placental Dysfunction Underlies Increased Risk of Fetal Growth Restriction and Stillbirth in Advanced Maternal Age Women. Scientific reports. 2017;7:9677.
4. Benton SJ, McCowan LM, Heazell AE, Grynspan D, Hutcheon JA, Senger C, Burke O, Chan Y, Harding JE, Yockell-Lelievre J, Hu Y, Chappell LC, Griffin MJ, Shennan AH, Magee LA, Gruslin A and von Dadelszen P. Placental growth factor as a marker of fetal growth restriction caused by placental dysfunction. Placenta. 2016;42:1-8.
5. Reynolds LP, Borowicz PP, Caton JS, Crouse MS, Dahlen CR and Ward AK. Developmental Programming of Fetal Growth and Development. Vet Clin North Am Food Anim Pract. 2019;35:229-247.
6. Jones HN, Powell TL and Jansson T. Regulation of placental nutrient transport--a review. Placenta. 2007;28:763-74.
7. Rosenfeld CS. The placenta-brain-axis. Journal of neuroscience research. 2021;99:271-283.
8. Caputo C, Wood E and Jabbour L. Impact of fetal alcohol exposure on body systems: A systematic review. Birth Defects Res C Embryo Today. 2016;108:174-80.
9. Gundogan F, Elwood G, Longato L, Tong M, Feijoo A, Carlson RI, Wands JR and de la Monte SM. Impaired placentation in fetal alcohol syndrome. Placenta. 2008;29:148-57.
10. Gundogan F, Gilligan J, Qi W, Chen E, Naram R and de la Monte SM. Dose effect of gestational ethanol exposure on placentation and fetal growth. Placenta. 2015;36:523-30.
11. Burton GJ, Fowden AL and Thornburg KL. Placental Origins of Chronic Disease. Physiol Rev. 2016;96:1509-65.
12. Kalisch-Smith JI, Steane SE, Simmons DG, Pantaleon M, Anderson ST, Akison LK, Wlodek ME and Moritz KM. Periconceptional alcohol exposure causes female-specific perturbations to trophoblast differentiation and placental formation in the rat. Development (Cambridge, England). 2019;146.
13. Ander SA-OX, Diamond MA-O and Coyne CA-O. Immune responses at the maternal-fetal interface. LID - 10.1126/sciimmunol.aat6114 [doi] LID - eaat6114.
14. Horn, B. K., & Schunck, B. G. (1981). Determining optical flow. Artificial intelligence, 17(1-3), 185-203.
Figures
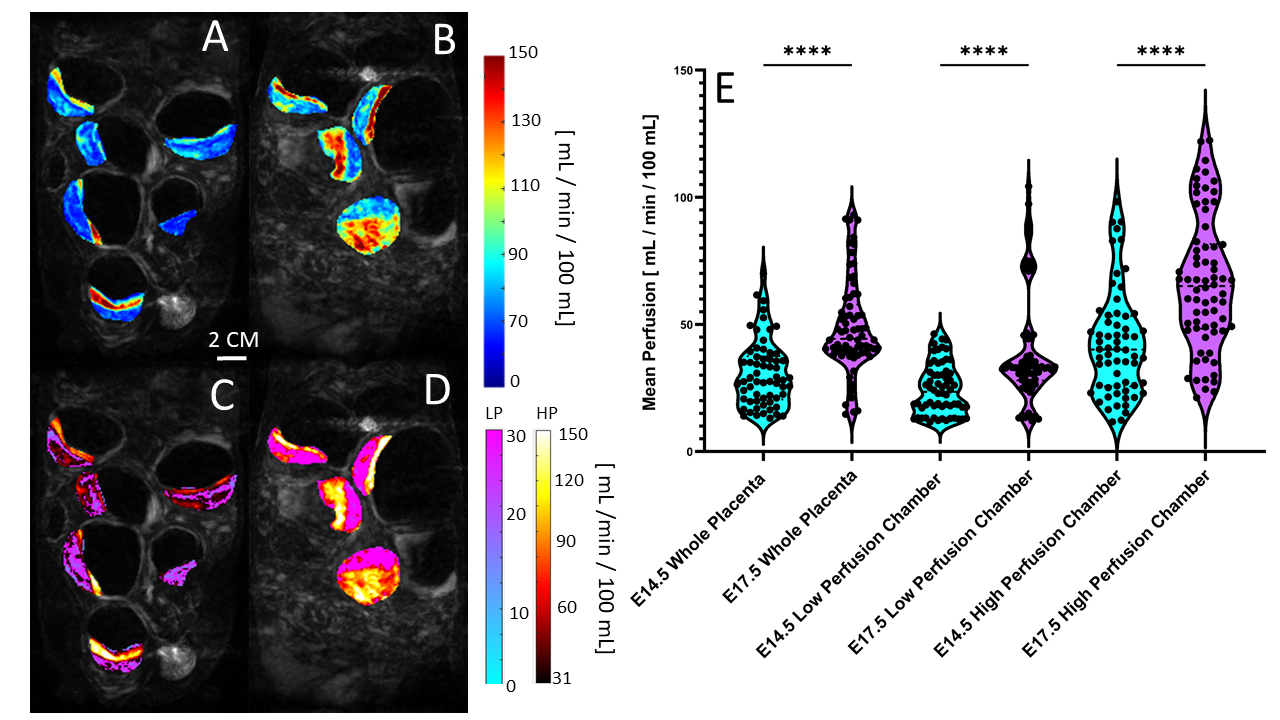
Figure 1) A and B) Perfusion maps prior to physiological thresholding for E14.5 (A) and E17.5 (B) of the same litter. C and D) Perfusion maps after physiological thresholding for E14.5 (C) and E17.5 (D). Physiological thresholding successfully distinguishes the different perfusion zones visually seen in A and B. E) Violin plots of the mean perfusion for the whole placenta and the high and low perfusion compartments at E14.5 and E17.5. (**** = p <0.0001).
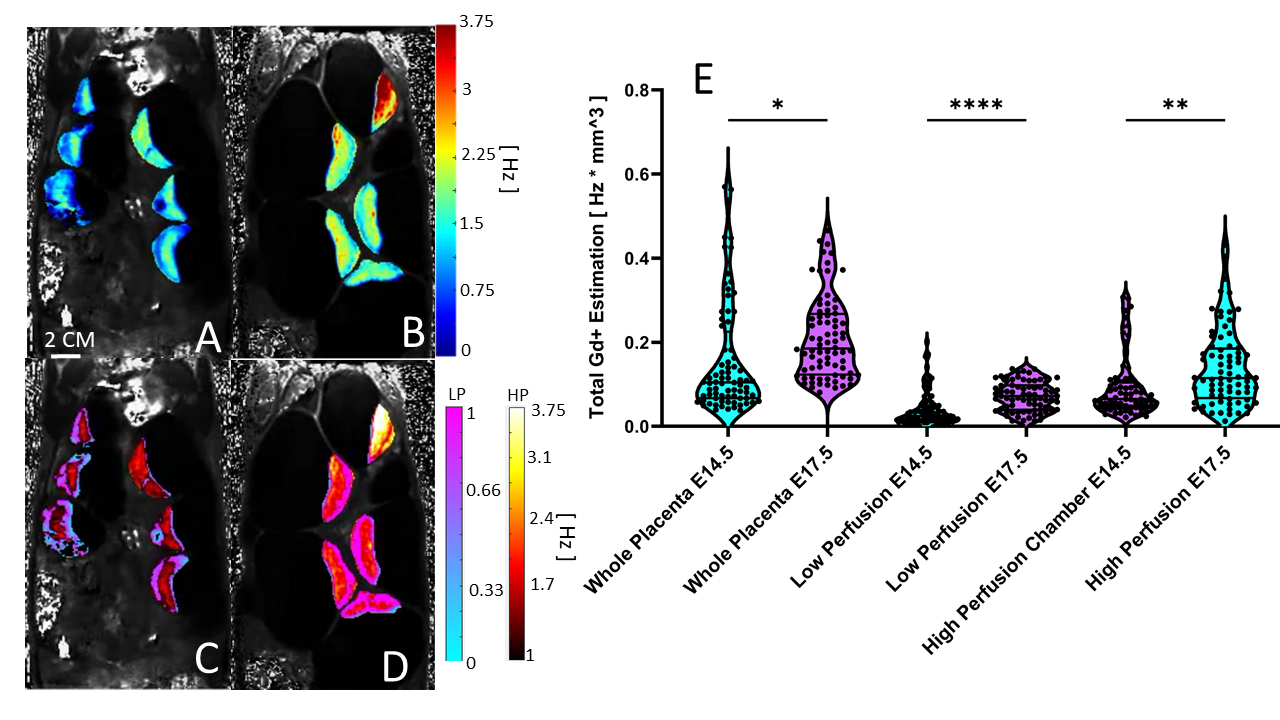
Figure 2) A and B Quantitative R1 maps prior to physiological thresholding for A) E14.5 and B) E17.5. C and D) the same R1 maps after physiological thresholding for C) E14.5 and D) E17.5. Physiological thresholding is again able to distinguish different compartments in the placenta in the R1 space. e. E) Violin plots for of the average Gd+ uptake for each placenta, separated by compartment as well as embryonic age (* = p < 0.05, **** = p < 0.0001).
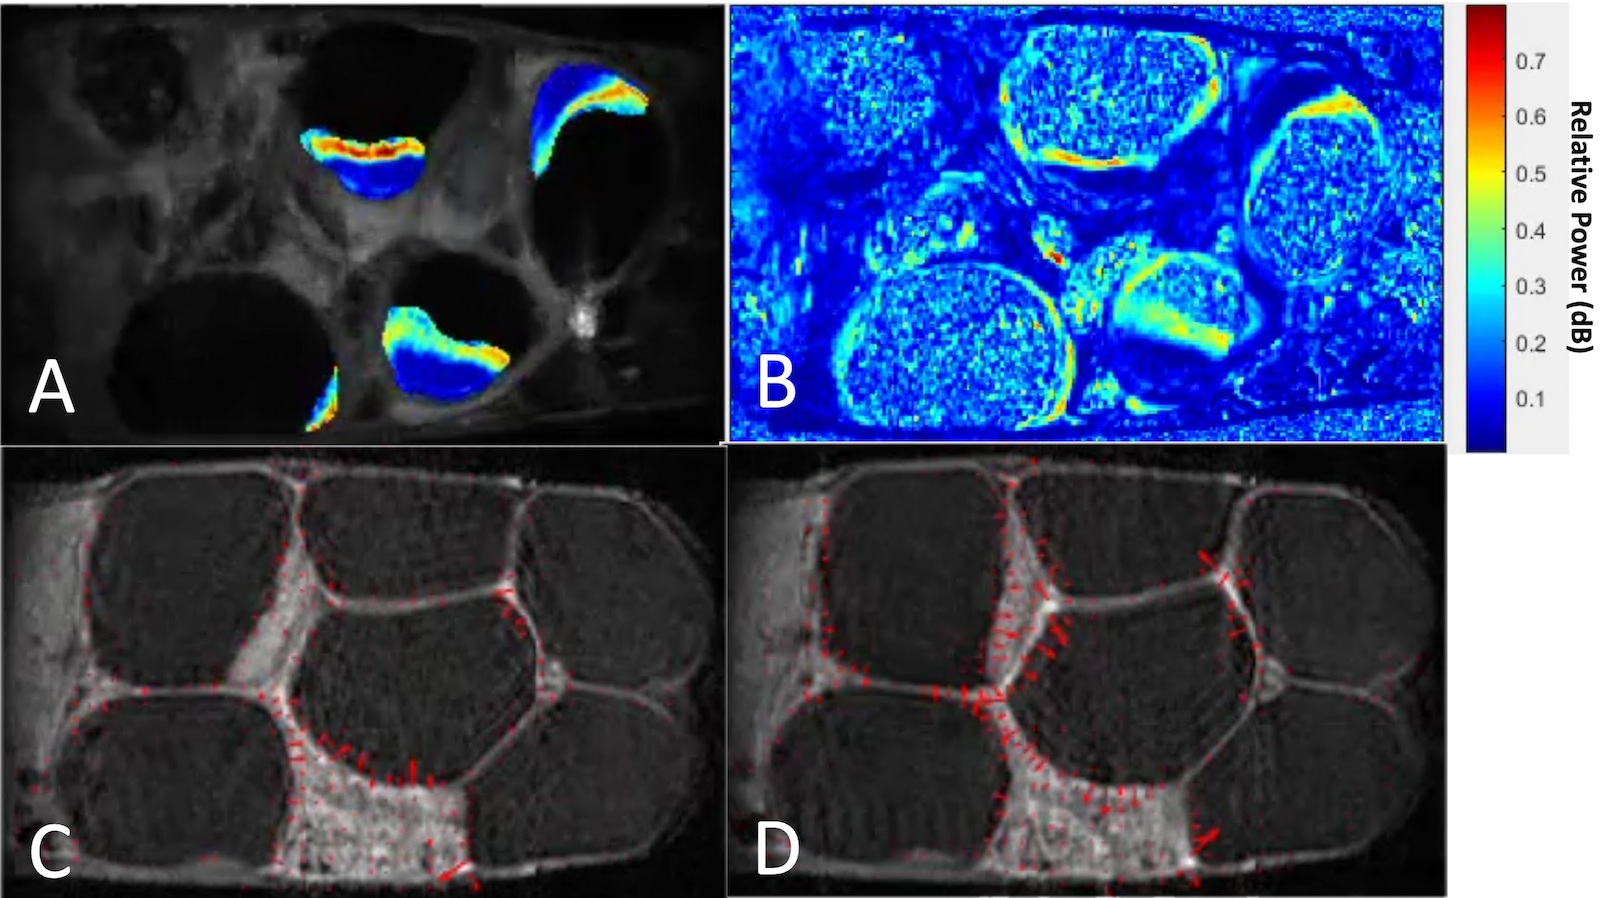
Figure 3) Video frames displaying example sub-band maps for a single litter dam at E17.5. The unit is a ratio of power in the 10 mHz sub-band to the power of the entire spectrum. A) After applying placental segmentations, full litter dam map. B) Before applying placental segmentations across the map. Notice that much of the highest power (red) is in the high-perfusion region of the placenta. C and D) Consecutive frames of a slice in the DCE time series. Red velocity vectors track motion from frame-to-frame. Notice increase in magnitude of vectors around placenta and uterine-wall structures.