3740
Metabolic similarity of prostate cancer patient-derived xenografts propagated in the bone versus liver1Radiology and Biomedicla Imaging, University of California, San francisco, San Francisco, CA, United States, 2University of California, San francisco, San Francisco, CA, United States
Synopsis
Keywords: Cancer, Metabolism, Models, metastasis, tumor, microenvironment
Metabolic plasticity due to cell intrinsic properties, its inherent dependence on organ of origin as well as its interaction with microenvironmental factors are considered key to establishment of metastases and is believed to be heterogenous. This in turn has a significant impact and differential response to the treatment of choice making this a lethal disease. Here, we investigate using magnetic resonance imaging and spectroscopy the biochemical profile of the same patient derived xenografts of small cell neuroendocrine prostate cancer, an aggressive phenotype, implanted in two different sites, liver and bone that are associated with reduced survival.Purpose
Metastases of almost all types of cancer remain incurable. Metabolic reprogramming is a fundamental strategy of tumor cells to colonize and proliferate in microenvironments distinct from the primary site. Understanding the metabolic plasticity of cancer cells may reveal novel approaches to treating metastases more effectively. Small cell neuroendocrine (SCNC) is a lethal subtype of metastatic prostate cancer (PCa) with a median survival of <9 months1 and limited treatment options. Patients with metastases in the liver have a particularly poor prognosis2,3 relative to those with bone metastases alone and recent clinical trial data showed that patients with castration resistance and liver metastases benefited from certain therapies while those with bone metastasis4 did not, highlighting the need to better understand the metabolic adaptations of the metastatic lesions. To this end, we have developed metastatic models in the liver and bone of 3 SCNC PDX and investigated their metabolic profiles.Methods:
LuCaP935 and LTL352 and LTL6106 PDX were propagated under the renal capsule of male mice7. These tumors were resected and, after digestion to single cells8, were injected into tibiae and liver (~5×10⁵ in 20μL)9,10. Tumor growth was monitored by serial T2-weighted fast spin echo on a Bruker 3T scanner with 40 mm 1H/13C volume coil. Diffusion weighted images acquired with 5 b-values ranging between 12 and 658 s/mm2 were used to generate the apparent diffusion coefficient (ADC) maps using a mono-exponential fit. Hyperpolarized [1-13C] pyruvate and 13C urea MRI was dynamic acquired using a 2D spiral CSI every 4.25s, 15 time-points and a flip-angle of 10°. Spectra were acquired with 32x32 mm FOV, 8x8 matrix and 8mm slab. Metabolite maps were generated in SIVIC11 and analyzed using MATLAB. kPL, the apparent rate of enzymatic conversion of HP pyruvate to lactate, was calculated as described previously12. HP 13C-urea peak area under dynamic curve (AUC) for tumors was calculated and normalized to maximum urea signal from a neighboring blood vessel to measure perfusion. Once the tumors reached 0.8cc, [U-13C] glucose was injected via tail vein and tumor tissue extracted and analyzed as before13. Absolute concentrations were determined using MestreNova and metabolite resonance identification was confirmed with Chenomx. The concentration of 13C-labeled metabolites quantified from 1H-13C HSQC using TopSpin was used to calculate the fractional enrichment (FE) as [13C-labeled metabolite] HSQC/[total metabolite]{13C}1H. Multivariate analysis was performed on the steady state concentrations of metabolites using the MetaboAnalyst. RNA was extracted from tumors and RNAseq analysis was performed by Novogene.Results and discussion:
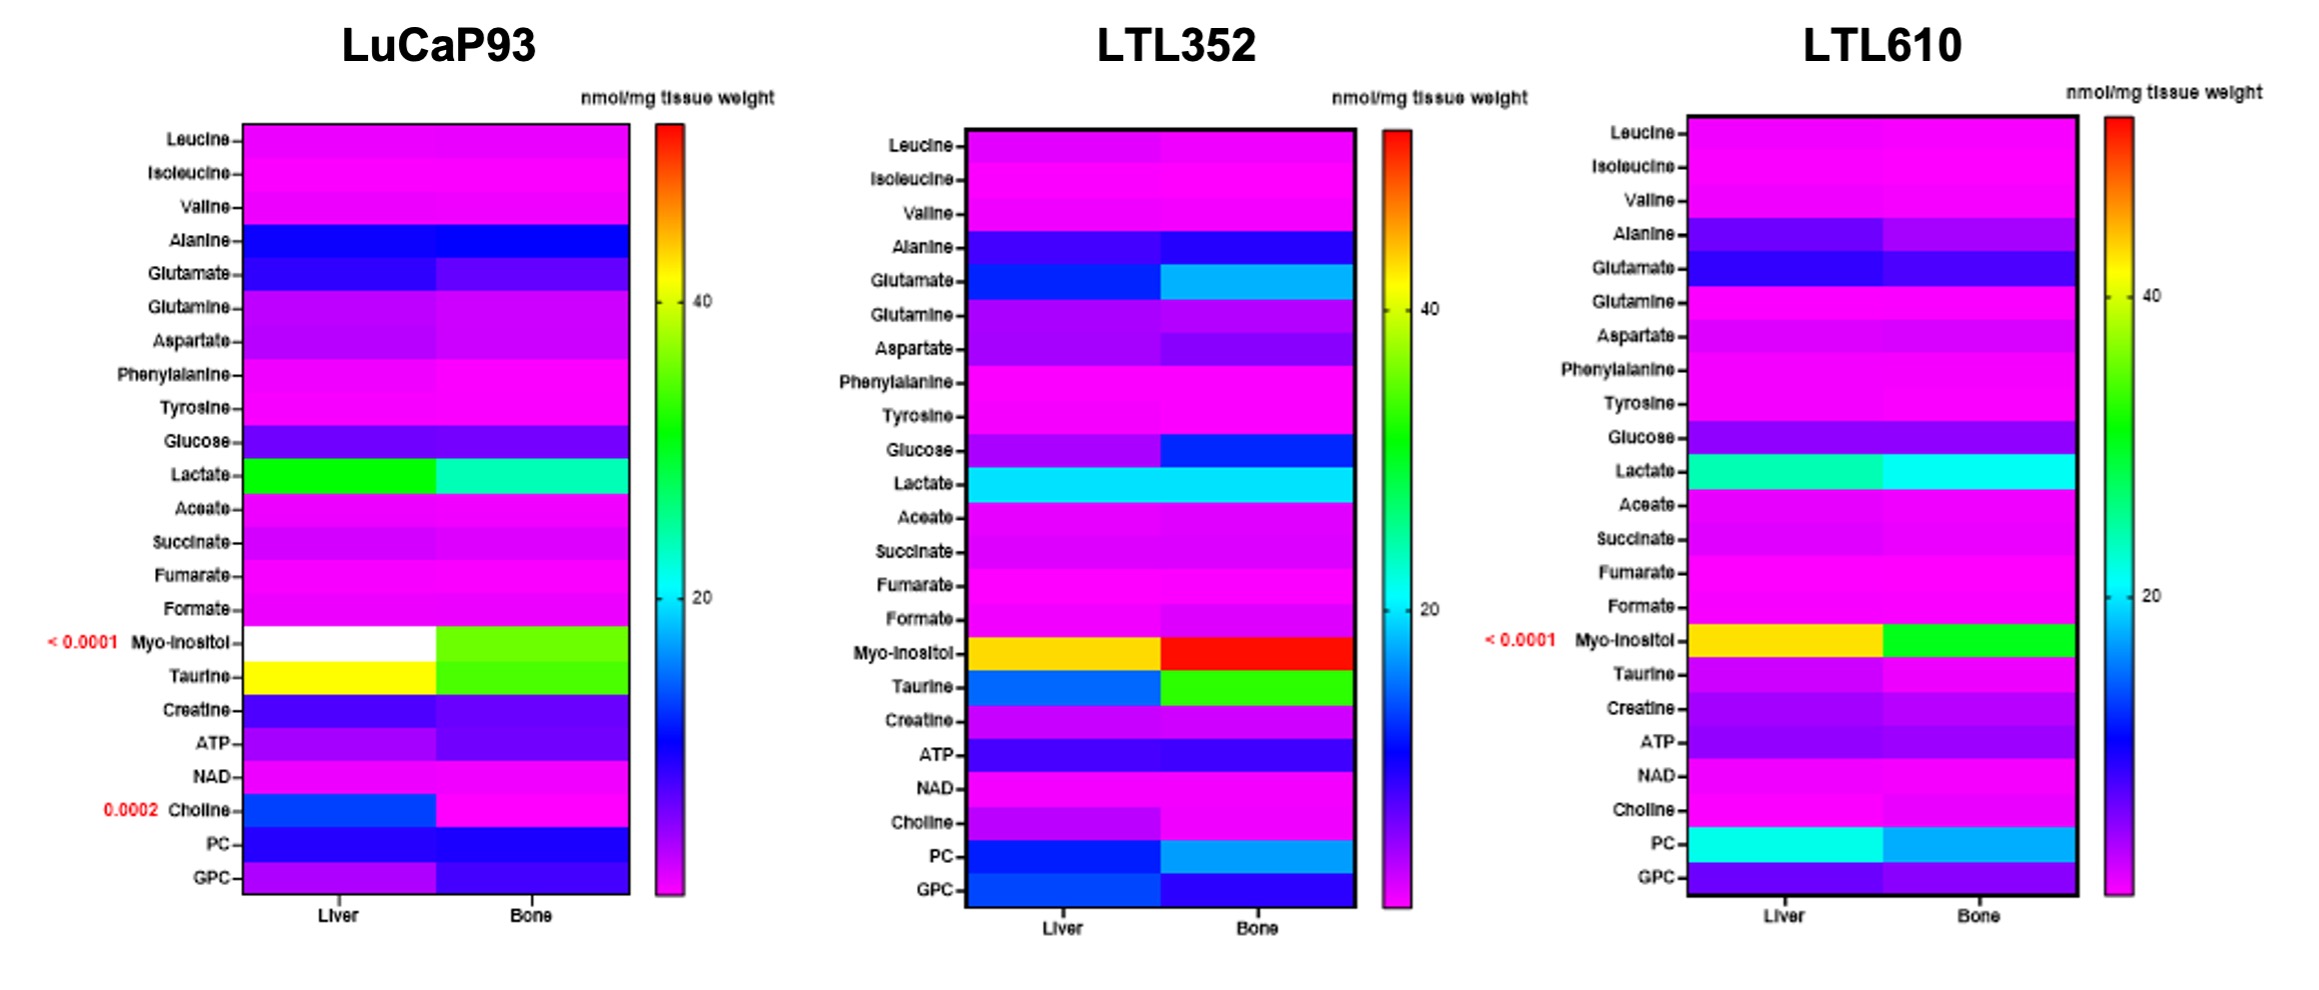
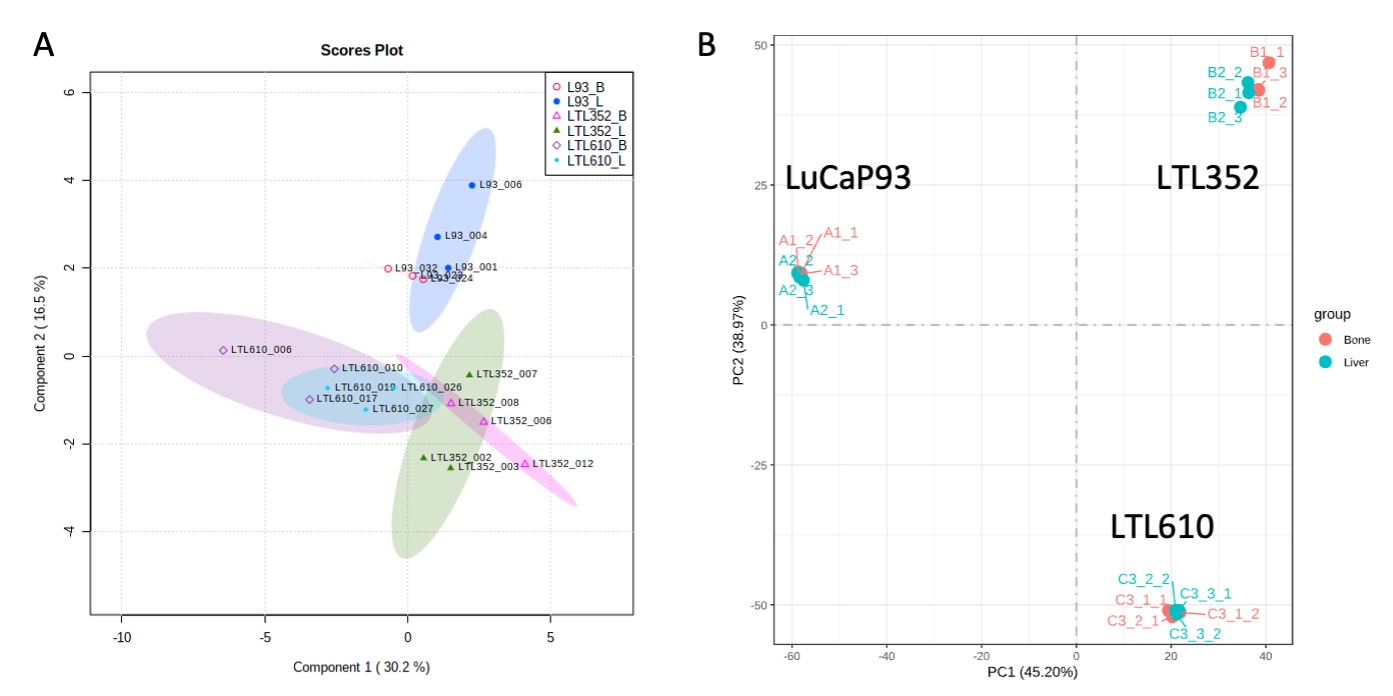
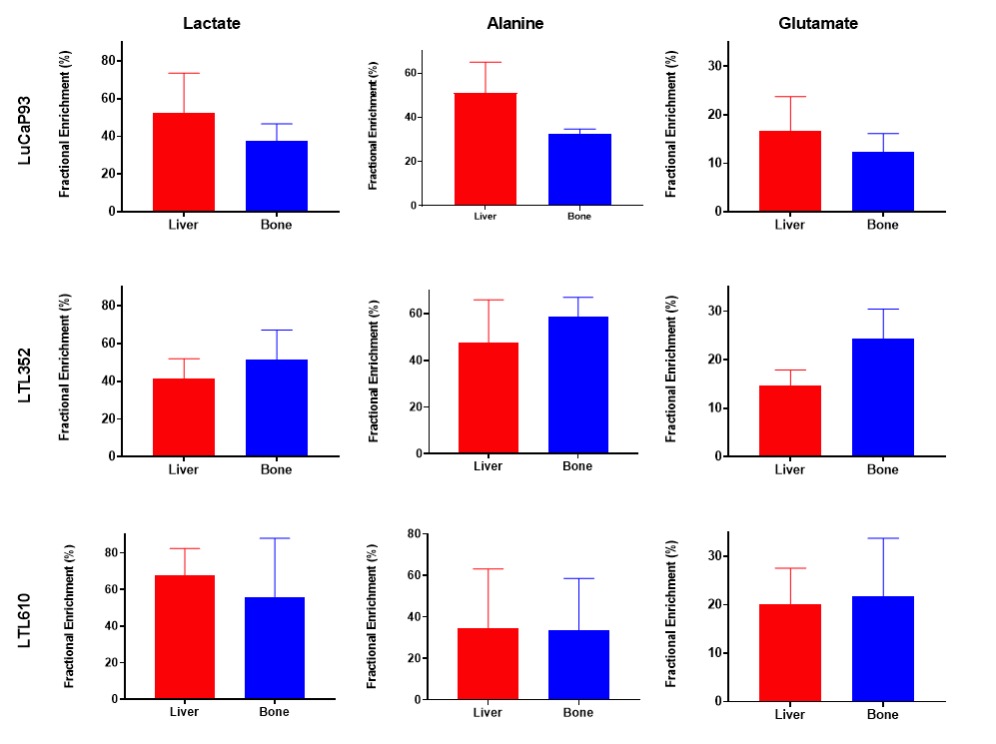
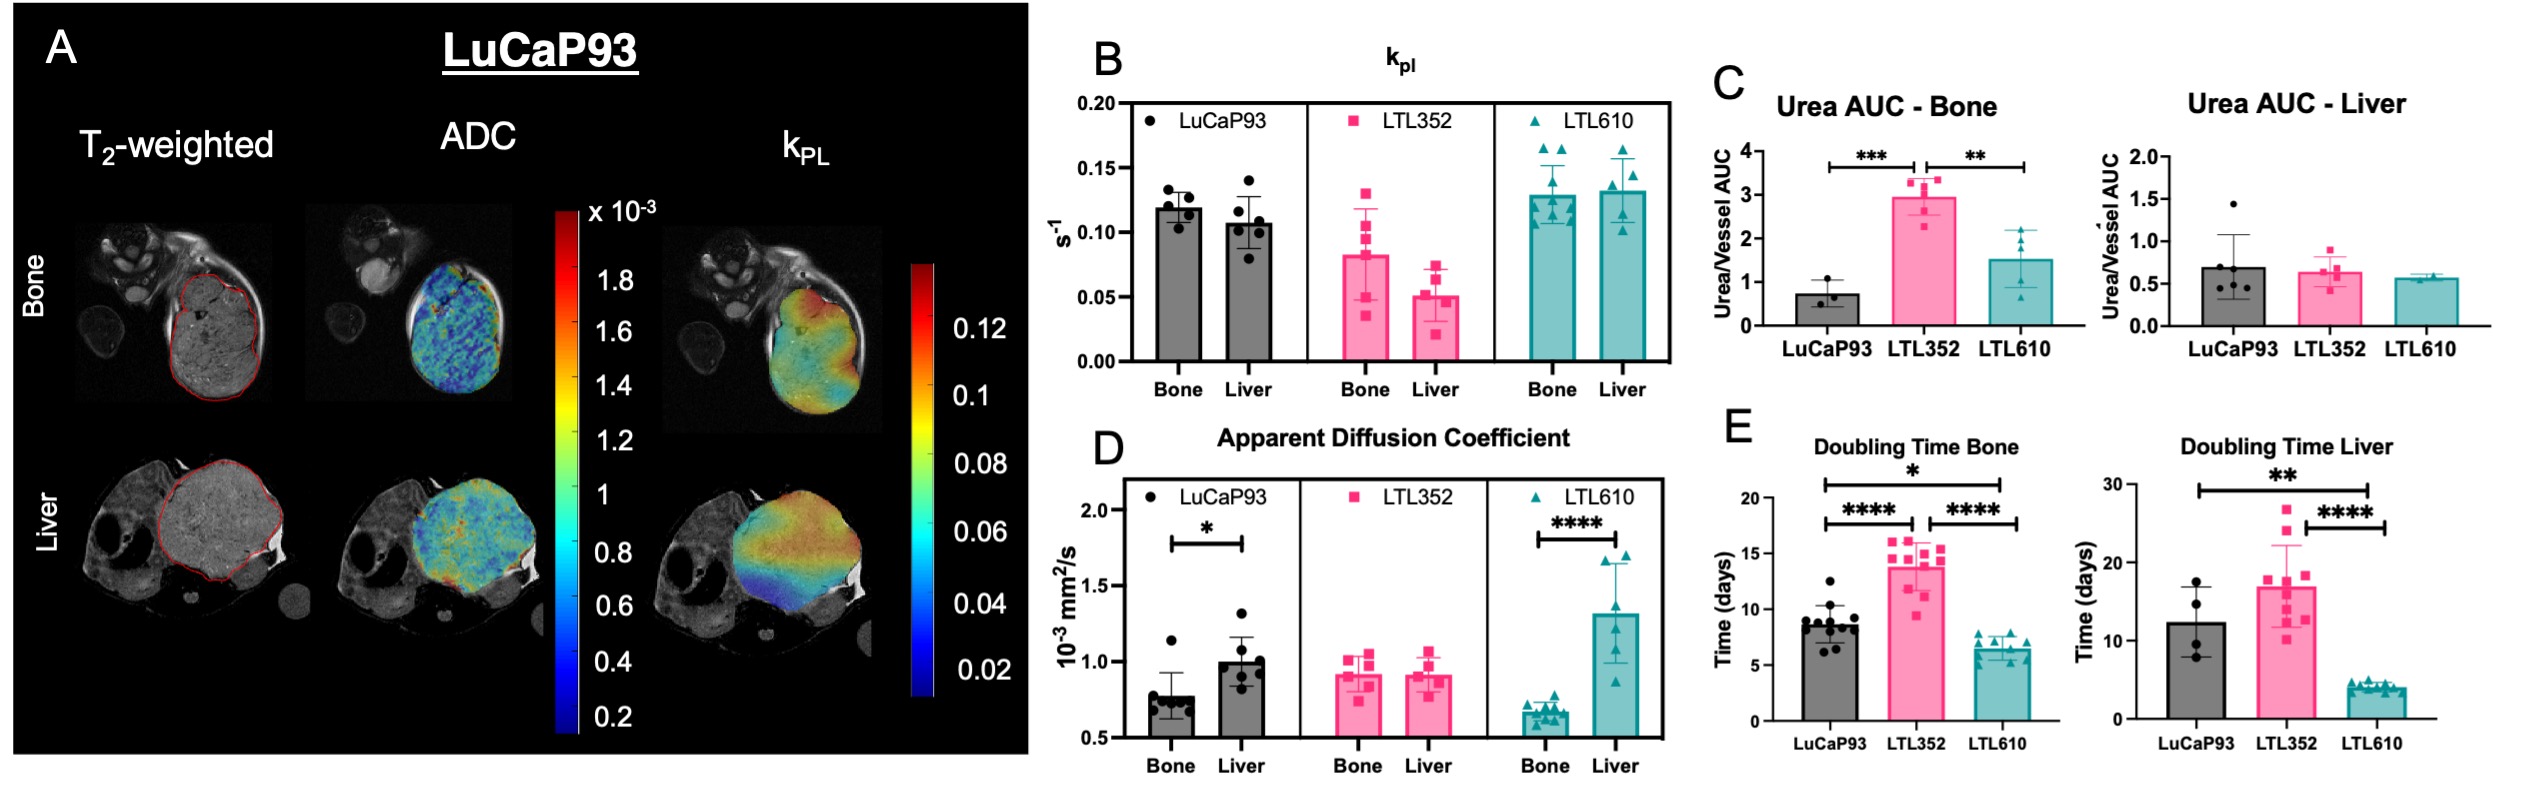
Twenty-three distinct metabolites were reliably quantified in tumors of the 3 PDX grown in liver and bone (Fig.1). There were no significant differences in the steady state levels of metabolites between tumors grown in liver versus bone for any of the PDX, except for significant elevation of myo-inositol in the liver tumors of LuCaP93 and LTL610 and elevation of choline in the liver tumors of LuCaP93. Interestingly, there were significant inter-PDX differences in the levels of lactate and choline-compounds in the liver but not in the bone. In comparison, the metabolites with significant inter-PDX differences in the bone were myo-inositol and glutamate, with LTL352 having the highest concentrations. Taurine was significantly higher in LuCaP93 compared to the other two PDX in both the liver and bone. Principal component analysis demonstrated that bone and liver tumors from the same PDX tended to cluster together (Fig.2A). Transcriptomic analysis also indicated a similar trend of congruence in tumors of the same PDX (red denoting bone and green denoting liver in Fig.2B). Fig.3 shows that the FE of the lactate, alanine and glutamate from labeled glucose is similar between the bone and liver for each PDX with no significant difference between the PDX. kPL, a measure of glycolysis determined by hyperpolarized [1-13C]pyruvate MRI, also recapitulated the lack of difference between sites for a given PDX (Fig.4B), although LTL352 tumors had significantly lower kPL relative to the other two PDX in general.While there was no drastic impact of the microenvironment on the metabolic phenotype of the tumors, the physiological features of PDX in bone versus liver were significantly different. The perfusion of tumors in the liver, as measured by hyperpolarized urea AUC, was similar in the liver between the PDXs, but were distinctly elevated in the LTL352 tumors in the bone (Fig.4C). Additionally, cellularity reflected by the ADC was lower in the liver tumors of both LuCaP93 and LTL610 relative to the bone (Fig.4D). Of the three PDX studied, LTL352 was the slowest growing in both sites and LTL610 the fastest (Fig.4E).
Conclusion
Although the tumors in the bone and liver exhibited differences in growth rate, cellularity and perfusion, there was negligible metabolic differences due to the microenvironment observed in the biochemical profiles of the SCNC PDX. This is in contrast to the expectation based on clinical observations and could be partly due to the homogenous pure SCNC phenotye PDX used in this study compared to the heterogeneous admixture tumors found in patients. We are currently investigating dependency on glutamine as an energy substrate and additional PDX. Future studies will focus on investigating the response to treatment of these tumors as a function of the implantation site.Acknowledgements
We would like to acknowledge the personnel of the Surbeck Lab as well as the PreClinical MR Imaging and Spectroscopy Core at UCSF for enabling this study. This study was funded by the following grants: NIH P41EB013598, UCSF Prostate Cancer Pilot Award, DoD PCRP PC160630 (Idea Development Award, NIH R01 CA215694, NIH U24 CA0163815.References
1. Beltran, H. et al. Aggressive Variants of Castration-Resistant Prostate Cancer. Clin Cancer Res 20, 2846–2850 (2014).
2. Kelly, W. K. et al. Liver metastases (LM) to predict for short overall survival (OS) in metastatic castration-resistant prostate cancer (mCRPC) patients (pts). JCO 30, 4655–4655 (2012).
3. Rawla, P. Epidemiology of Prostate Cancer. World J Oncol 10, 63–89 (2019).
4. Drake, C. G. Visceral Metastases and Prostate Cancer Treatment: ‘Die Hard,’ ‘Tough Neighborhoods,’ or ‘Evil Humors’? 14 (2016).
5. Nguyen, H. M. et al. LuCaP Prostate Cancer Patient-Derived Xenografts Reflect the Molecular Heterogeneity of Advanced Disease and Serve as Models for Evaluating Cancer Therapeutics: Prostate Cancer PDXs: LuCaP Series. Prostate 77, 654–671 (2017).
6. Lin, D. et al. High Fidelity Patient-Derived Xenografts for Accelerating Prostate Cancer Discovery and Drug Development. Cancer Res 74, 1272–1283 (2014).
7. Agarwal, S., Peehl, D. M. & Sriram, R. Subrenal capsule implantation of tumor tissue. https://www.protocols.io/view/subrenal-capsule-src-implantation-of-tumor-tissue-bvrrn556 (2021) doi:10.17504/protocols.io.bvrrn556.
8. Agarwal, S., Peehl, D. M. & Sriram, R. Single cell digestion of tumor tissue. https://www.protocols.io/view/single-cell-digestion-of-tumor-tissue-bvrun56w (2021) doi:10.17504/protocols.io.bvrun56w.
9. Agarwal, S., donna.peehl & Sriram, R. Intratibial implantation of tumor cells. (2021).
10. Agarwal, S., Bok, R., Peehl, D. M. & Sriram, R. Intrahepatic implantation of tumor cells. https://www.protocols.io/view/intrahepatic-implantation-of-tumor-cells-bvrtn56n (2021) doi:10.17504/protocols.io.bvrtn56n.
11. Crane, J. C. et al. Hyperpolarized 13 C MRI data acquisition and analysis in prostate and brain at University of California, San Francisco. NMR Biomed 34, e4280 (2021).
12. Larson, P. E. Z. et al. Investigation of analysis methods for hyperpolarized 13C-pyruvate metabolic MRI in prostate cancer patients. NMR in Biomedicine 31, e3997 (2018).
13. Sun, J. et al. Resistance to Androgen Deprivation Leads to Altered Metabolism in Human and Murine Prostate Cancer Cell and Tumor Models. Metabolites 11, 139 (2021).
Figures