3739
RF FRONT-END RECEIVER USED IN 1.5T MRI1Medical Systems Division, SAMEER, Mumbai, India
Synopsis
Keywords: RF Pulse Design & Fields, RF Pulse Design & Fields, RF Front-end
In an MRI, the receiver coil produces moderately low signals that are difficult to detect in a noisy environment. As a result, there was a requirement for a customised RF front end that could tolerate high power leakage from coils, provide adequate isolation, low noise figure, and have a good gain factor. The developed RF front end complies with the requirements and produces images with low noiseINTRODUCTION
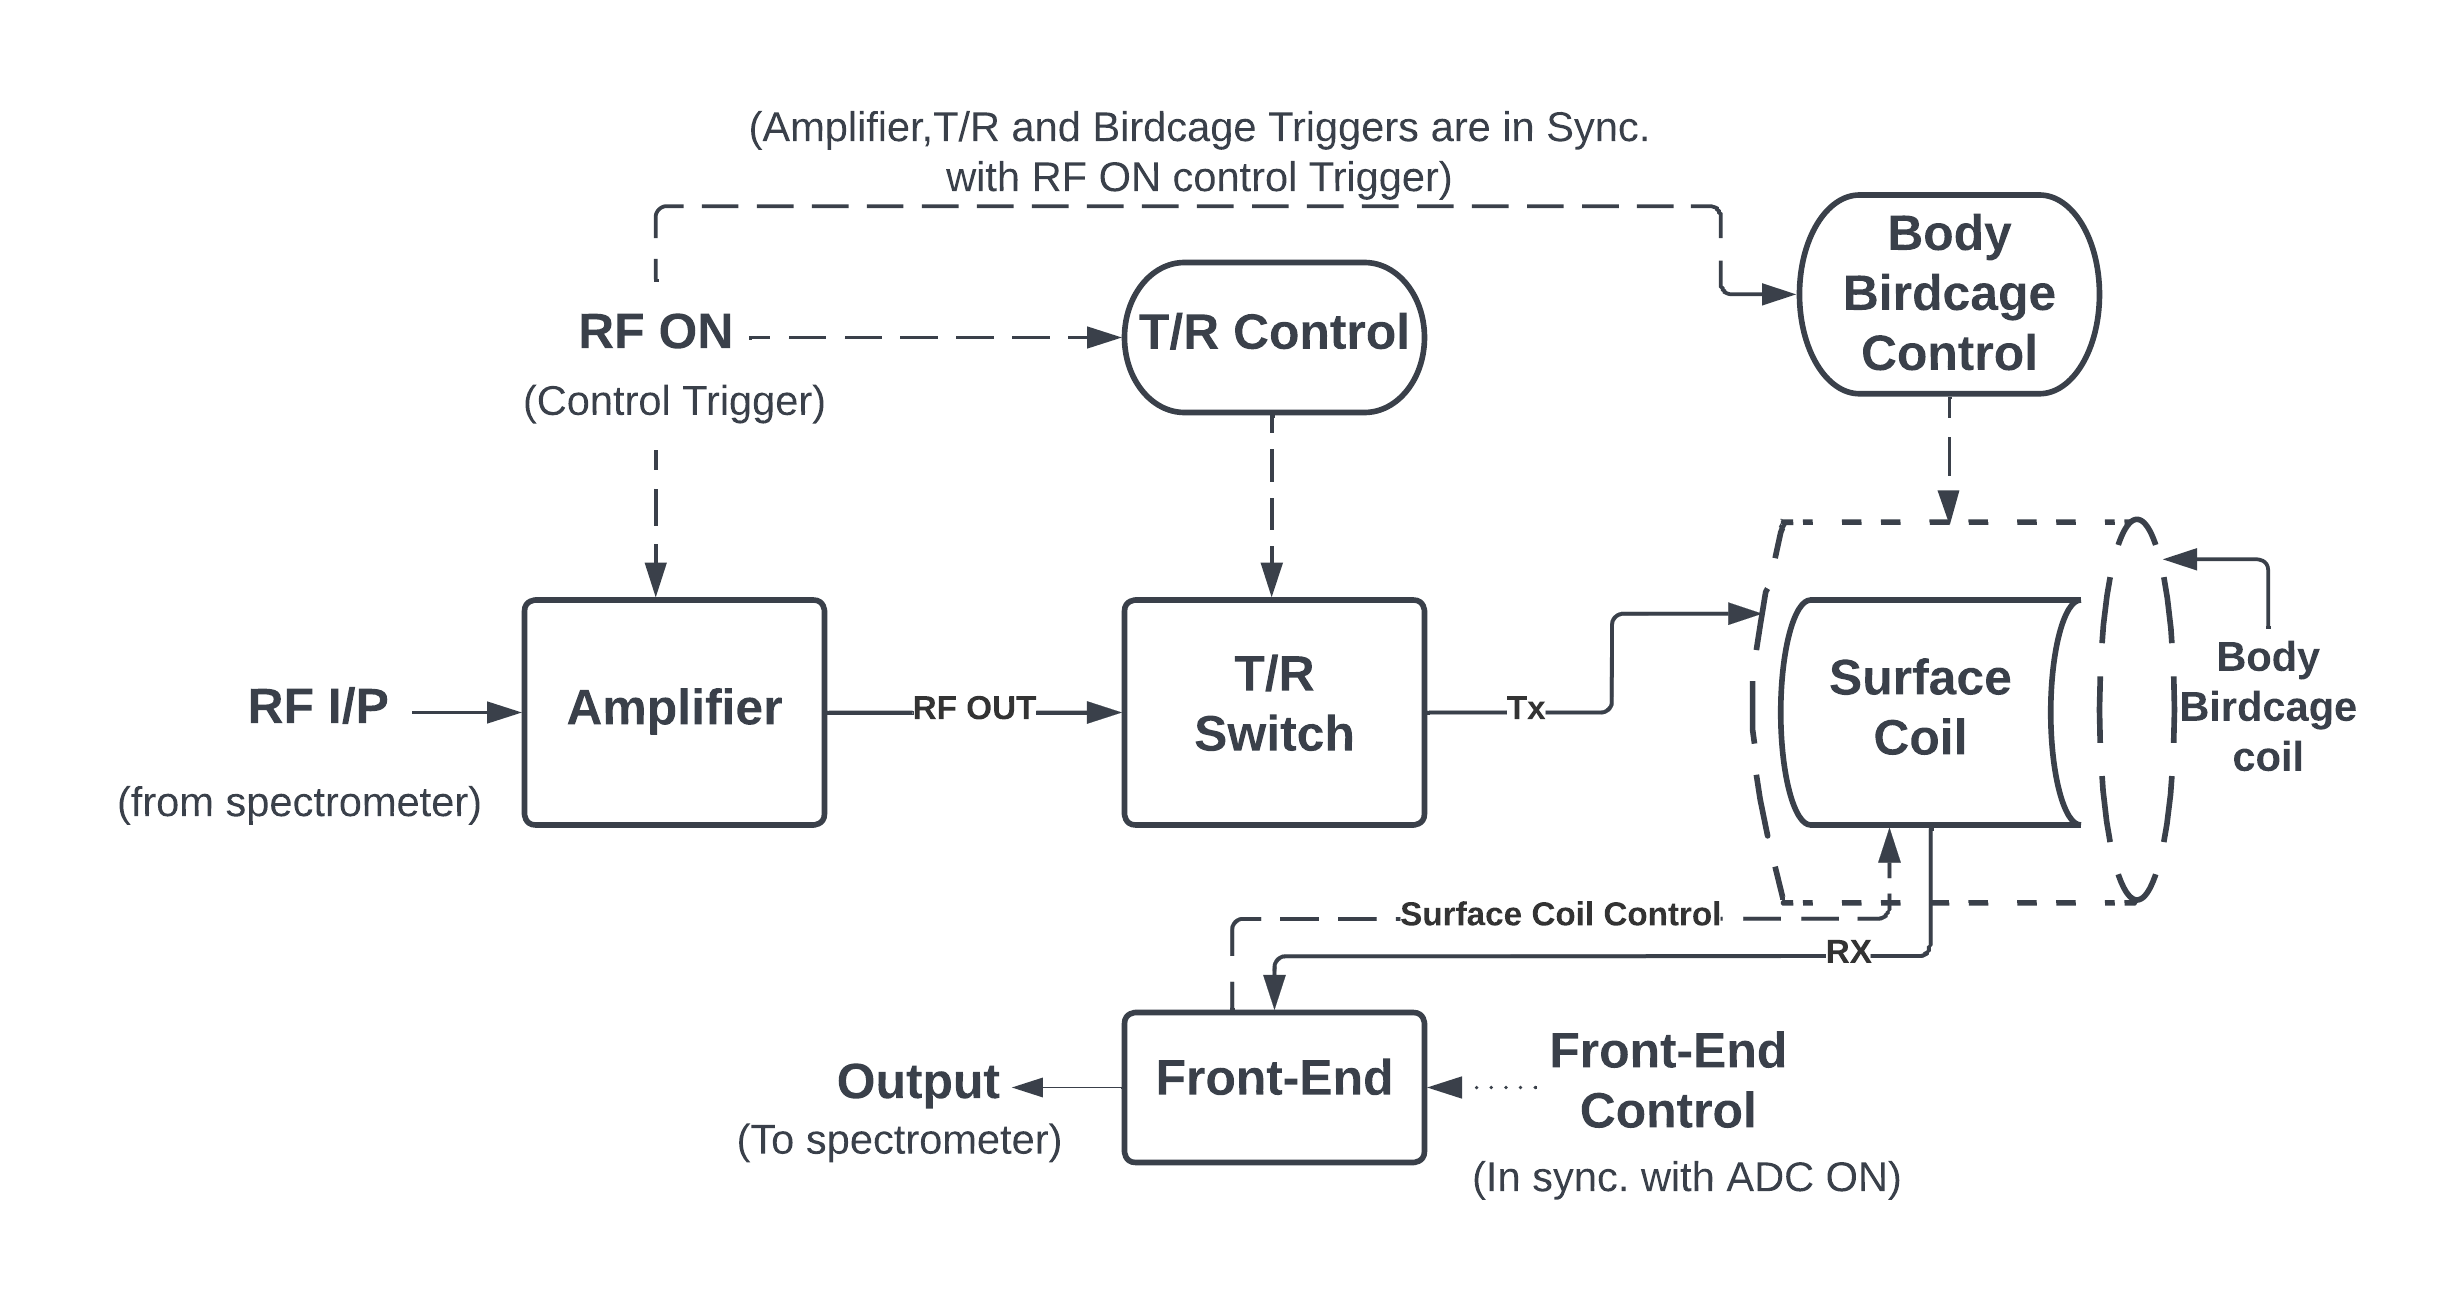
In the MRI application signal that the receiver coils receive is in the scale of a few µV. The MRI environment is noisy by nature because it contains variety of noise-producing components[1], including a high-power RF amplifier, high-current gradient coils, and high-current tuning and detuning circuits integrated into the birdcage coils. The RF front end[2] has to have a low noise figure since noise is a significant component and can impair the quality of the image. This is one of the major considerations while implementing the front end. Along with the noise figure other characteristics that a front end must have is matched impedance for surface coils, a sufficiently high enough gain (~50dB), low total channel noise power, isolation of more than 110 dB, and relatively moderate dynamic range (~80dB). To obtain these requirements, the maximum and minimum signal levels that the ADC used in post-processing can operate at were employed. Additionally, it is essential to make sure that the dynamic range of the ADC does not saturate the front end. Figure 1 illustrates the configuration of a whole integrated MRI system with RF front end and body birdcage coil transmit and surface coil receive.METHOD
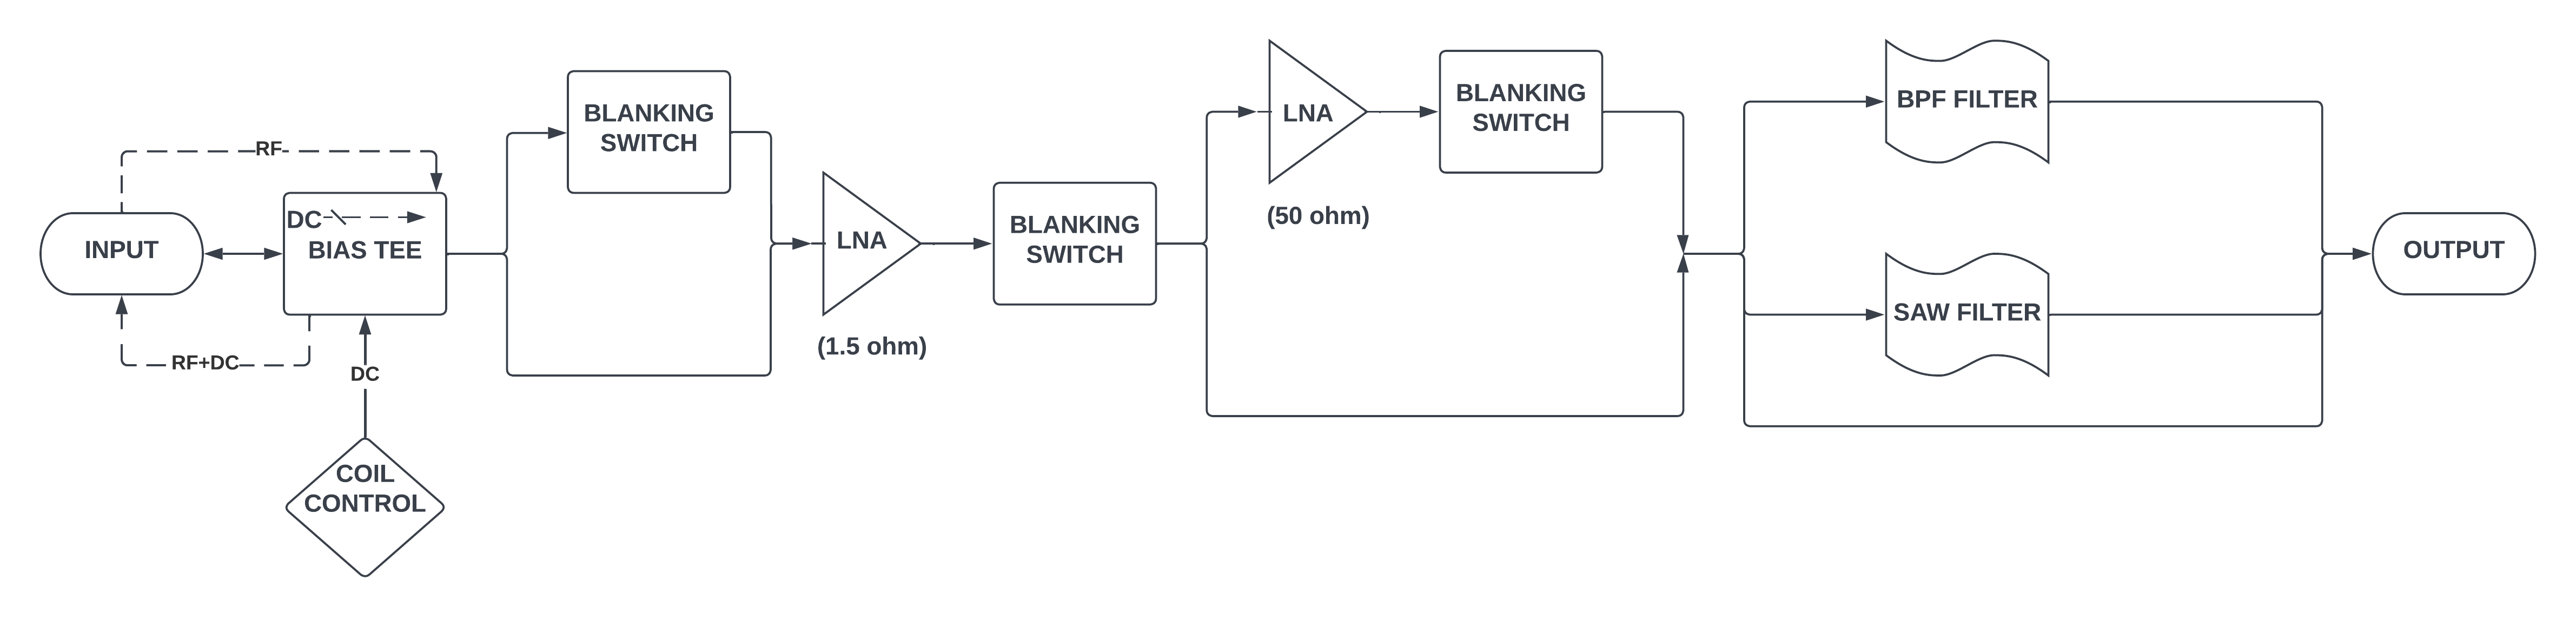
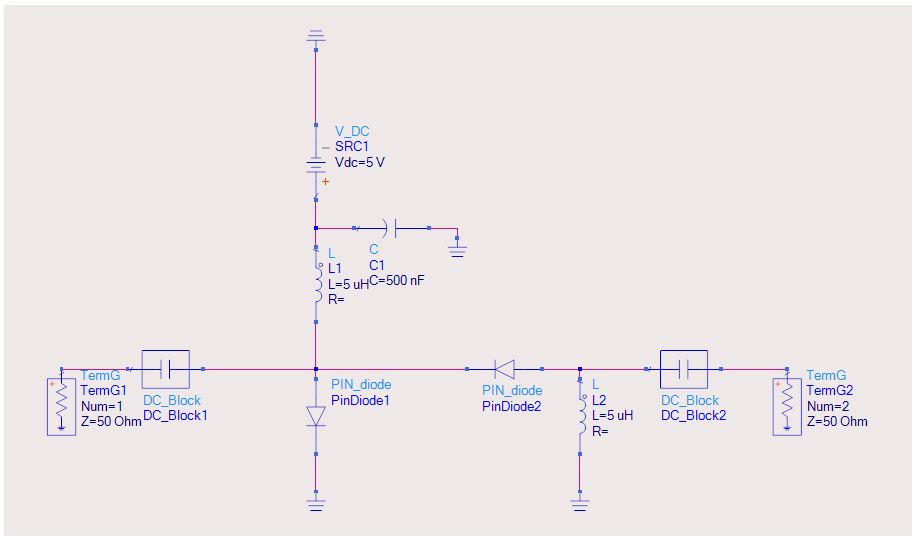
Generally, any RF receiver consists of matching networks, isolation blocks, amplifiers, and mixers. A cascaded modular front-end system architecture with two LNAs, three RF SPST switches, and a bandpass filter is used to suppress the noise. The implemented front-end system's block diagram schematic is shown in Figure 2. The bias Tee, which transmits RF and control signals to the active detuning circuits of the surface coil[3][4][5], is connected to the coil's output. The output of bias Tee is connected in series with the RF switch, followed by 1.5ohm LNA/50Ω LNA, carried forward to the blanking switch then another RF switch, and LNA followed by the 3rd RF switch. To lower the noise outside the band, a SAW filter is used. ADS 2016 was used to simulate circuits, and numerical analysis was also done. For EMI/EMC purposes, power supply lines and RF lines are separated. Harmonics and S-parameter simulations are also performed for efficient functioning.In the body, the birdcage transmits mode, and input power of the order of 72dBm is received by the front end. To protect the LNAs and spectrometer, three SPST RF switches[6] were designed using two PIN diodes in a series shunt combination to provide isolation of 120dB and insertion of 0.2dB. The PIN diodes are driven by pin diode drives[7] for efficient operation. Figure 3 shows the schematic of the RF switch design. This front-end system is designed to adapt 50-ohm impedance matching for receiving the signals from birdcage and low impedance matching for surface coils.
RESULTS
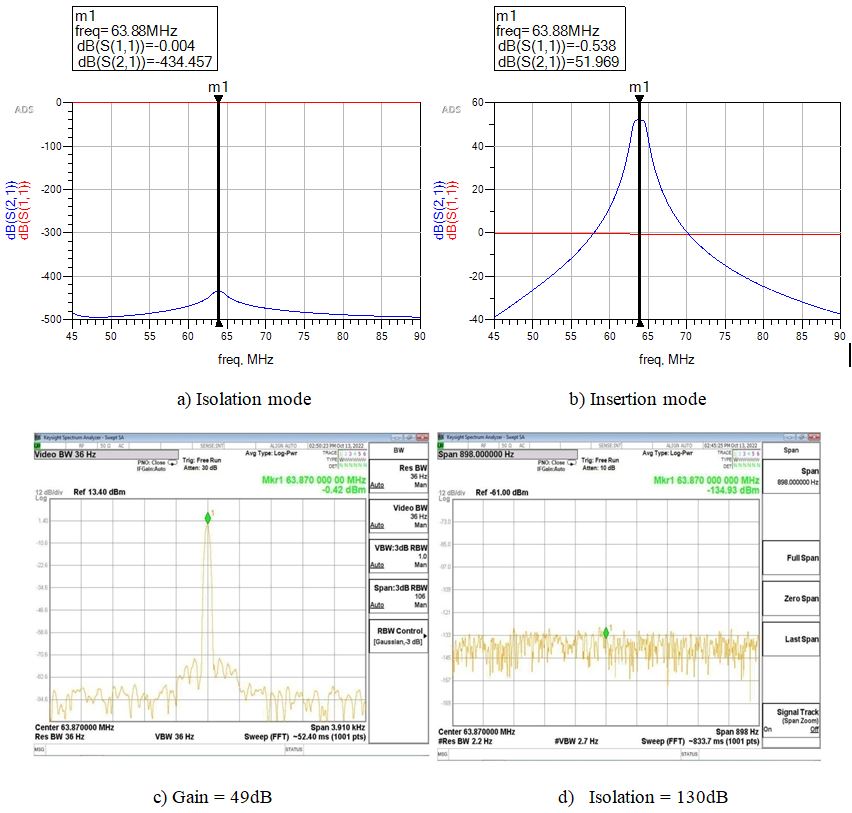
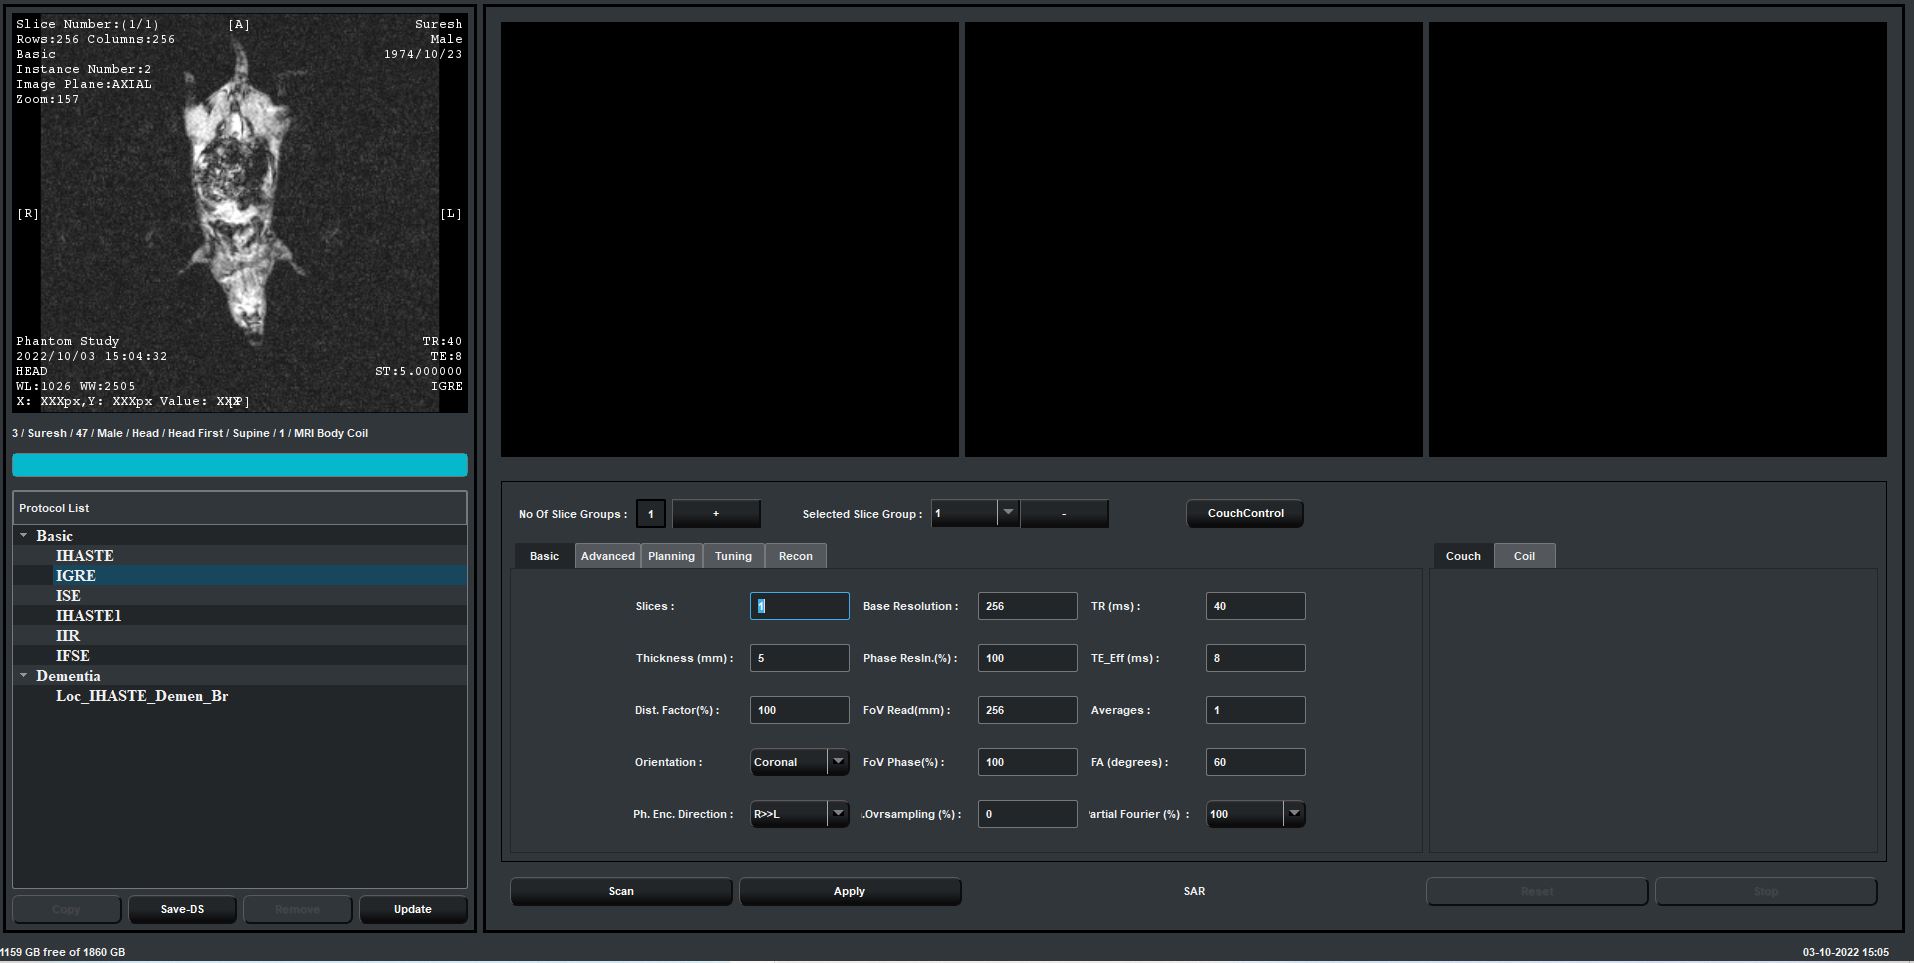
The results of simulating the front end are presented in figure 4 a) and b), were in the figure.4-a) depicts the response in isolation mode, with a -434dB isolation (S2,1). The response in insertion mode, which can be seen in Figure 4-b), results in a gain of 51.96dB. (S2,1). A bench test of the circuit is conducted before integration. An insertion of 0.5dB, gain of 49dB and isolation of 130dB is obtained which can be observed in figure 4- c) and d) respectively. These data were observed on a spectrum analyzer(N9000A) when the front end was subjected to constant input power of -50dB at 63.87MHz from an RF source/signal generator(E8257d). This circuit was integrated with a 1.5T MRI, and a 5-inch surface coil, and images were taken. The front is controlled with the ADC_ON trigger generated by the spectrometer. The pictures produced with this front end are shown in figure 5. The image of the rat is in the coronal plane at slice position 0, and we used a standard GRE scan with a body birdcage coil transmitter and surface coil receiver.DISCUSSION & CONCLUSION
This research focuses on the design and development of a customized RF front end for 1.5T MRI (center frequency of 63.87MHz). wherein the front end is constructed employing ADC-based post-processing calculations. This front end was designed, implemented, executed, and integrated with coils and a spectrometer. The front end selected with custom design ensures that sufficient isolation between the coil and receiver is maintained throughout the operation, and a good degree of agreement was achieved in simulated and measured results.Acknowledgements
This work is supported by SAMEER (Society for Applied Microwave Electronics Engineering & Research ) IMRI project sanctioned by the Ministry of Electronics and Information technology (Meity), Government of India.References
1. Redpath T W, signal-to-noise ratio in MRI The British Journal of Radiology, July 1998 704-707
2. Friedrich Axel, Greim Helmut, Kreischer Ludwig, Radio Frequency receiver unit for MR apparatus United States Patent 6,160,400 Dec. 12, 2000
3. Burl Michael, Zou Xueming Mark, Transmit mode coil detuning for MRI system United States Patent US 6,850,067 B1 Frb. 1, 2005
4. Vartiovaara p. Ville, Detuning circuits an detuning method for an MRI system United States Patent US 8,013,609 B2 Sep. 6, 2011
5. Yang Xiaoyu, zheng Tsinghua, MRI coil with PIN diode decoupling circuit United States Patent US 10,120,045 B2 Nov. 6, 2018
6. M/A-COM Technology Solutions Inc, Design with PIN Diodes application note AG312.
7. Microsemi Microwave products, PIN diode switch driver datasheet MSD7801.
Figures