3728
ADC Repeatability and Reproducibility of NCI CIRP Network Pre-Clinical MRIs
Dariya Malyarenko1, Ghoncheh Amouzandeh1,2, Stephen Pickup3, Rong Zhou3, Henry Charles Manning4, Seth T Gamon4, Kooresh I Shoghi5, James D Quirk5, Renuka Sriram6, Peder Larson6, Michael T Lewis7, Robia G Pautler7, Paul E Kinahan8, Mark Muzi8, and Thomas L. Chenevert1
1Radiology, University of Michigan, Ann Arbor, MI, United States, 2neuro42, San Francisco, CA, United States, 3Radiology, University of Pennsylvania, Philadelphia, PA, United States, 4Cancer Systems Imaging, The University of Texas MDACC, Houston, TX, United States, 5Mallinckrodt Institute of Radiology, Washington University School of Medicine, St. Louis, MO, United States, 6Department of Radiology & Biomedical Imaging, University of California San Francisco, San Francisco, CA, United States, 7Baylor College of Medicine, Houston, TX, United States, 8Radiology, University of Washington, Seattle, WA, United States
1Radiology, University of Michigan, Ann Arbor, MI, United States, 2neuro42, San Francisco, CA, United States, 3Radiology, University of Pennsylvania, Philadelphia, PA, United States, 4Cancer Systems Imaging, The University of Texas MDACC, Houston, TX, United States, 5Mallinckrodt Institute of Radiology, Washington University School of Medicine, St. Louis, MO, United States, 6Department of Radiology & Biomedical Imaging, University of California San Francisco, San Francisco, CA, United States, 7Baylor College of Medicine, Houston, TX, United States, 8Radiology, University of Washington, Seattle, WA, United States
Synopsis
Keywords: System Imperfections: Measurement & Correction, Precision & Accuracy
The goal of this work was to assess ADC repeatability, reproducibility, and bias of Co-Clinical Imaging Research Resource Program (CIRP) network MRIs using standardized procedures for comparison to corresponding performance of clinical MRIs. A temperature-controlled phantom provided an absolute reference standard and means to assess spatial uniformity of these metrics. Seven institutions participated in the study where DWI were acquired over multiple days on 10 pre-clinical scanners, from 3 vendors at 6 field strengths. Technical level repeatability and reproducibility metrics, and spatial uniformity patterns are comparable to that observed on human systems using similar phantoms and test procedures.Introduction
A goal of the NCI Co-Clinical Imaging Research Resource Program (CIRP) is to develop quantitative imaging biomarkers applicable to both human and corollary pre-clinical domains to advance state-of-the-art translational quantitative imaging methodologies from mouse to human 1. ADC precision and bias profiles of human MRIs have been documented in prior studies 2-4, though cross-platform reproducibility of pre-clinical MRIs is somewhat sparse 5. This study was performed to establish ADC measurement performance of pre-clinical MRIs employed across the CIRP network as part of their associated co-clinical trials.Methods
DWI Phantom and Scan Protocol: A cylindrical ice-water phantom (29mm OD) established temperature-controlled water diffusion within an 8mm diameter concentric measurement tube for absolute ADC bias along the scanner z-axis. Following provided phantom preparation/scan procedures, thermal equilibrium was established quickly (~5min) and held for over 90min which was sufficient to collect two sequential (intra-exam) DWI scans using a standardized DWI acquisition protocol: 32mm FOV, 64x64 matrix; 29 axial 2mm slices; three-orthogonal DWI axes with nominal b-values = 0, 1000, 2000 s/mm2; and Tacq = 15min. The phantom preparation/scan procedure was repeated a second day to assess both short-term and long-term (inter-exam) repeatability.Multi-site Phantom Round-Robin: The DWI phantom kit was circulated to 7 CIRP institutions and scanned on 10 pre-clinical MRIs, on three vendor platforms, at 6 field strengths as summarized in Table 1. Each site was instructed to provide DWI in vendor-native and ITK-compatible formats. Vendor-format DWI from all systems were processed at a central lab to generate ADC maps and ROI analysis as a function of location along the z-axis since ADC spatial uniformity was a secondary aim. Central lab Matlab scripts utilized a 2-parameter linear fit of log signal vs. vendor-provided b-values to generate 3 directional diffusivity maps averaged to create the ADC map. In addition, each CIRP site converted its own DWI into ADC and preformed independent ROI analysis for comparison of central- vs. site-based processing since detection of variability due to processing workflow which was another study aim.
Performance Metrics: Difference in ROI mean ADC from a pair of consecutive DWI scans within each scan session and day-to-day differences were used to estimate short-term and long-term repeatability, respectively. Within-system standard deviation (wSD), repeatability coefficient (RC), coefficient of variation (wCV), cross-system standard deviation (SD) and reproducibility coefficient (RDC) were calculated using established methods 6, 7. Absolute ADC bias relative to the known diffusion coefficient of 0o C water (Dtrue = 1.1µm2/ms) 8 was measured at isocenter and plots of ADC vs. z-location illustrate the degree of system-specific spatial uniformity. Finally, differences between central lab- vs. site-based results were plotted to illustrate relative impact of analysis path variability.
Results and Discussion
Figure 1 illustrates median (symbol) and range (error bar) of ADC measured at isocenter over all scans for each system. The solid horizontal line indicates the known true diffusion coefficient of water at 0 Co and dashed lines are ±5% bias error relative to Dtrue. Relatively small error bar range (max and min) of each system indicates absolute system bias was repeatable, thus measurable by these few scans. Note, eight of 10 MRI systems were within ±3% bias (mostly positive) and the remaining two exceeded +10% bias. Figure 2 shows individual scanner ADC uniformity profiles (wrt z-axis) plotted as “percent bias” relative to the known diffusion coefficient. The typical profile of peak ADC at isocenter that reduces quadratically with |z| distance is consistent with gradient non-linearity patterns 2, 9. Again, systems 1-8 have low bias (at isocenter) whereas systems 9 and 10 exhibit significant bias error. Combining all systems, variability reflecting short- and long-term repeatability, and cross-system reproducibility are displayed as shaded regions in Figure 3a-c. Here, the shaded regions are the relevant standard deviation metric expressed as a percentage of Dtrue, ±offset relative to mean bias, plotted as a function of z-location. Using vertical width of shaded region as an indicator of variability, short- and long-term variability are ~1-3% (at isocenter), whereas cross-system variability is ~10-12%. Figure 3d shows effect of analysis workflow as the difference between central-lab vs. site-processing of common datasets, plotted as % relative to Dtrue. Analysis results were effectively equivalent (<1% RMSD) for 5 of 8 systems, whereas significant differences were seen for Sys7, Sys2, and Sys6. Note, all panels in Figure 3 are plotted on the same scale to facilitate visual comparison of variability due to repeatability, reproducibility, bias and processing workflow. Table 2 summarizes performance metrics reflective of pre-clinical MRIs derived from this study. A key finding of this work was that performance of pre-clinical MRIs at isocenter resembles clinical MRIs in terms of: low average bias (<5%), good repeatability (short-term wCV = 0.73%; long-term wCV = 1.26%) and cross-system reproducibility (SD = 0.068µm2/ms or 6.2% of Dtrue).Conclusions
Well calibrated pre-clinical MRI systems are capable of highly repeatable and reproducible ADC measurements with low bias using standardized DWI data acquisition and processing protocols. Technical level repeatability and reproducibility metrics, and spatial uniformity patterns are consistent with that observed on human systems using similar phantoms and test procedures.Acknowledgements
Funding support from NIH Grants: U01CA166104, U24CA237683, U24CA231858, U24CA220325, U24CA209837, U24CA209837, U24CA253377, U24CA226110, U24CA264044 and R01CA190299.References
- Shoghi, K.I., et al., Co-Clinical Imaging Resource Program (CIRP): Bridging the Translational Divide to Advance Precision Medicine. Tomography, 2020. 6(3): p. 273-287.
- Malyarenko, D.I., et al., Demonstration of nonlinearity bias in the measurement of the apparent diffusion coefficient in multicenter trials. Magn Reson Med, 2016. 75(3): p. 1312-23.
- Newitt, D.C., et al., Multisite concordance of apparent diffusion coefficient measurements across the NCI Quantitative Imaging Network. J Med Imaging (Bellingham), 2018. 5(1): p. 011003.
- Palacios, E.M., et al., Toward Precision and Reproducibility of Diffusion Tensor Imaging: A Multicenter Diffusion Phantom and Traveling Volunteer Study. AJNR Am J Neuroradiol, 2017. 38(3): p. 537-545.
- Doblas, S., et al., Apparent diffusion coefficient is highly reproducible on preclinical imaging systems: Evidence from a seven-center multivendor study. J Magn Reson Imaging, 2015. 42(6): p. 1759-64.
- Raunig, D.L., et al., Quantitative imaging biomarkers: a review of statistical methods for technical performance assessment. Stat Methods Med Res, 2015. 24(1): p. 27-67.
- Shukla-Dave, A., et al., Quantitative imaging biomarkers alliance (QIBA) recommendations for improved precision of DWI and DCE-MRI derived biomarkers in multicenter oncology trials. J Magn Reson Imaging, 2019. 49(7): p. e101-e121.
- Holz, M., S.R. Heil, and A. Sacco, Temperature-dependent self-diffusion coefficients of water and six selected molecular liquids for calibration in accurate H-1 NMR PFG measurements. Physical Chemistry Chemical Physics, 2000. 2(20): p. 4740-4742.
- Malyarenko, D.I., B.D. Ross, and T.L. Chenevert, Analysis and correction of gradient nonlinearity bias in apparent diffusion coefficient measurements. Magn Reson Med, 2014. 71(3): p. 1312-23.
Figures
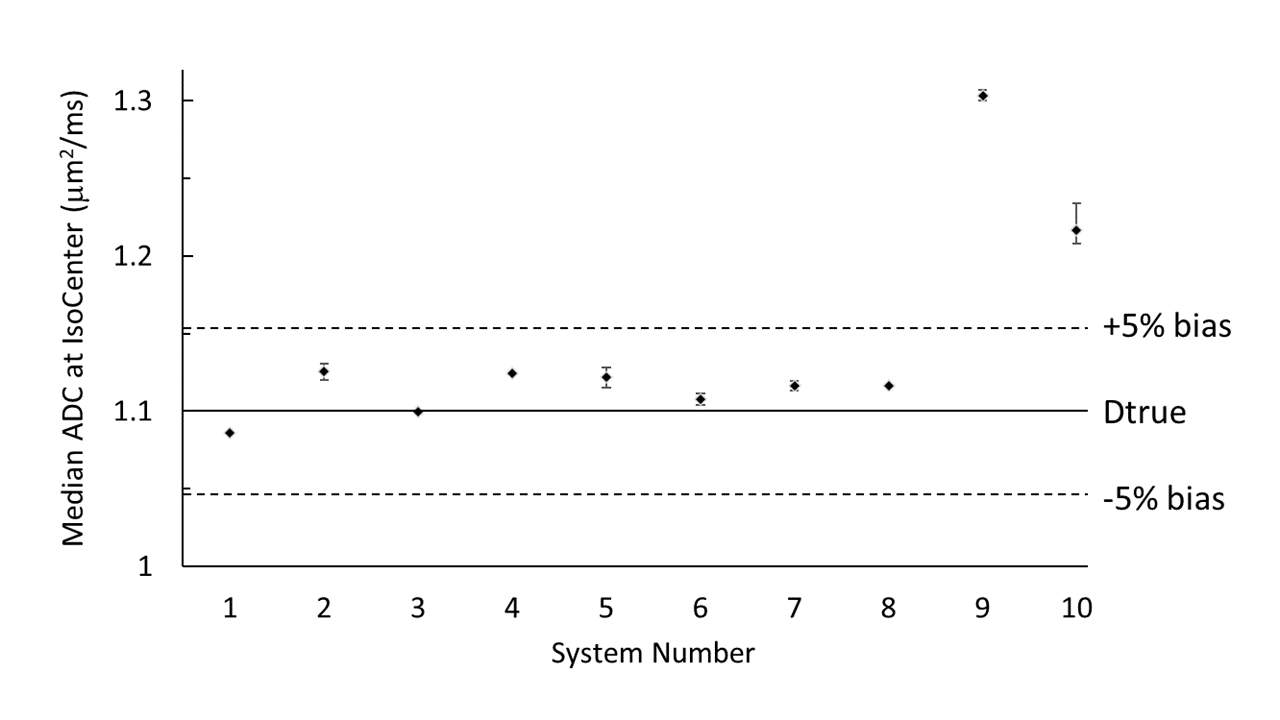
Figure 1: Median
ADC measured at isocenter of each system.
Each data point is the median of all scans (up to 4) from each system
and error bars indicate range (maximum and minimum) isocenter ADC value. The solid line marks Dtrue (1.1µm2/ms)
and dashed lines are ±5% relative to Dtrue.
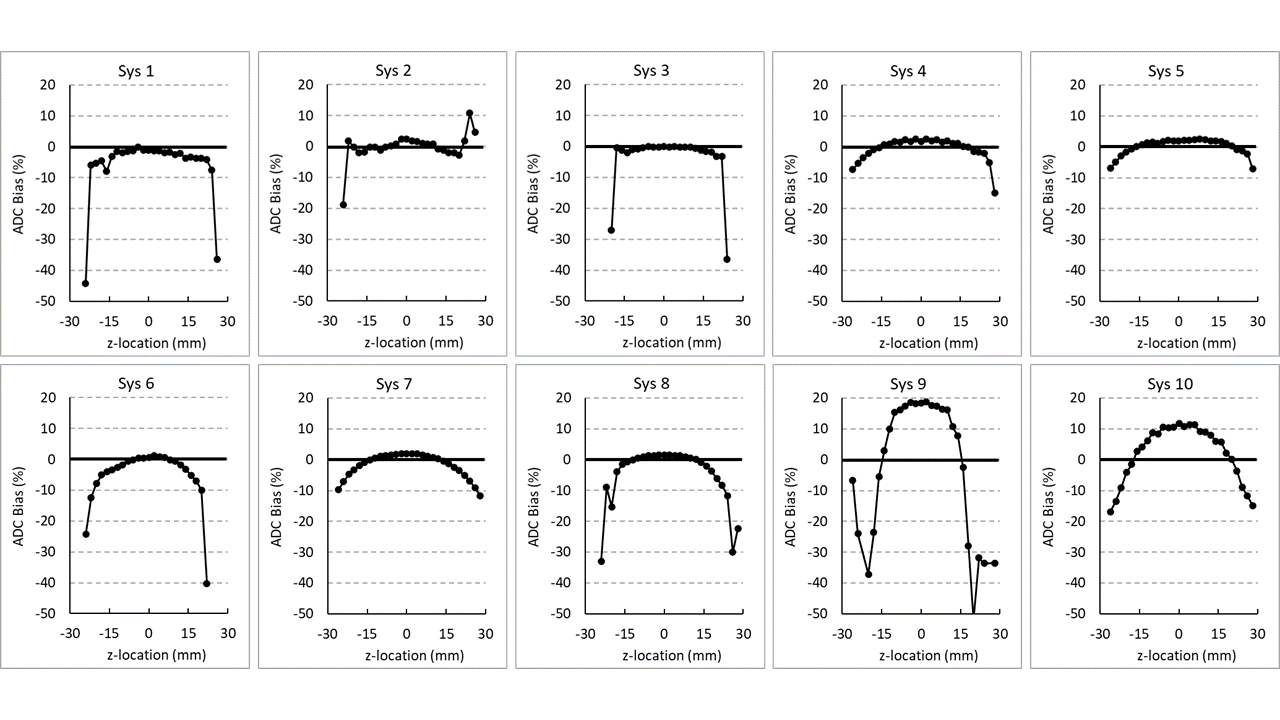
Figure 2: Percent bias of ten CIRP MRI systems relative to Dtrue as a function
of z-axis location.
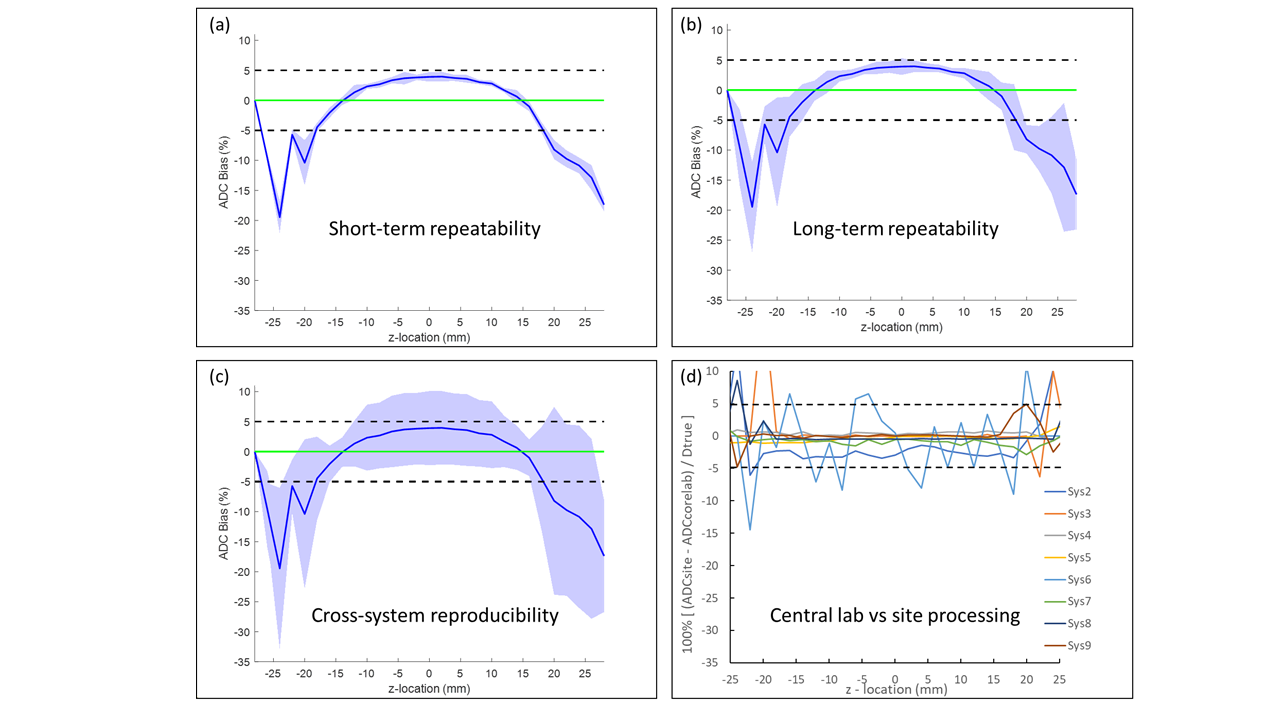
Figure 3: (a) Mean bias (blue line) and short-term (intra-exam) repeatability
relative to Dtrue plotted as a function of z-axis location. (b) Corresponding plots for long-term (day-to-day)
repeatability. Shaded regions in (a) and
(b) represents [bias ± 100% · wSD/Dtrue]. (c)
Cross-system reproducibility where shaded region represents [bias ± 100% · SD/Dtrue]. Green line denotes ideal 0% bias. (d) Difference between site-generated and central
lab-generated ADC relative to Dtrue.
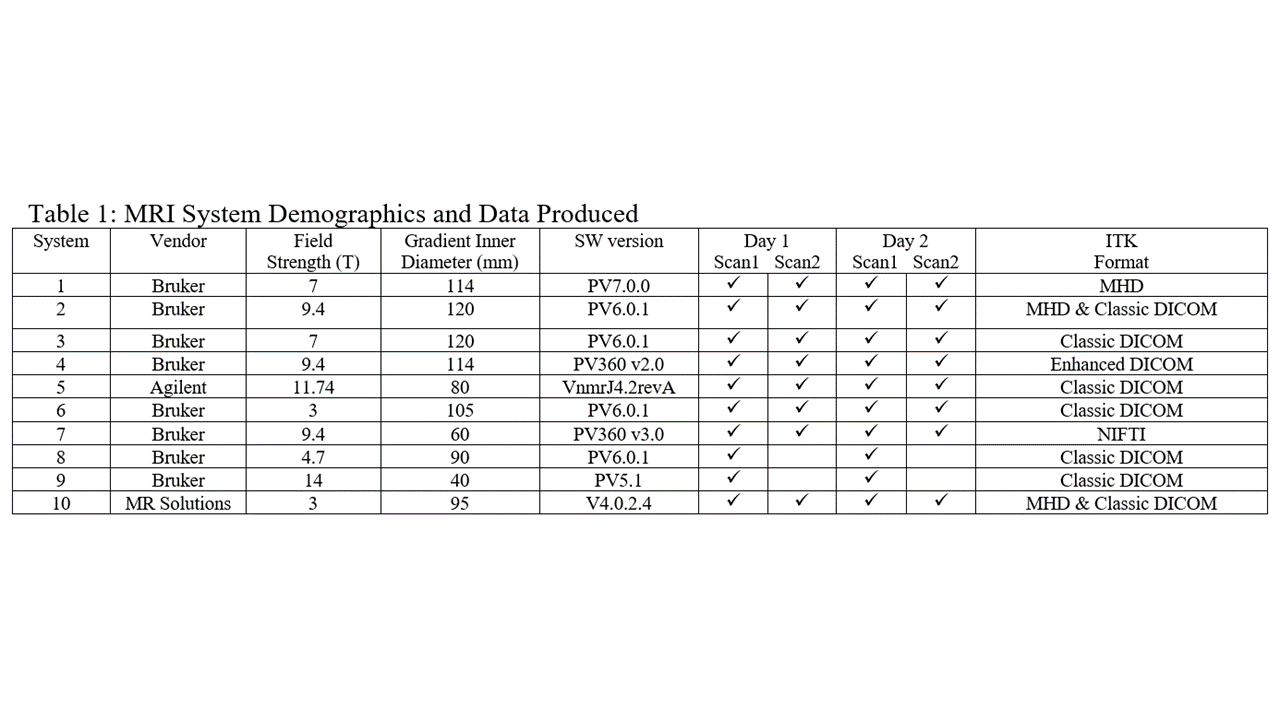
Table 1.
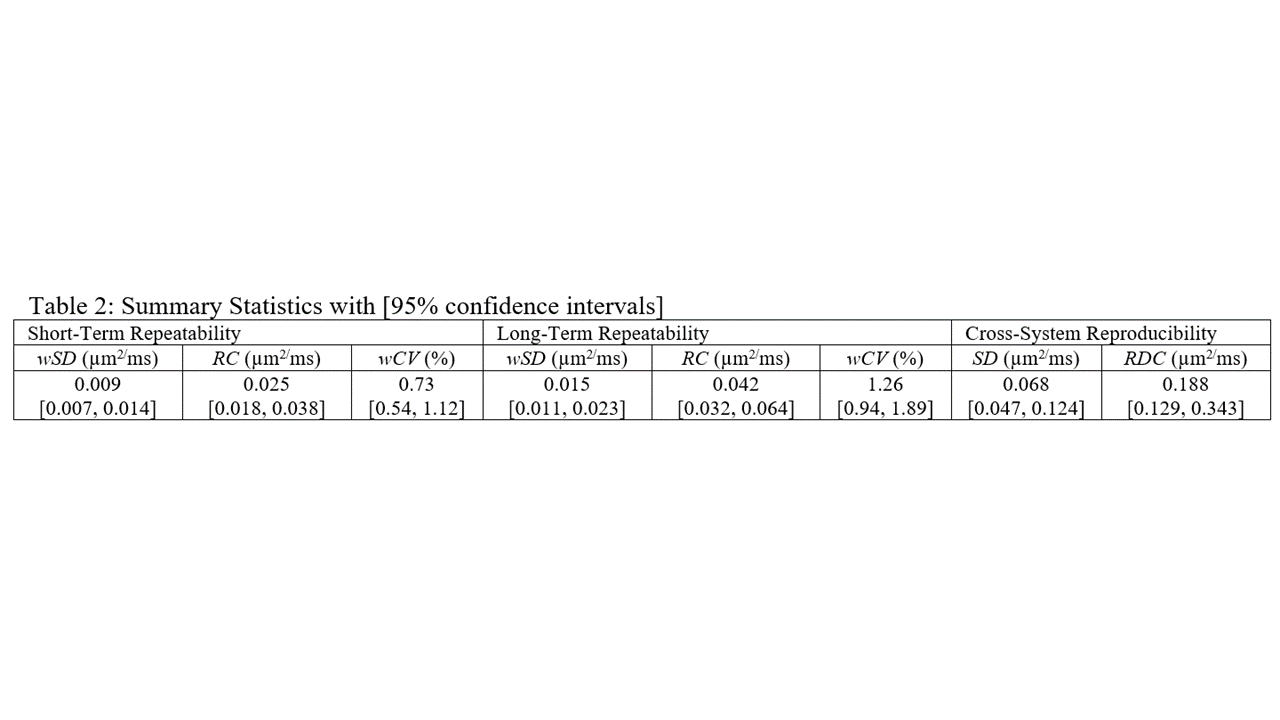
Table 2.
DOI: https://doi.org/10.58530/2023/3728