3727
Comparing 8-channel and 4-channel head array coils for 7T human brain Deuterium MRS imaging (DMRSI) applications1Department of Radiology, University of Minnesota, Minneapolis, MN, United States
Synopsis
Keywords: RF Arrays & Systems, Non-Proton
Deuterium MRS imaging (DMRSI) has emerged as an important neuro-metabolic imaging tool. We compared the performance of 4-channel and 8-channel deuterium head array coils for 7T human brain DMRSI through electromagnetic simulation, phantom and in vivo measurements. Both simulation and phantom studies show that the 4-channel array coil produced more than twice the RF magnetic field (B1) than the 8-channel array coil. Whole-brain DRMSI data with high spatial (0.7 cc nominal voxel) and temporal (2.5 min) resolutions was collected from five healthy subjects using a 4-channel head array coil, showing excellent SNR throughout the human brain.
Introduction:
Deuterium MRS imaging (DMRSI) technology has received increasing attention because it can simultaneously measure glycolysis and TCA cycle activity and/or map the Warburg Effect in brain tumors 1-7. However, it is still challenging to achieve high SNR and adequate spatiotemporal resolution even at ultrahigh field (UHF). In this study, we compared the performance of 4- and 8-channel deuterium head array coils, and demonstrated superior performance of the 4-channel array coil for human brain DMRSI at 7T.Methods:
Electromagnetic (EM) simulation of array coils:In CST Studio 2019 with Hexhedral Time Domain solve, we modeled 4- and 8-channel deuterium head array coils with similar sized coil formers (Fig. 1C), and tuned and matched them to 45.6, 60, 78.8 and 297 MHz, respectively, to simulate the RF magnetic transmission (B1+) and reception (B1-) fields using an optimization method 8.
Phantom studies using the 4- and 8-channel array coils:
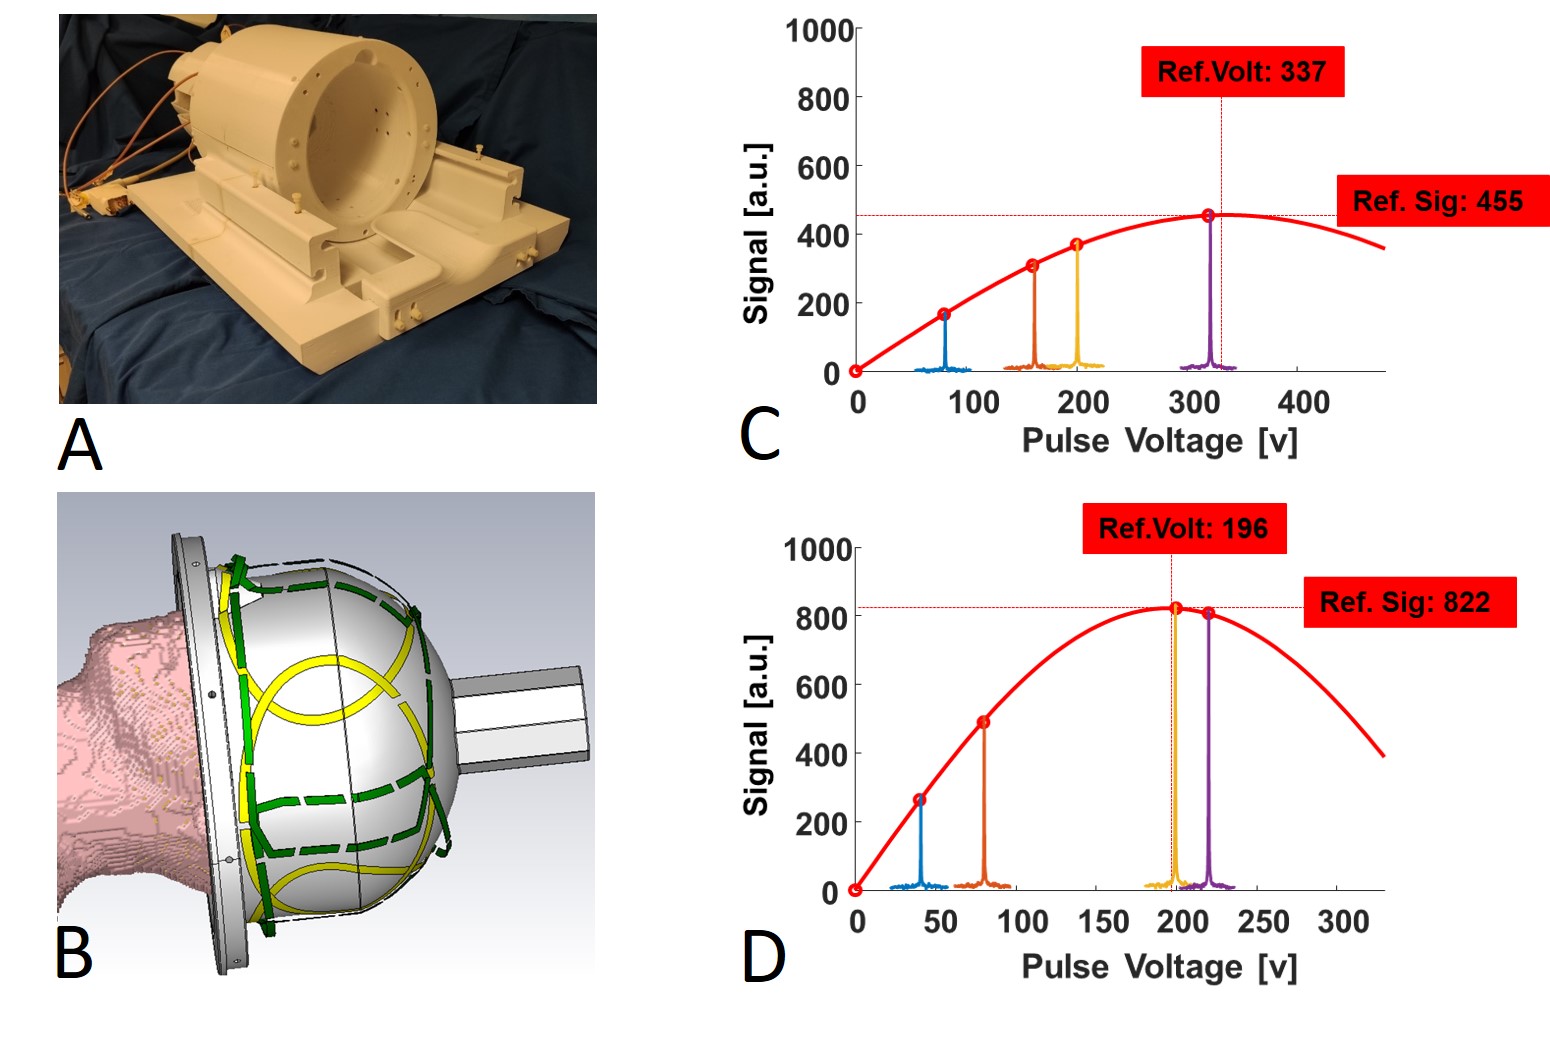
To verify the simulation results, we built a 4-channel 1H/2H array coil 9 (see the prototype coil and layout in Fig. 2A-B) and another 8-channel coils 10 with excellent decoupling among the 2H loop coils. Both coils were loaded with a head shape water phantom and tuned/matched to 2H Larmor frequency at 7T (45.6 MHz) for B1 fields mapping.
In vivo DMRSI data acquisition and processing:
We obtained high-resolution (0.7 cc nominal voxel and 2.5 min) whole-brain DMRSI in five healthy subjects using the natural abundance deuterium water (HDO) signals and Fourier Series Window (FSW) weighted FID-CSI 11 (RF pulse=0.5ms, matrix=19×19×15 , FOV=18×18×15cm3, TR=173ms, cylinder voxel shape), which were processed via 3D FFT, Whitening Singular Value Decomposition (WSVD) 12,13 to combine all-channel FIDs, 10-Hz line-broadening filter (LB) in time domain, and zero padding. To compare SNR with the reported 9.4T results 5, we processed the 2H CSI spectra with 3D FFT and zero padding only.
Results:
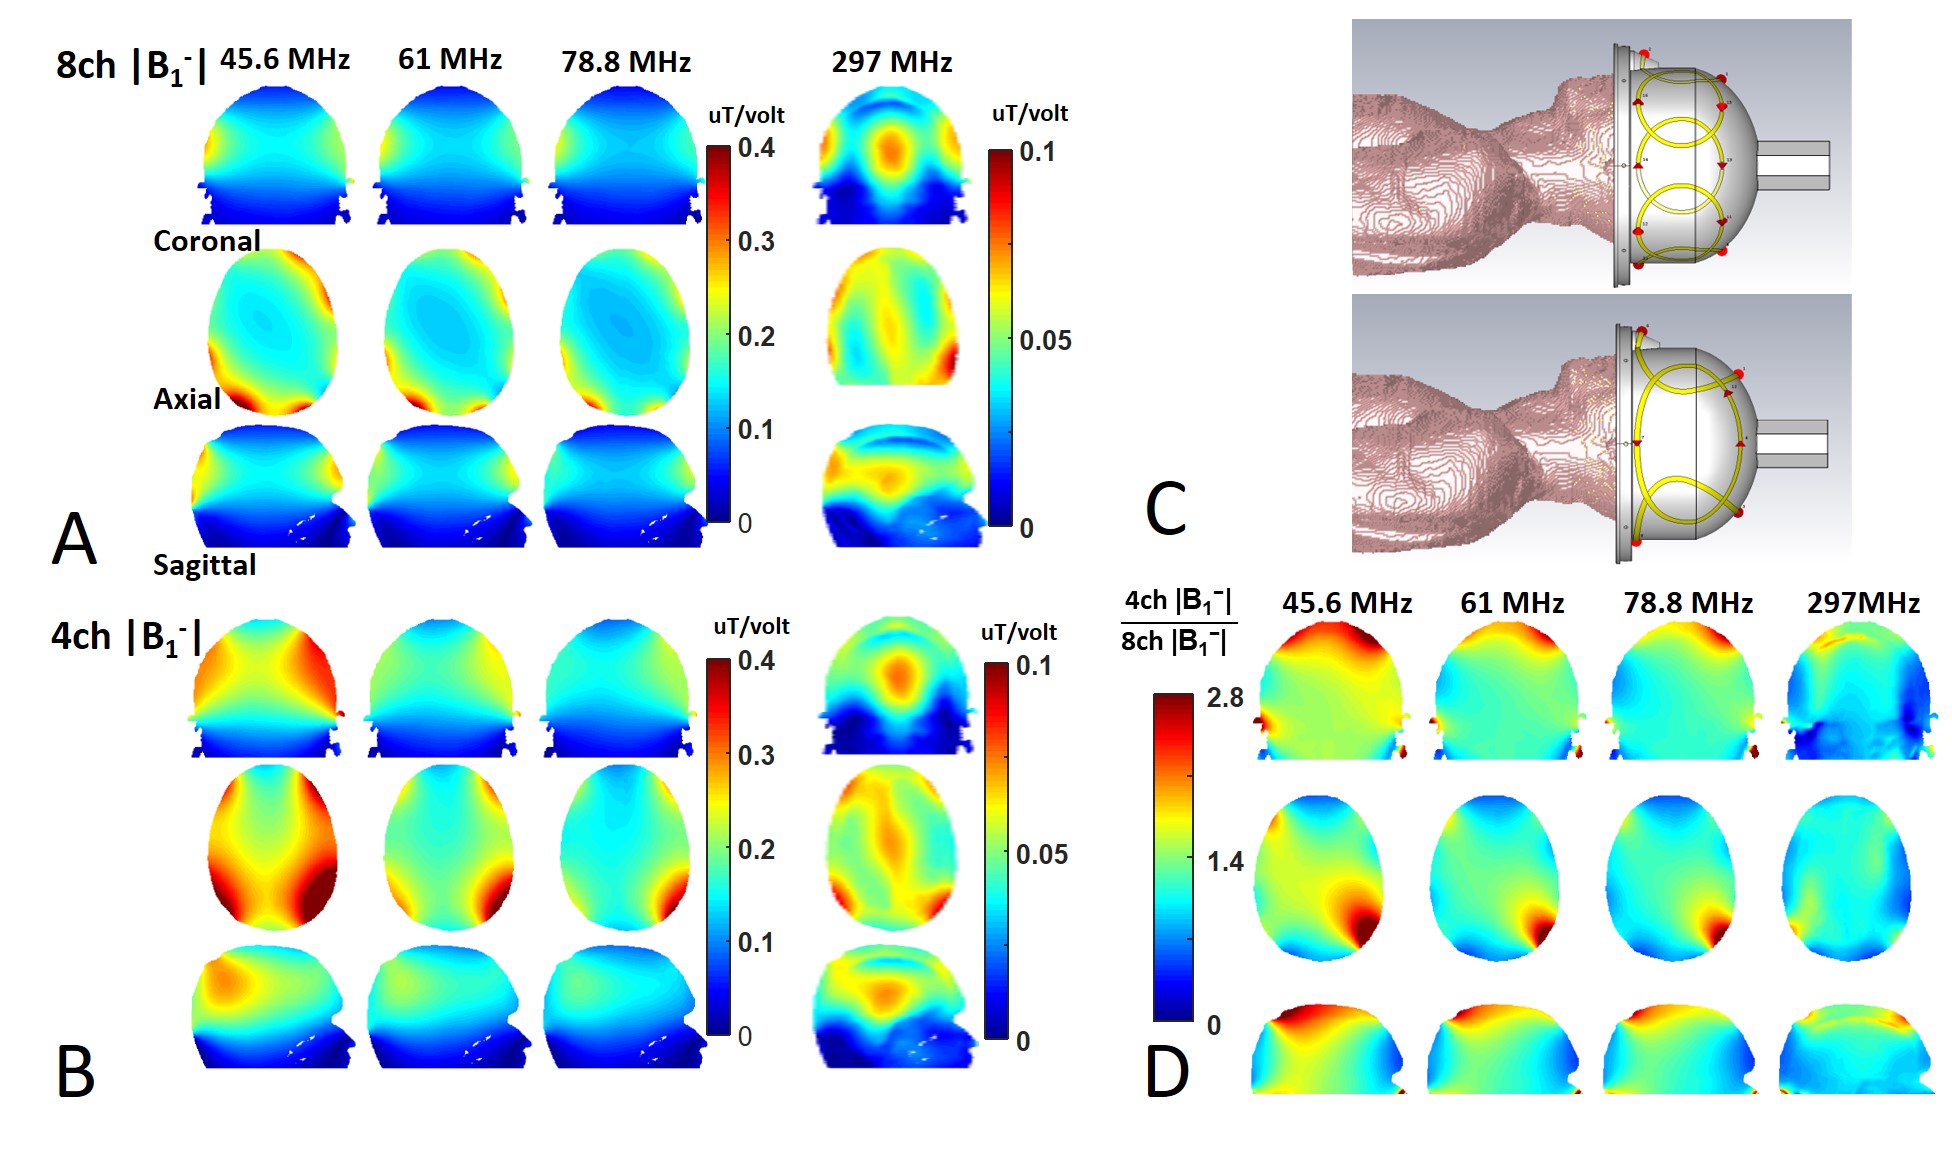
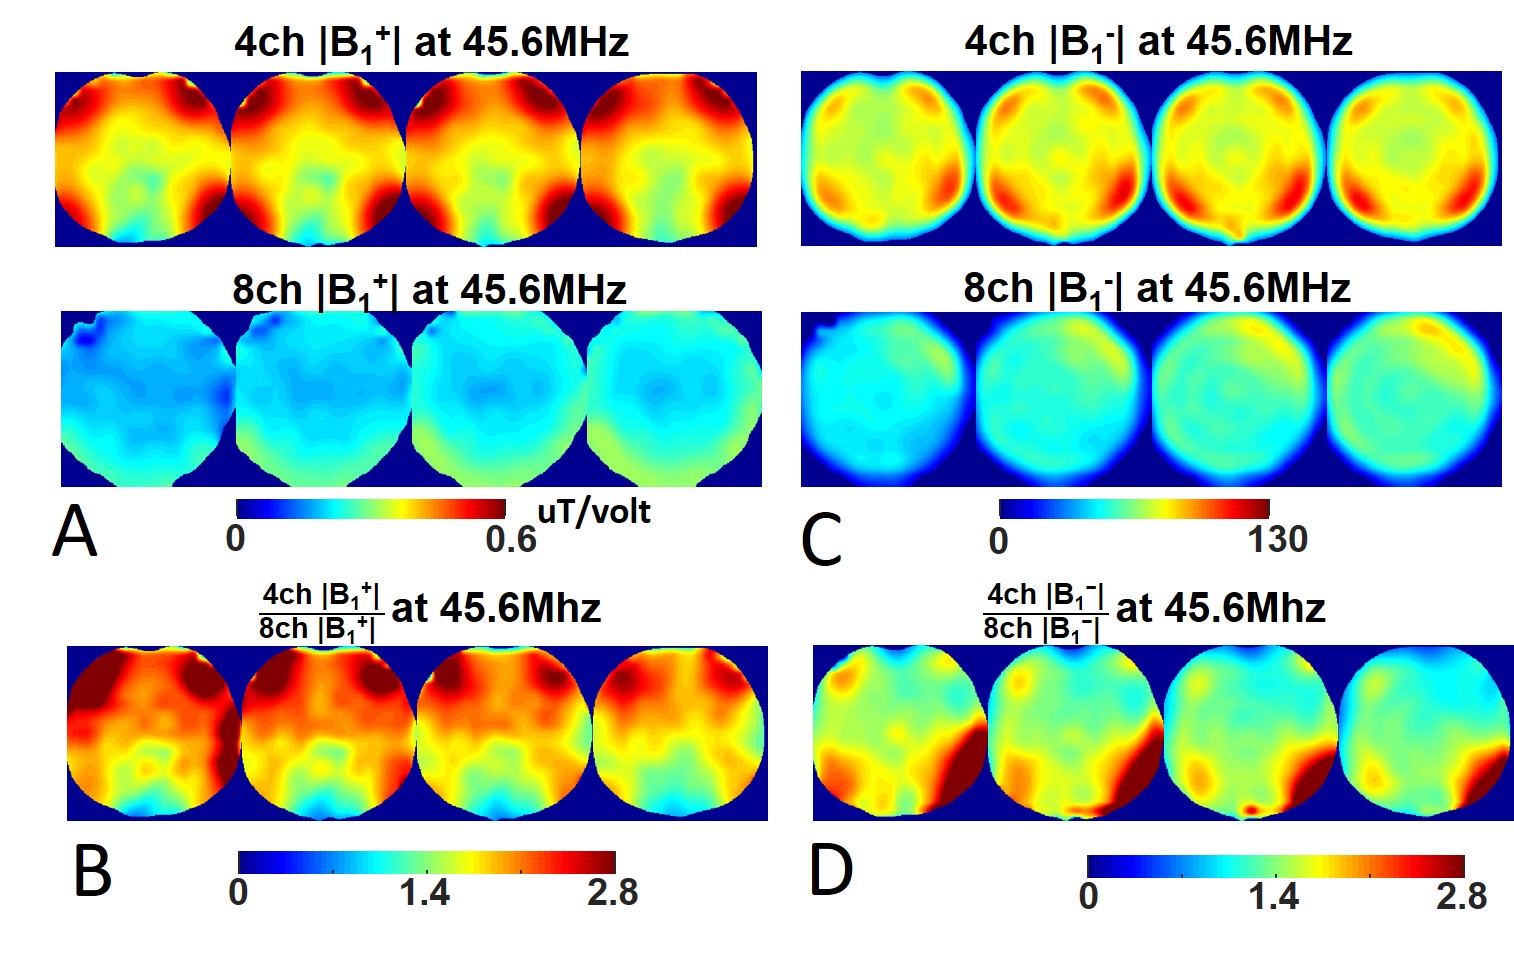
Figure 1 displays the CST simulated |B1-| maps at different Larmor frequencies loaded with the “Duke” human model for the 4-channel (4ch |B1-|, Fig. 1B) and 8-channel (8ch |B1-|, Fig. 1A) array coils and their ratio maps (Fig. 1D). The 7T 2H 4ch |B1-| strength is more than twice higher than that of 8ch |B1-| in most areas within the Duke brain. As Larmor frequency increases, the ratio of 4ch over 8ch |B1-| decreases. As a result, large areas within the Duke brain show similar 4ch and 8ch |B1-| at 297 MHz for 7T proton MRI.Figure 2 shows a prototype 4-channel 1H/2H head array coil (Figs. 2A-2B) and the result of global pulse calibration for the 4ch (Fig. 2D) and 8ch (Fig. 2C) deuterium array coils loaded with phantom. Fits the HDO signals to the RF pulse voltage according to a “sine” function to determine the nominal 90-degree flip angle voltages (∝1/B1+) and corresponding peak signal intensity (i.e., ∝ relative B1-). We found that both B1+ and B1- of the 4ch 2H array coil are >1.8 times higher than that of the 8ch array coil with similar noise levels. Figure 3 shows the experimentally measured B1+ (Fig. 3A) and B1- (Fig. 3C) maps of the 4ch and 8ch 2H array coils. The B1+ and B1- ratio maps of the 4ch coil over the 8ch coil are shown in Fig. 3B and Fig. 3D, respectively, clearly showing that the B1 fields are stronger for the 4ch 2H array coil.
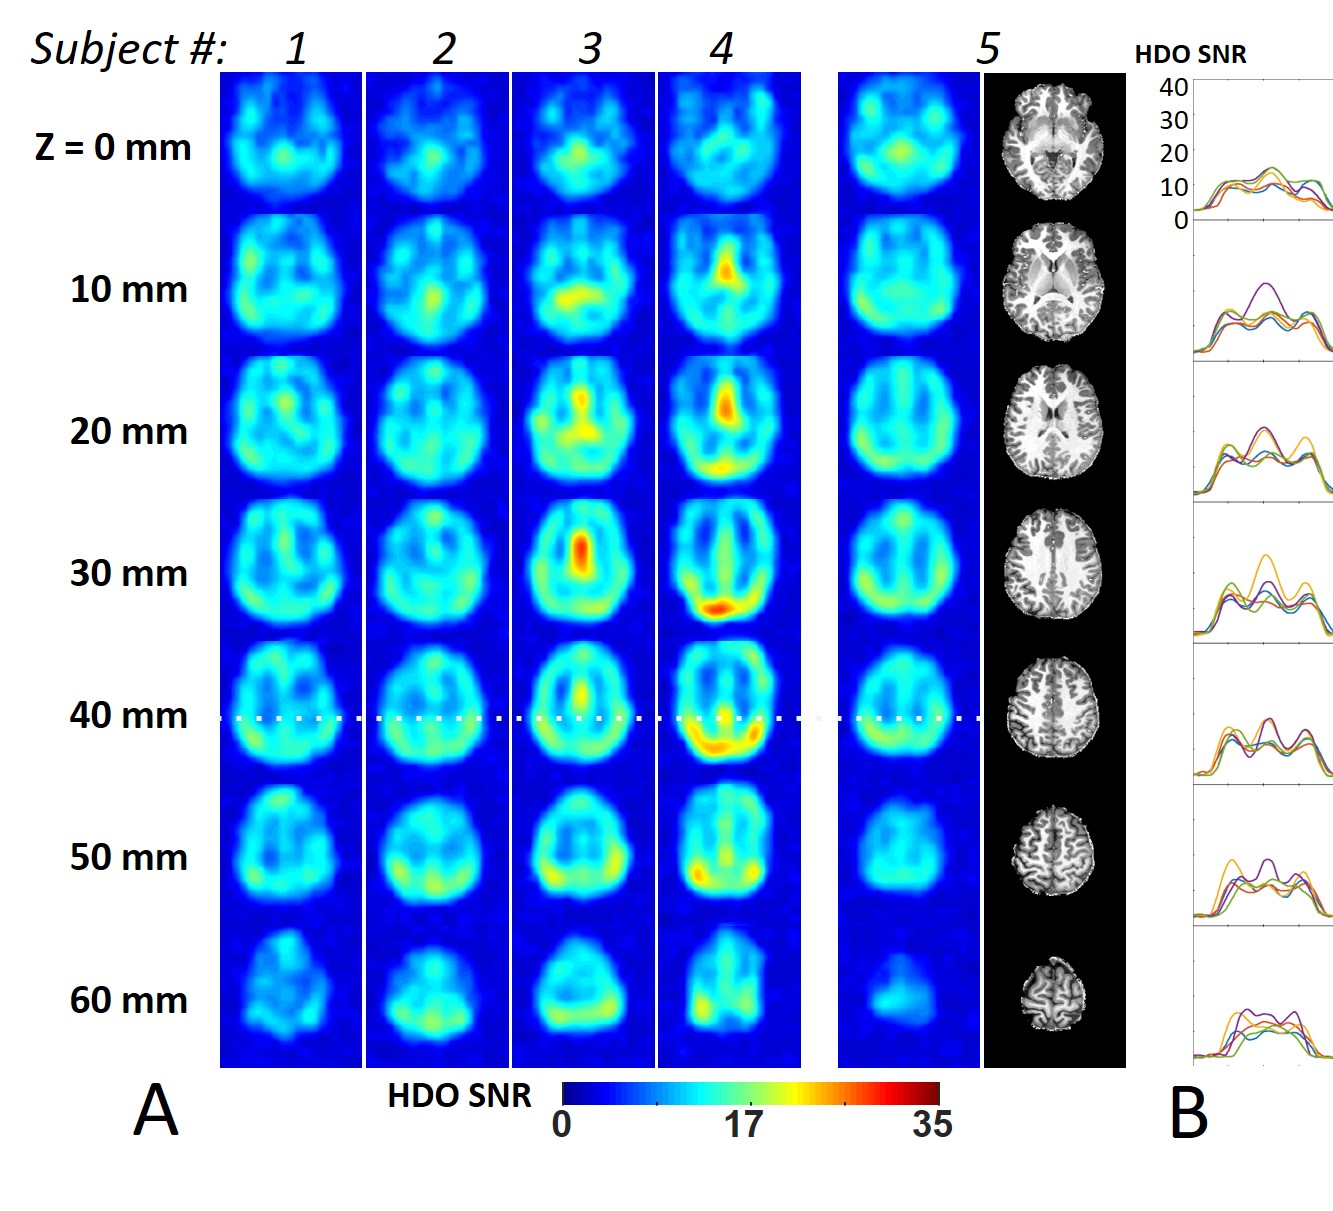
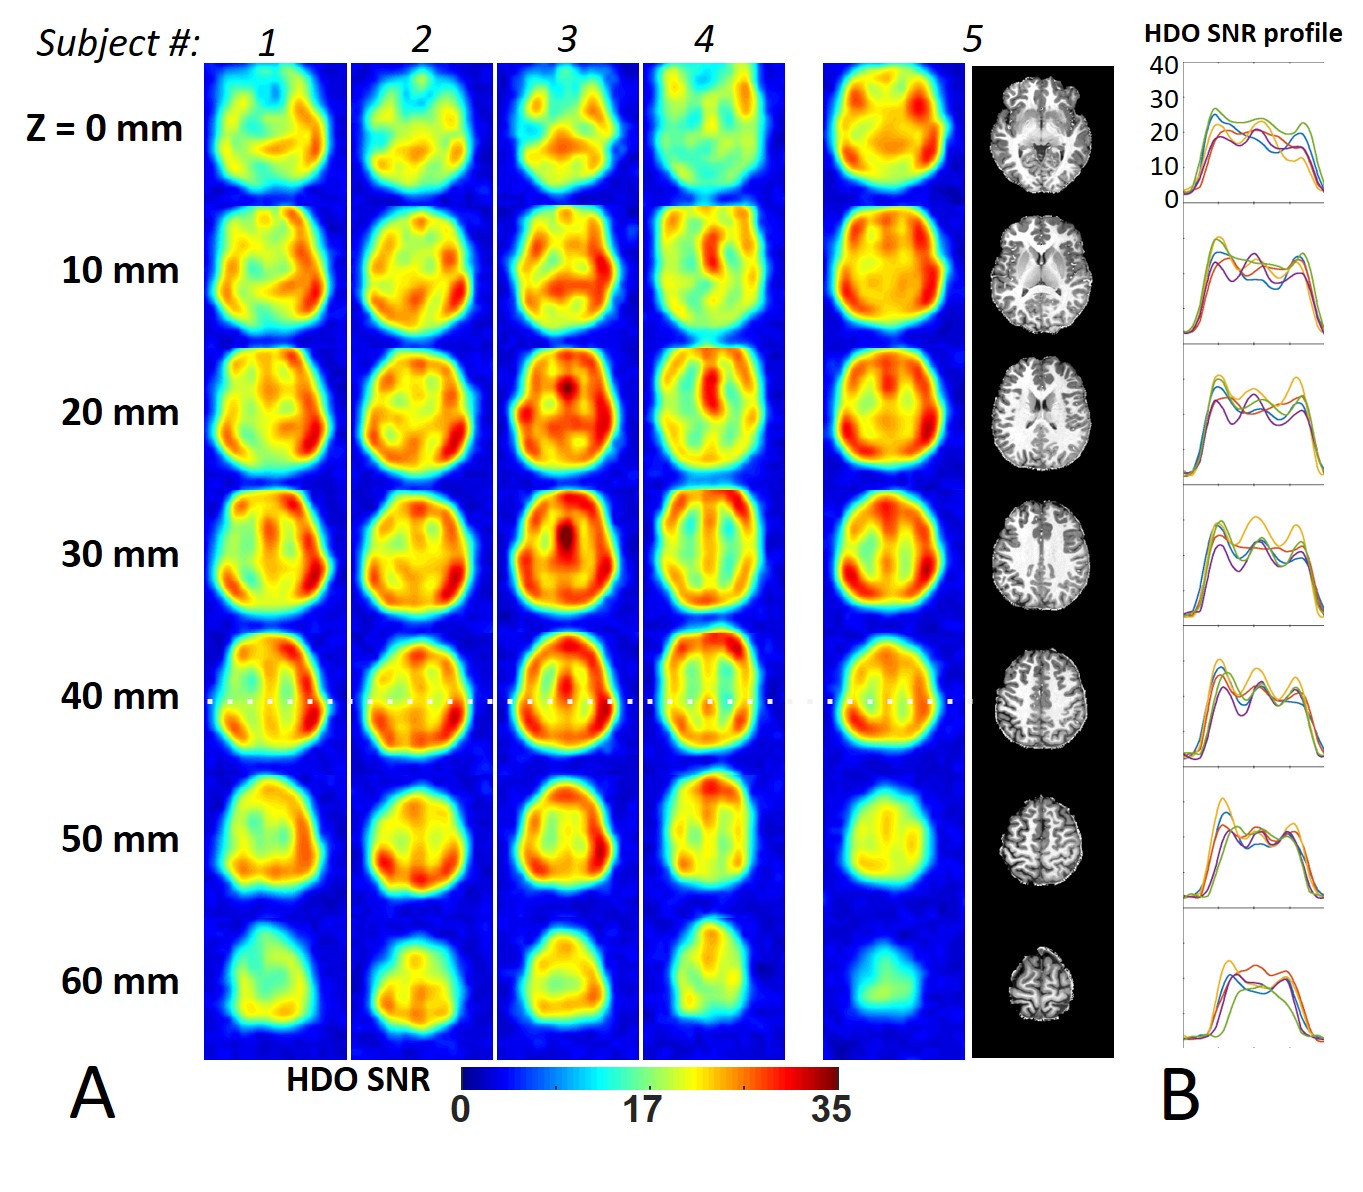
The 7T human brain DMRSI results acquired from five healthy subjects are summarized in Figs. 4&5. Figure 4 shows the brain HDO SNR maps generated from all-channel combined spectra without LB and WSVD. The SNR in the human brain peripheral and interior areas were >10 for all subjects. Figure 5 shows enhanced SNR for all five DMRSI data after applying WSVD and 10-Hz LB, which reached SNR>20 in most of the brain regions.
Discussion & Conclusion:
In this study, through EM simulations, phantom and in vivo DMRSI measurements, we demonstrated that the 4-channel 2H head array coil operating at a low Larmor frequency offers stronger B1 fields and better homogeneity than the 8-channel array coil for 7T whole-brain DMRSI applications in human. Using a prototype 4-channel 2H head array coil, we acquired human brain DMRSI data at 0.7cc nominal voxel and 2.5min per volume resolution, and achieved SNR>10 (without LB and WSVD) and SNR>20 (with LB=10Hz and WSVD) in most interior and peripheral brain regions. This result is significantly better than a published work5, which shows SNR≈13 in peripheral and SNR≈5.5 in central brain regions with 10 min temporal resolution and 3 cc nominal voxel size using a 8-channel array coil at 9.4T.At low-γ X-nuclei Larmor frequencies, the spatial coverage of the B1 fields benefits largely from a large coil size. The relatively small coil loop size used in the 8ch 2H array coil limits B1 penetration into the human brain and is therefore less preferred compared to the 4ch 2H array coil. The latter provides a simpler, more cost-effective RF coil solution for human brain DMRSI applications at 7T with superior performance critical for imaging and studying the dynamics of deuterated brain metabolites after the administration of deuterium labeled glucose 2-4.
Acknowledgements
This work was supported in part by NIH grants of R01 CA240953, U01 EB026978 and P41 EB027061.References
1 Lu, M., Zhu, X. H., et al. Simultaneous Assessment of Abnormal Glycolysis and Oxidative Metabolisms in Brain Tumor using In Vivo Deuterium 2H MRS Imaging. in Proc. Intl. Soc. Mag. Reson. Med. 24, p. 3962 (2016).
2 Lu, M., Zhu, X. H., et al. High-resolution Deuterium MR Spectroscopic Imaging of the Warburg Effect in Brain Tumor. in Proc. Intl. Soc. Mag. Reson. Med. 26, p. 4852 (2018).
3 Lu, M., Zhu, X. H. et al. Quantitative assessment of brain glucose metabolic rates using in vivo deuterium magnetic resonance spectroscopy. J Cereb Blood Flow Metab 37, 3518-3530, doi:10.1177/0271678X17706444 (2017).
4 De Feyter, H. M., Behar, K. L., et al. Deuterium metabolic imaging (DMI) for MRI-based 3D mapping of metabolism in vivo. Sci Adv 4, eaat7314, doi:10.1126/sciadv.aat7314 (2018).
5 Ruhm, L., Avdievich, N., et al. Deuterium metabolic imaging in the human brain at 9.4 Tesla with high spatial and temporal resolution. Neuroimage 244, 118639, doi:10.1016/j.neuroimage.2021.118639 (2021).
6 Roig, E. S., De Feyter, H. M., et al. Deuterium metabolic imaging of the human brain in vivo at 7 T. Magnetic Resonance in Medicine, doi:10.1002/mrm.29439 (2022).
7 Zhu, X. H., Wiesner, H. M., et al. Differentiating TCA Cycle Activity of Gray and White Matter in Human Brain at 7T Using High Resolution Dynamic Deuterium MRS Imaging with SPICE. in Proc. Intl. Soc. Mag. Reson. Med. . 30, p. 4840 (2022).
8 Li, X., Pan, J. W., et al. Electromagnetic simulation of a 16-channel head transceiver at 7 T using circuit-spatial optimization. Magn Reson Med 85, 3463-3478, doi:10.1002/mrm.28672 (2021).
9 Li, X., Waks, M., et al. A multinuclear 4-channel 2H loop and 4-channel 1H microstrip array coil for human head MRS/MRI at 7T. in Proc. Intl. Soc. Mag. Reson. Med. . 30, p. (2022).
10 Soon, S. H., Waks, M., et al. Development of 8-Channel 1H-2H Dual-Frequency loop coil array with LC tanks for 1H MRI and 2H MRS imaging of human brain at 7 Tesla. in Proc. Intl. Soc. Mag. Reson. Med. . 30, p. 1542 (2022).
11 Hendrich, K., Hu, X., et al. Spectroscopic imaging of circular voxels with a two-dimensional Fourier-series window technique. J Magn Reson B 105, 225-232, doi:10.1006/jmrb.1994.1128 (1994).
12 Rodgers, C. T. & Robson, M. D. Receive array magnetic resonance spectroscopy: Whitened singular value decomposition (WSVD) gives optimal Bayesian solution. Magnetic Resonance in Medicine 63, 881-891, doi:10.1002/mrm.22230 (2010).
13 Bydder, M., Hamilton, G., et al. Optimal phased-array combination for spectroscopy. Magnetic Resonance Imaging 26, 847-850, doi:10.1016/j.mri.2008.01.050 (2008).
Figures