3726
In-bore Preamplifier Nonlinearity Calibration1Electrical Engineering, Stanford University, Stanford, CA, United States, 2GE Healthcare, Aurora, OH, United States, 3Radiology, Stanford University, Stanford, CA, United States
Synopsis
Keywords: Hybrid & Novel Systems Technology, System Imperfections: Measurement & Correction
Present MRI preamplifiers are very linear but use 10s of mA bias current and over 150mW power. For wireless arrays, low power alternatives based upon SiGe transistors are needed. These achieve the needed gain and noise figure, with order of magnitude power reduction, but at the cost of increased nonlinearity. Using pilot tone technology, we present a calibration system for preamplifier nonlinearity correction targeted to low power SiGe preamplifiers. This system integrated a phase-locked SDR into a form of prescan to demonstrate that in-bore preamplifier linearity calibration and correction are possible.Introduction
MRI phased array preamplifiers are presumed to be highly linear. Conventional MRI preamplifiers based upon pHEMT FET technology achieve this linearity but at the cost of high bias current (15-60mA) and power consumption in excess of 150mW per coil element. However, in the drive toward wearable, wireless receive arrays, such power consumption is untenable. Recent efforts employing SiGe bipolar devices can meet the noise figure and gain needs of MRI at bias currents well under 5mA and power consumption below 10mW [1]. However these devices exhibit an exponential non-linearity that could impact dynamic range in 3D sequences. Meanwhile, auxiliary tone injection has gained popularity for pilot tone motion correction, and free-run synchronization [2-6]. Here, we assess the use of tone-injection technology for in-bore calibration and correction of preamplifier nonlinearity.Methods
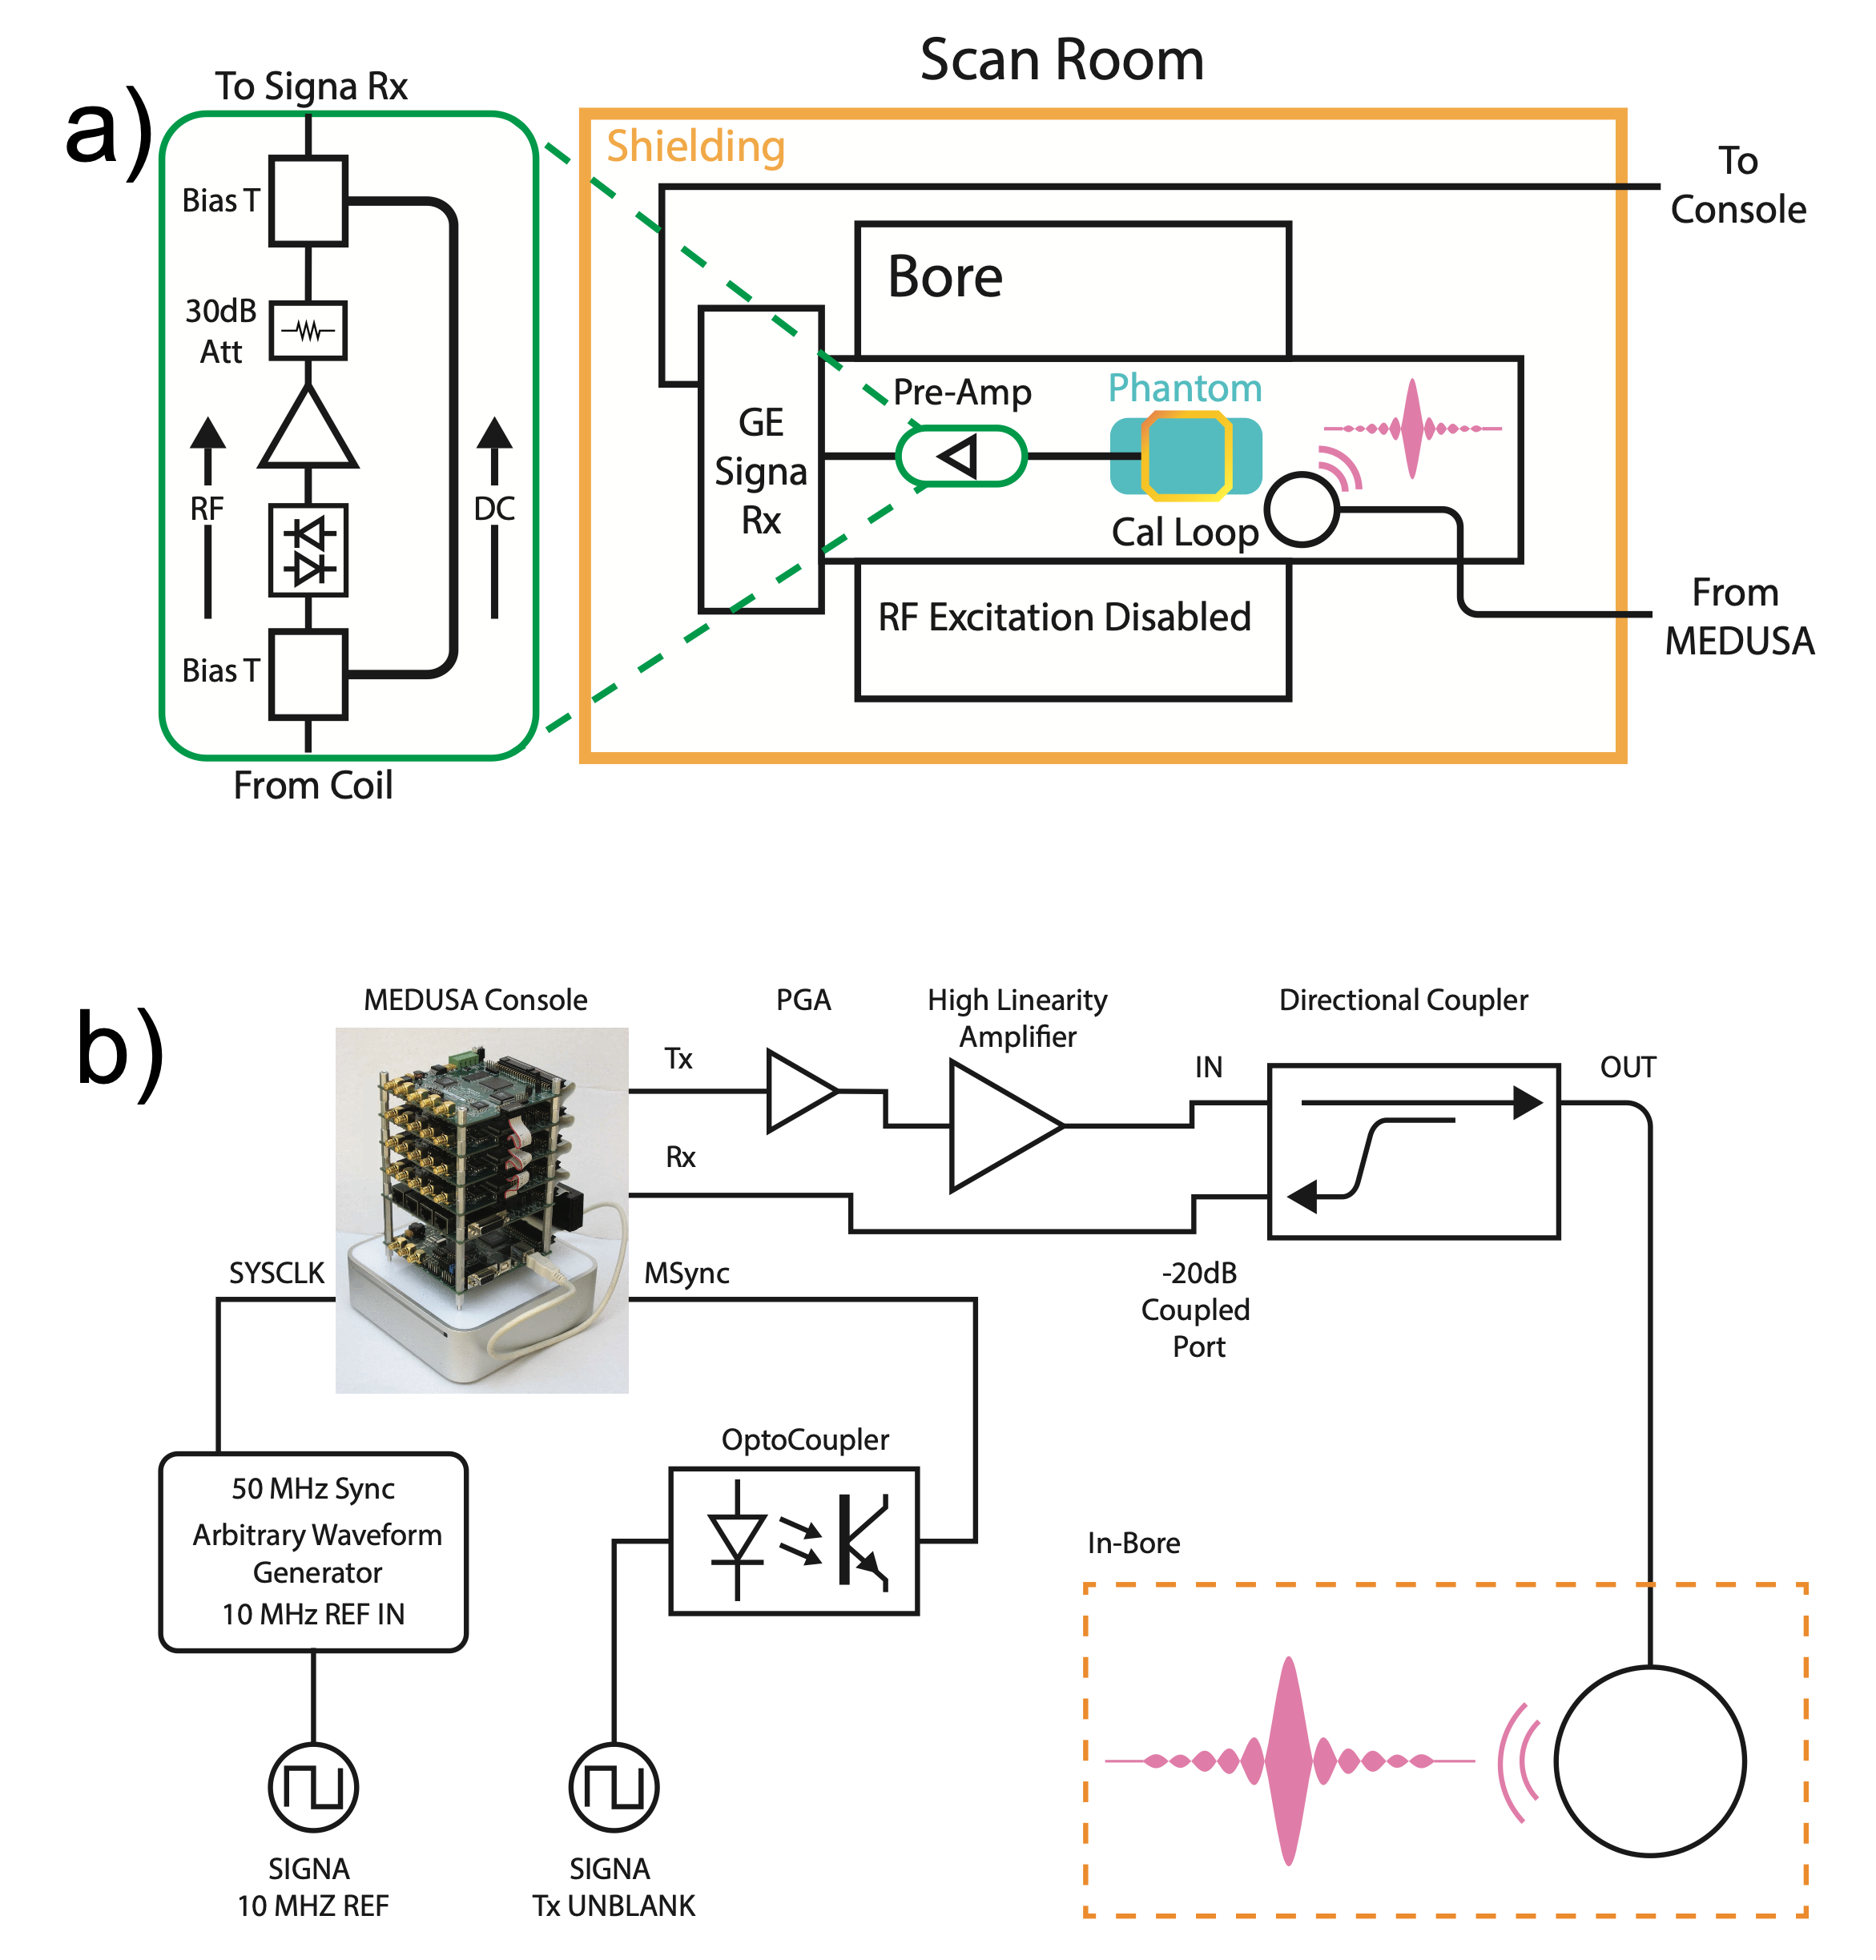
We constructed a shielded 13cm coax loop for in-bore tone injection in a GE 1.5T MRI (Fig. 1) The loop was placed on the patient table, sufficiently close for inductive coupling to a 5in MRI surface coil without loading the latter. The 50 MHz clock of a Medusa software defined radio [7], was phase locked to the scanner 10 MHz reference via a waveform synthesizer. Calibration signals were triggered by an opto-coupled Tx unblank signal during an MRI image acquisition with the body transmit disabled. During calibration tone transmit, a directional coupler provided a copy of the signal to the Medusa receive chain, allowing direct tone transmit linearity to be monitored.For testing, we used a SiGe preamplifier prototype (BFP840 2.2mA, 6.6mW) [1] and a WMA1R5A (WanTcom) HEMT preamp as a reference. Due to interface limitations, a cascade of the test preamp and 30dB attenuator was inserted via a bias T between a 5 inch surface coil and its dedicated internal scanner preamp coil port. This approach maintained the existing receive chain at its optimal dynamic range. The preamp-attenuator acted as an approximate unity gain stage that appeared transparent to the internal system preamp and receive chain. This was acceptable for the primary goal of linearity quantification.
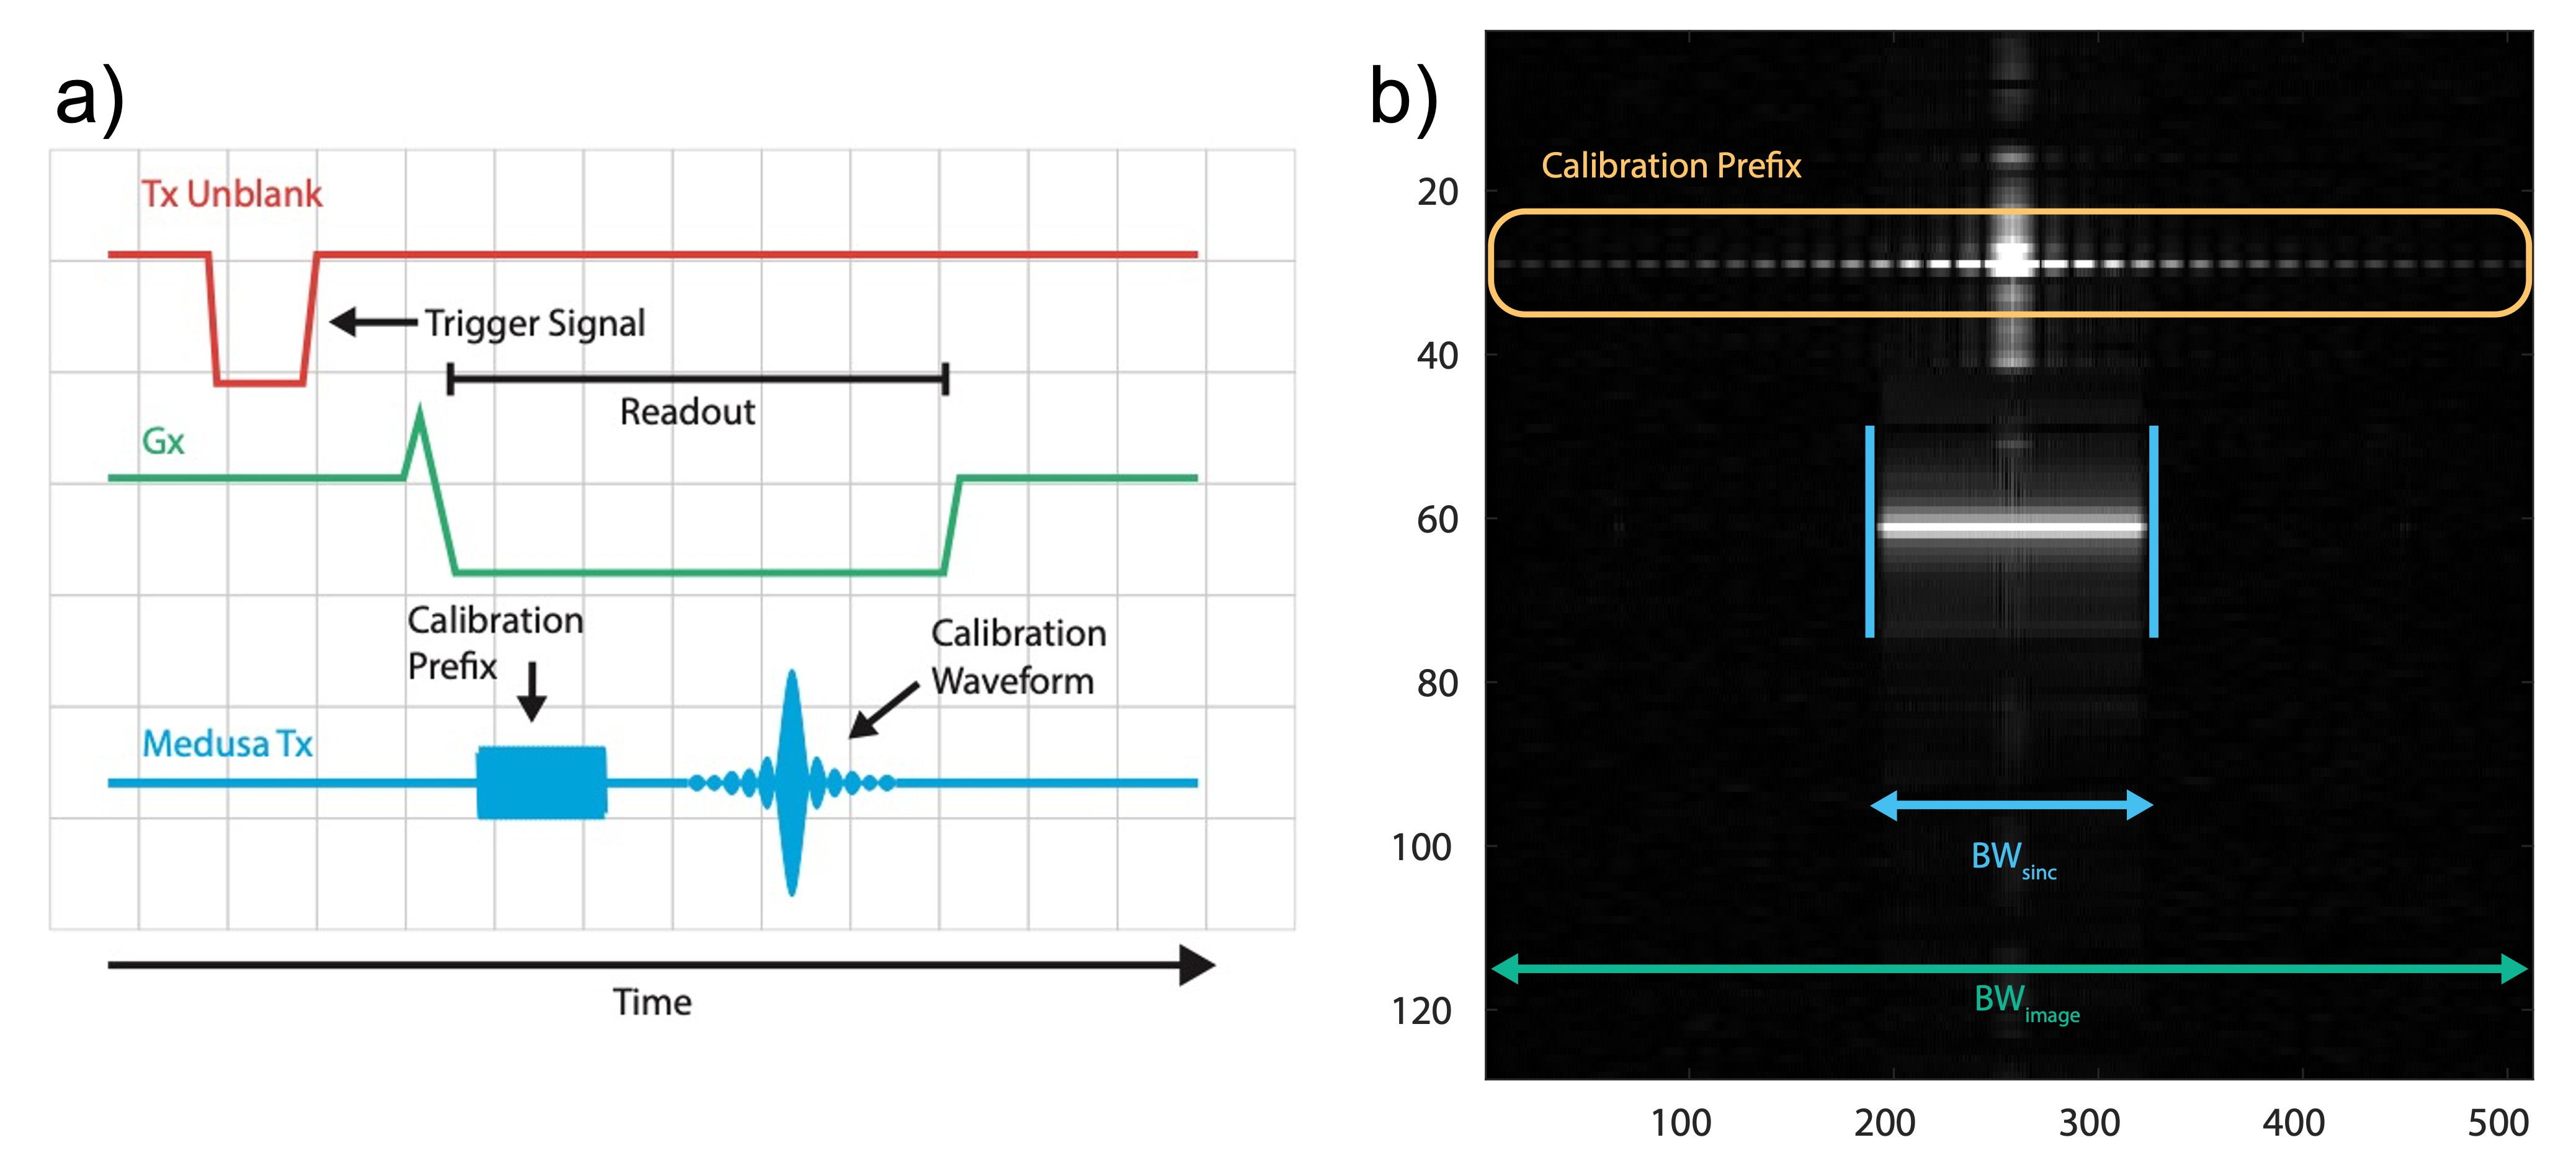
The calibration waveform included a constant amplitude prefix that was used as a phase reference followed by a SINC waveform with spectral spread equal to 1/4 the MRI field of view (Fig. 2a). The calibration sequence should have a bandwidth N times (here 4x) that of the calibration SINC to capture higher order intermodulation distortion. Here, SINC BW was set at 62.5 kHz, and image BW at 250 kHz. This waveform was stepped in amplitude as well as multiple phase steps. The signal timing was delayed to fall within the MRI readout interval. Figure 2b shows the effective "image" which is merely the FFT of the time domain signals with the expected SINC and now RECT signal bands of the calibration. Following linearity tabulation, the data were used in subsequent 3D GRE image acquisitions with a GE resolution phantom and 30cm spherical phantom. The 3D GRE sequences were acquired with Nro*Npe*Nslic: 256x256x32.
Results
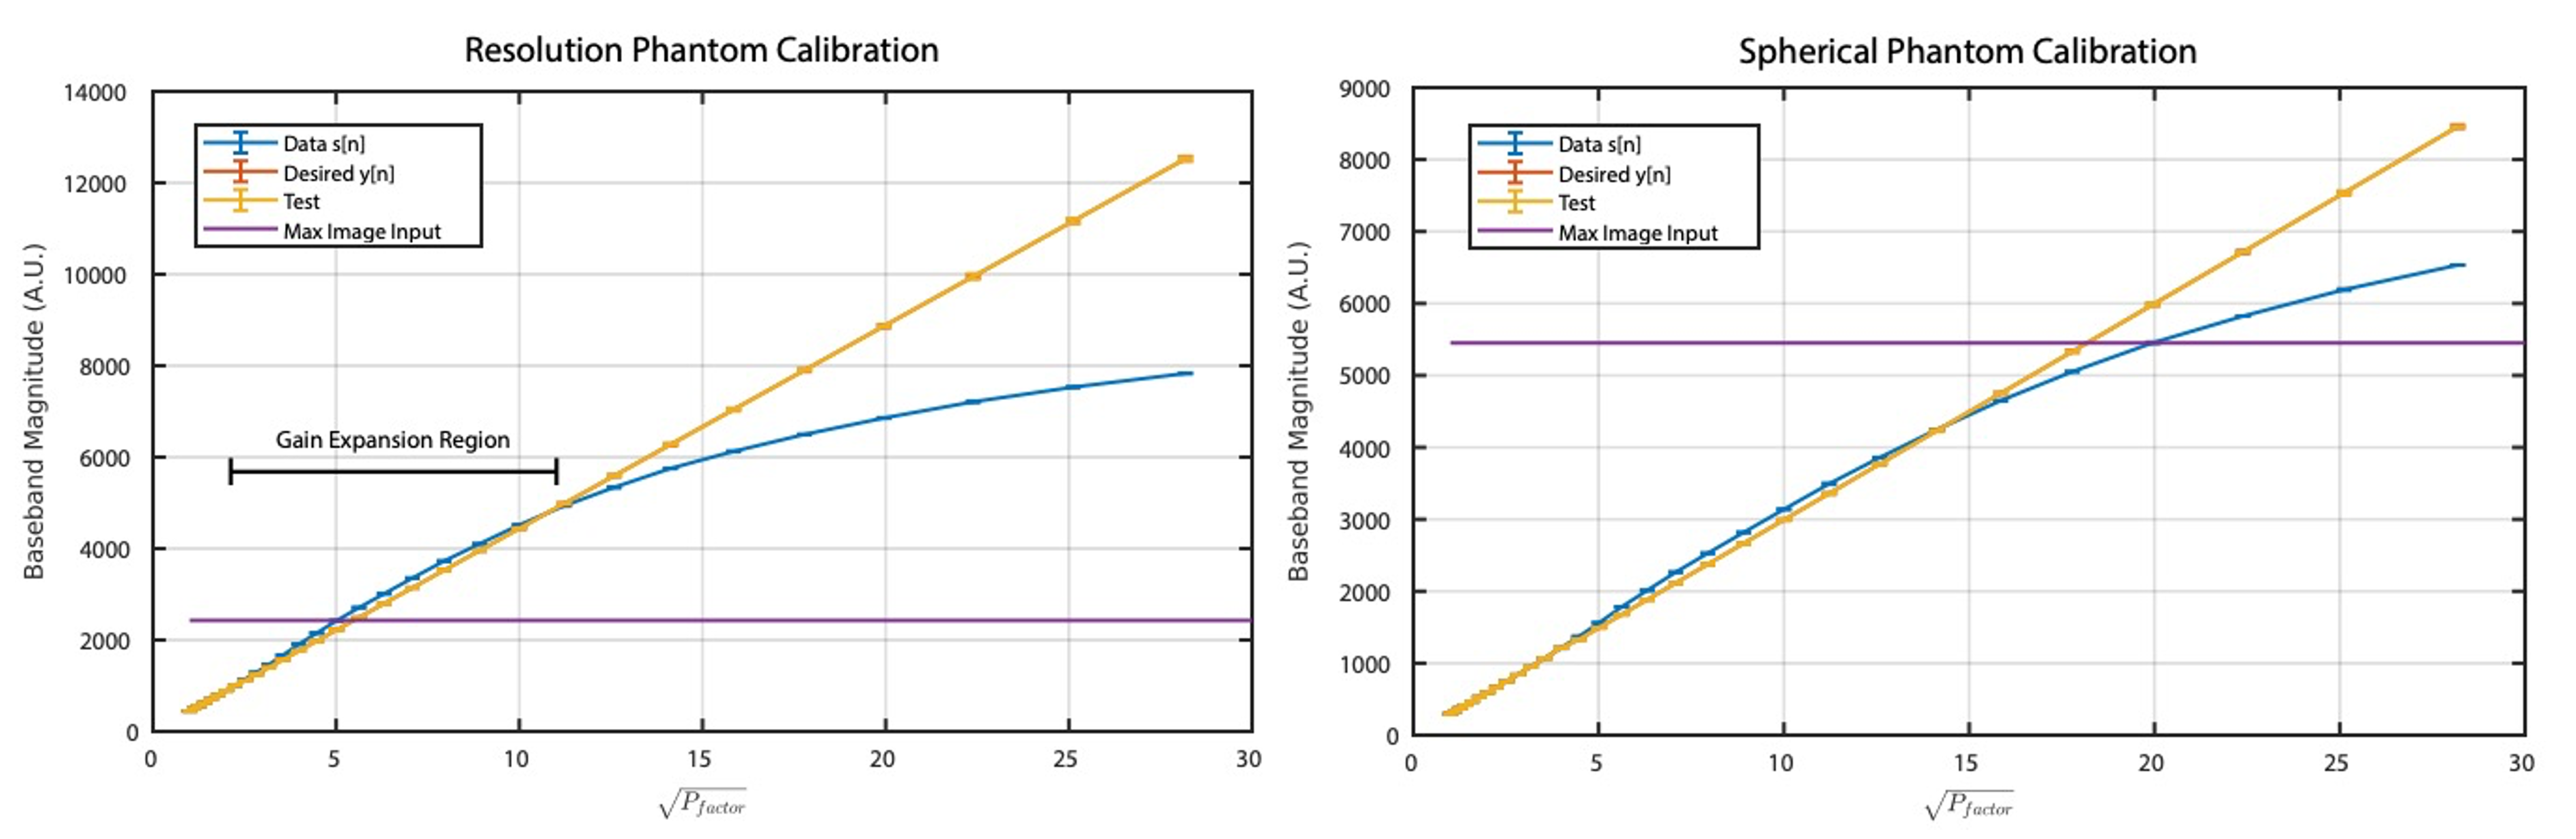
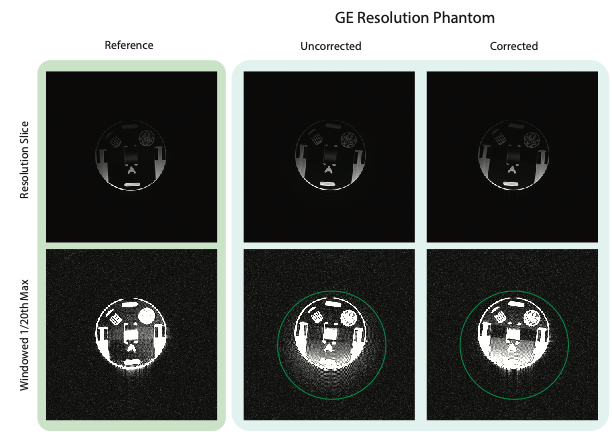
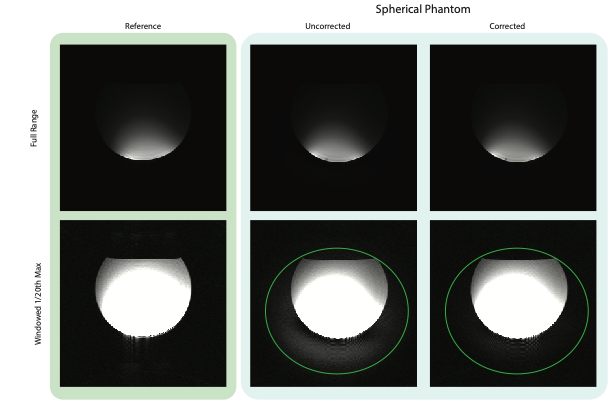
The resulting calibration curves are shown in Figure 3. For both the resolution and spherical phantoms, the SiGe preamplifier typically undergoes a slight gain expansion before gain compression onset. The purple lines show the peak k-space amplitude from the 3D data - the resolution phantom hits gain expansion, and the spherical data achieves gain compression. Figure 4 shows the SiGe preamp nonlinearity artifact for the resolution phantom relative to that of the very linear WanTcom WMA1R5A. Nonlinearity shows as bleed-thru in the readout direction, but is largely corrected using the calibration tones. Figure 5 also shows a signal bloom in the readout for a large spherical phantom and the corrected data.Discussion
With the growing popularity of pilot tone methods, one can envision future MRI scanners as providing inherent support for phase synchronous tone injection, both during prescan and imaging intervals. In our initial implementation, in effect, the scanner was "hacked" to demonstrate the linearity calibration within an MRI sequence, at some cost in acquisition time. In a fully integrated system, the linearity calibration could be achieved on the time scale of ~100 ms. Other options to consider are whether this calibration can be one time only, for data-base storage, and/or for real-time fault detection. Time dependent gain anomalies such as preamp gain recovery following RF pulses could also be enabled.Conclusion
An in-bore preamplifier linearity correction system was prototyped. The results show that for low-power but somewhat nonlinear Silicon germanium transistor preamps, image fidelity can be largely recovered. This will be be particularly useful if SiGe devices are deployed for battery powered wearable, wireless receive arrays.Acknowledgements
We thank GE Healthcare for research support, and received funding from NIH grants R01 EB019241, U01EB029427, R01EB012031, U01EB026412References
[1 ] Vassos C et al, A semi-blind calibration and compensation method for dynamic range recovery of low-power pre-amplifiers in MRI receive chains, IEEE Trans Med Imaging, 10.1109/TMI.2022.3195656
[ 2] Solomon E, et al, Free-breathing radial imaging using a pilot-tone radio frequency transmitter for detection of respiratory motion, MRM, 85, 2672, 2021.
[3] Vahle T, et al, Respiratory motion detection and correction for MR using the pilot tone, Invest. Radiol. 55, 153, 2020.
[4] Bosshard J et al, Phase Correction with Asynchronous Digitizers, Proc ISMRM, p1787, 2015.
[5] Scott G et al, Pilot tone software synchronization for wireless MRI receivers, Proc ISMRM, p25, 2018.
[6] Scott GC, Synchronization of wireless transmitted MRI signals in MRI system US7123009, 2006
[7] Stang P et al, Medusa: A scalable MR console using USB, IEEE Trans. Med. Imaging, 31:1173, 2012.
Figures