3721
A tailored coil for sensitive detection of MRI signals in modulating the rat’s blood-brain barrier by focused ultrasound and microbubbles at 7T
Sheng-Kai Wu1,2, Alessandro De Maio1,2, Hsin-Ju Lee1,2, Kullervo Hynynen1,2, Meaghan O'Reilly1,2, and Fa-Hsuan Lin1,2
1Sunnybrook Research Institute, Toronto, ON, Canada, 2University of Toronto, Toronto, ON, Canada
1Sunnybrook Research Institute, Toronto, ON, Canada, 2University of Toronto, Toronto, ON, Canada
Synopsis
Keywords: Multimodal, Non-Array RF Coils, Antennas & Waveguides
Imaging-guided focused ultrasound using MRI can modulate the permeability of blood-brain barrier with high spatial accuracy. However, many MRI-guided FUS studies rely on either a body coil or head coil poorly suited to the FUS system geometry. We developed a tailored receiver coil to improve the sensitivity of 7T MRI for rats. The tailored geometry allows for a 30% SNR increase in a study modulating the blood-brain barrier permeability with microbubbles.Introduction
Focused ultrasound with microbubbles has shown the capability to modulate the blood-brain barrier permeability 1. The stimulation of the endothelial wall by the microbubbles leads to changes in permeability including changes in the tight junctions, which serve as the cellular barrier maintaining homeostasis in the brain, and increases in active transport. FUS can be utilized in conjunction with magnetic resonance imaging (MRI), which allows for precise targeting of specific brain regions. The change in vascular permeability can be observed using MR contrast methodology.Enhanced sensitivity for detecting MRI signals in high-field rodent experiments can be achieved using a tailored receiver coil design. Specifically, improving the filling factor 2 and creating an aperture allowing water buffers and ultrasound beams to focus. The dedicated head coil 3, 2-loop 4 and 8-channel coil array for human 5 and small animal imaging 6 have been developed at 3T. 7T MRI offers a higher signal-to-noise ratio than 3T. However, many MRI-guided FUS studies have been using either a body or head coil 7–9, with the latter being poorly suited to the FUS system geometry We developed a tailored receiver coil to improve the sensitivity of 7T MRI for rats.
Methods
Two single receiver coils tuned at 300 MHz were built. Specifically, the first receiver coil was a circular loop (diameter = 6 cm), while the second was a curved circular loop with the same diameter but with a curved geometry to fit the head of a rat (Figure 1). Two lumped capacitors (American Technical Ceramics) were mounted at opposite ends of the loop to stabilize the loading. A variable capacitor trimmer was added to allow for manual tuning of the resonance frequency. Coil matching was done by two variable capacitor trimmers connected between the tuning capacitor and the signal as well ground ends of a coaxial cable. Bench measurement of the coil was done by a vector network analyzer (ZVL, Rhodes & Schwarz) by measuring its S11 with and without a syringe loaded with saline.For the in vivo study, the animal was anesthetized with 2% isoflurane. FUS-induced BBB opening used a 20 μL/kg dose of ultrasound contrast agent (Definity; Lantheus Medical Imaging, Massachusetts, USA) with 10 ms bursts of 1.169 MHz frequency at a pressure of 0.5 MPa at a burst repetition frequency of 1Hz for 2 min. The targets were placed in the thalamus. After sonication, the animal was placed prone, and the coils were installed on top of the skull for imaging acquisition. T1-weighted images (500 ms TR, 5 ms TE, 256 × 256 image matrix, 1.5 mm slice thickness) were used to confirm BBB opening. In addition, the T2-weighted images (4000 ms TR, 70 ms TE, 256 × 256 image matrix, 1.5 mm slice thickness) were also collected.
In a second experiment at a FUS frequency of 580 kHz, two animals were treated with targets placed at the internal capsule and deep gray matter. These animals remained supine for both treatment. . T1-weighted RARE images (583 ms TR, 5 ms TE, 200 × 200 image matrix, 0.5 mm slice thickness) were used to confirm targeting post intravenous gadolinium injection 0.1 ml/kg (Gadovist, Bayer Inc, Mississauga, Ontario, Canada). Regions of interest (ROI) were manually drawn over the sonicated areas and in-plane non-brain tissues (cerebrospinal fluid and ear canals). Between-coils measures were analyzed via Student’s t-test.
Results
Figure 1 illustrates the coil geometry and arrangement with a rodent model. S11 plots show the resonance frequency and the quality factors of two coils in loaded and unloaded conditions.Measured brain tissue SNR's were 9.8±0.8 and 8.4±0.6 at the gray matter for the curved and circular coil, respectively (p=0.010). White matter SNRs by the two coils were 10.1±1.1 and 8.0±0.7 (p<0.001). Non-significant between-coil differences were found for both gray (p=0.352) and white matter (p=0.214), while significant for non-brain tissues (p<0.001) (Figure 2).
Figure 3 shows three consecutive coronal slice images using circular flat and curved coils, with the imaging slice passing through the FUS targets around the center of the brain. Images from the curved coil show a higher intensity and a higher SNR at FUS targets. The SNR gain was around 30%.
Figure 4 shows two slices at deeper brain areas in T2-weighted coronal slice images using both coils. SNR profiles around the brain stem (indicated by the blue horizontal lines in images) suggested about a 30% SNR increase by using the curved coil.
Discussion
The curved loop geometry demonstrated increased tissue-specific contrast on T1-weighted images, compared to a flat circular coil, with no evident intensity changes moving away from the devices. Such refinements can ultimately improve visualization as well as manual and automatic segmentation. Compared to a flat circular coil, the curved loop geometry increased by around 30% the SNR at the deep brain area (Figures 2 and 3). Experiments using MRI for FUS guidance and treatment assessment will benefit from the improved sensitivity. The developed coils were used for brain imaging. Coil geometries were also suitable for other applications, such as spine imaging, with the setup allowing FUS beams to pass through the opening at the coil center.Acknowledgements
This work was supported by Natural Sciences and Engineering Research Council of Canada (NSERC; RGPIN-2020-05927), Canada Foundation for Innovation (38913 and 41351), Canadian Institutes of Health Research (PJT 178345), MITACS (IT25405 and Global link fellowship).References
1 Hynynen, K. et al. Radiology 220, 640–646 (2001)
2 Gruber, B. et al. J. Magn. Reson. Imaging (2018)
3 Ronald D Watkins, Rachelle Bitton, Kim Butts Pauly. in Proc. Intl. Soc. Mag. Reson. Med. 2330
4 Bitton, R. R. et al. Int. J. Hyperthermia 38, 22–29 (2021)
5 International Atomic Energy Agency. (International Atomic Energy Agency, 2013)
6 Abraham, C. B. et al. Int. J. Hyperthermia 35, 348–360 (2018)
7 Lea-Banks, H. et al. Nanotheranostics 6, 376–387 (2022)
8 Kofoed, R. H. et al. J. Control. Release 351, 667–680 (2022)9 Ishida, J. et al. J. Control. Release 330, 1034–1045 (2021)
Figures
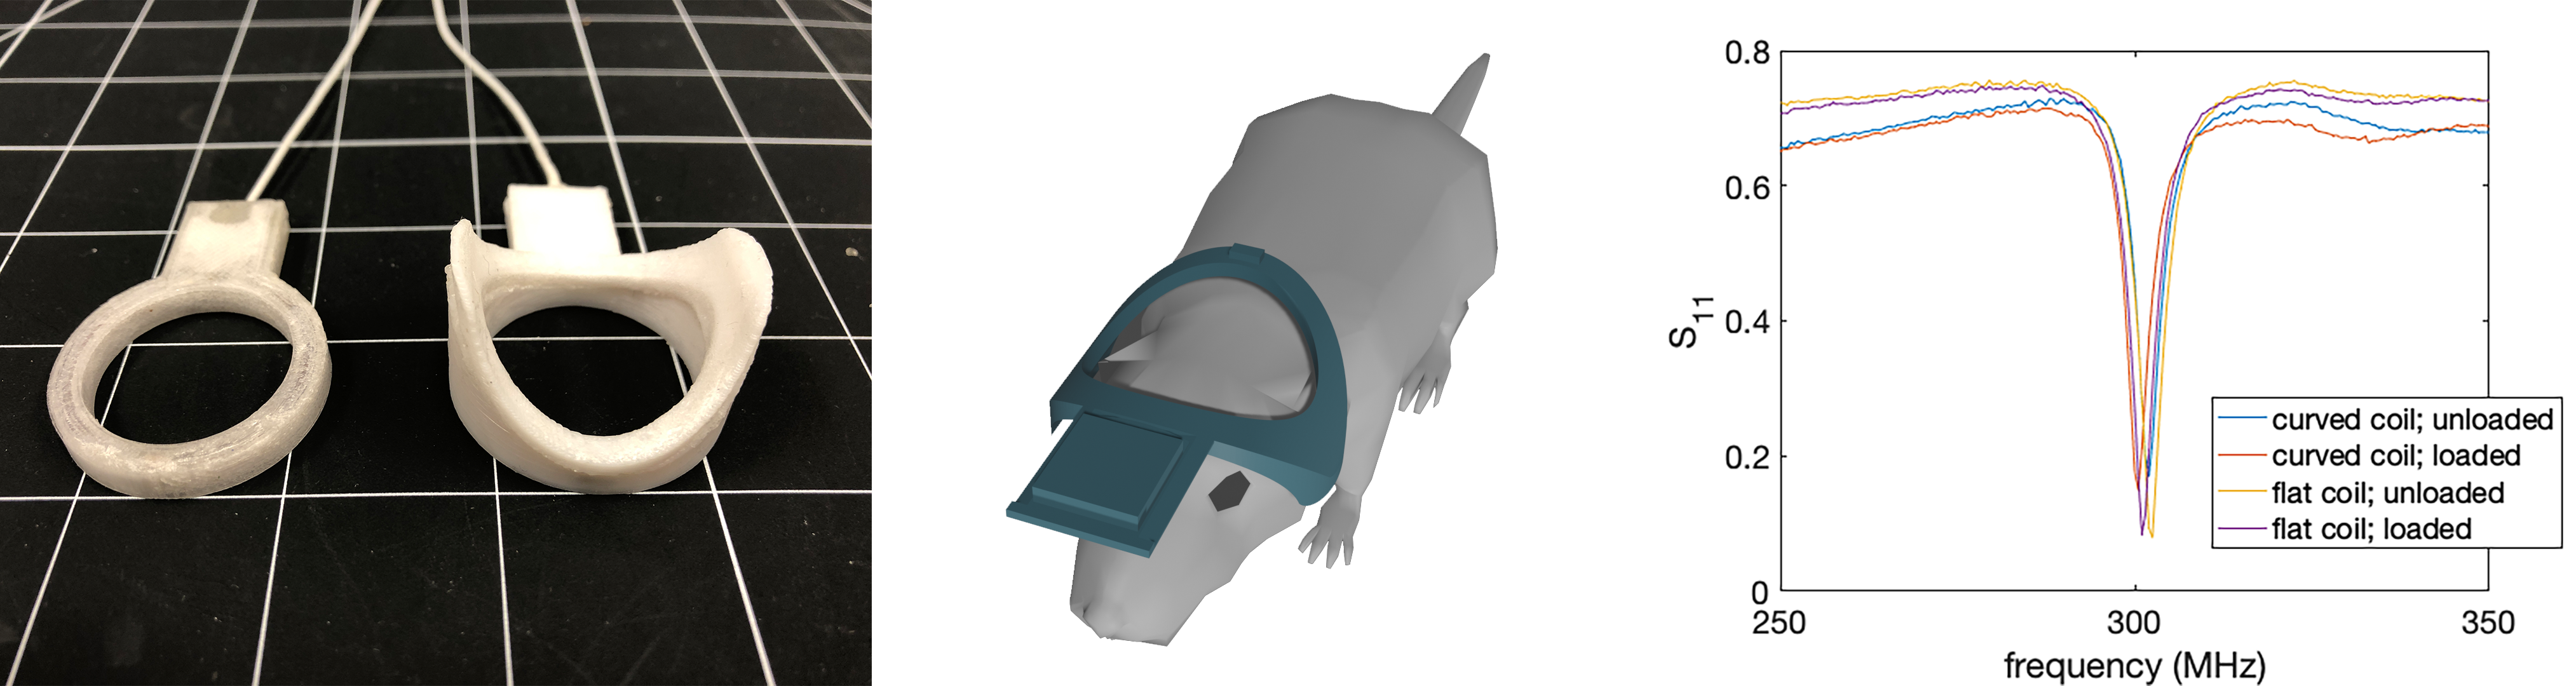
Figure 1. Left: circular flat and curved coils. Middle: illustration of the placement of a circular curved coil for rat brain imaging. Right: S11 plots for circular flat and curved coils in loaded and unloaded conditions.
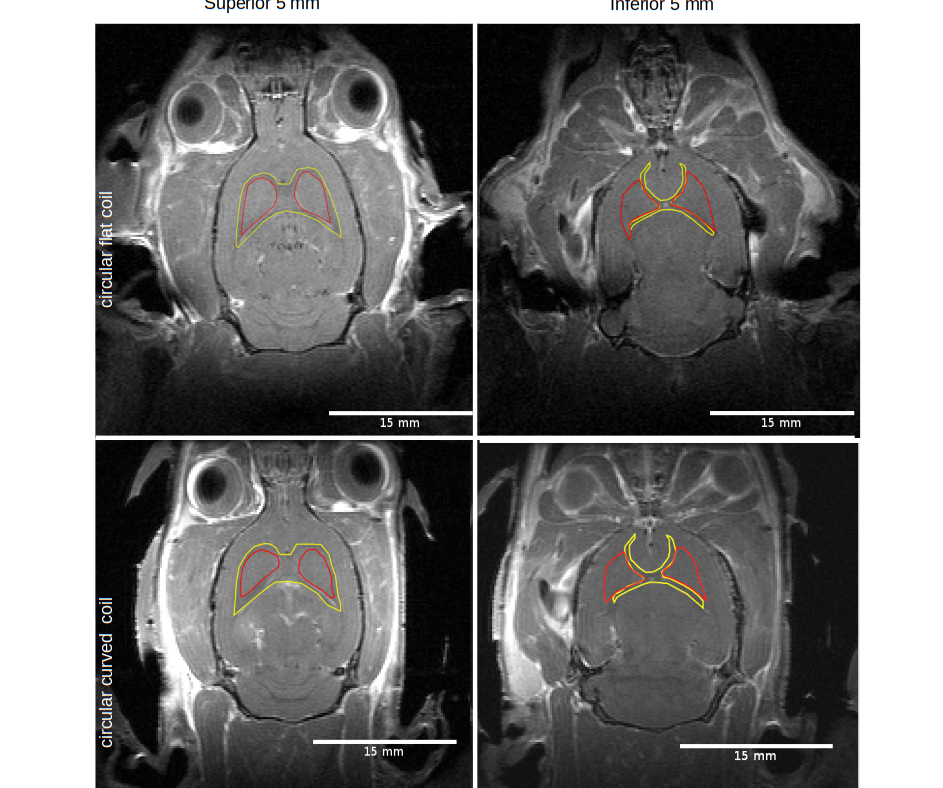
Figure 2: T1-weighted coronal slice images using circular flat (top) and curved (bottom) coils. Left: Slice images from the superior 5 mm of the brain. Right: Slice images from the inferior 5 mm of the brain. Indicated in red and yellow are ROIs of deep gray and white matter.
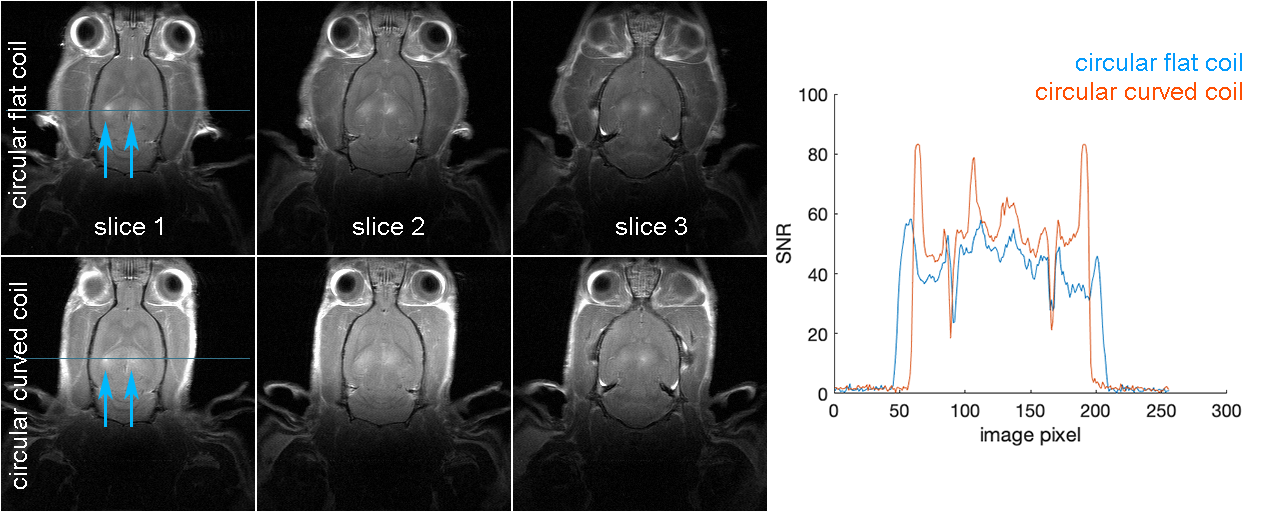
Figure 3: Left: T1-weighted coronal slice images using circular flat (top) and curved (bottom) coils. Blue arrows indicate the locations of FUS targets for BBB opening. Right: SNR profiles at the horizontal lines in slice 1 images.
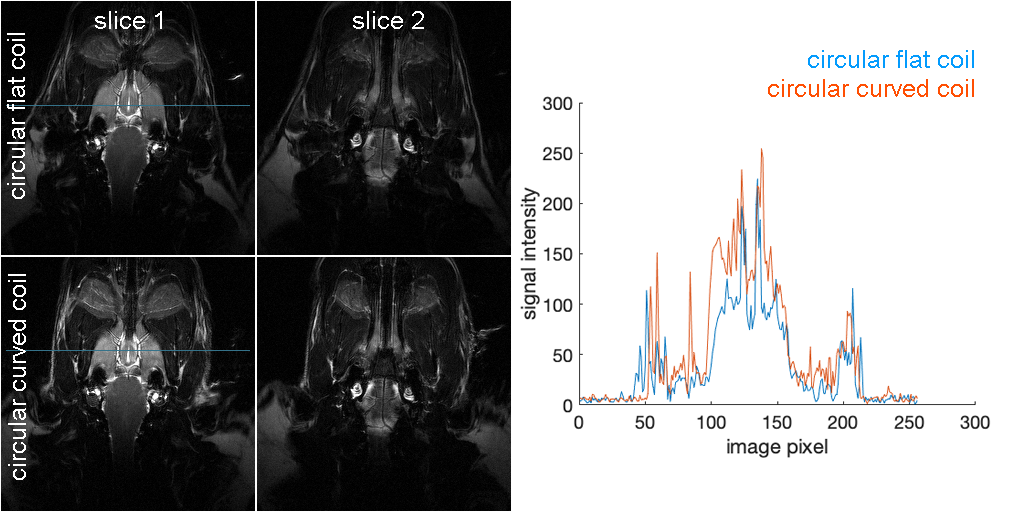
Figure 4: Left: T2-weighted coronal slice images using circular flat (top) and curved (bottom) coils. Right: SNR profiles at the horizontal lines in slice 1 images.
DOI: https://doi.org/10.58530/2023/3721