3699
Comparison of short-interval afferent inhibition measures with tonic GABA and Glutamate levels1Danish Research Centre for Magnetic Resonance, Hvidovre, Denmark
Synopsis
Keywords: Spectroscopy, Neuroscience
The neurochemical substrate of the measures observed with transcranial magnetic stimulation remains unclear. MR spectroscopy may provide valuable insights into understanding the synaptic GABAergic and glutamatergic activity, however studies comparing these methods haven’t provided an adequate explanation. We aimed to compare GABA and glutamate concentrations with short-interval afferent inhibition measured with TMS. We found positive correlation between the amount of inhibition and tonic GABA levels, however this finding needs to be carefully scrutinized.Introduction
Short-interval afferent inhibition (SAI) is an electrophysiology protocol that uses transcranial magnetic stimulation (TMS) to assess the inhibition in the motor cortex provoked by the sensory afferent input. In fact, TMS over the primary motor cortex (M1) allows to measure the synaptic GABAergic and glutamatergic activity indirectly1. MR spectroscopy (MRS) remains the only method capable of quantifying GABA and Glutamate (Glu) in vivo2. However, a proper understanding of the link between GABA and Glu concentration and SAI has not been yet investigated. We aimed to compare the tonic levels of GABA and Glu acquired with edited-MRS with the maximum amount of inhibition identified in the SAI curve. Moreover, we evaluated the possible link of single steps of SAI (peripheral stimulation and TMS over M1) with GABA and Glu.Methods
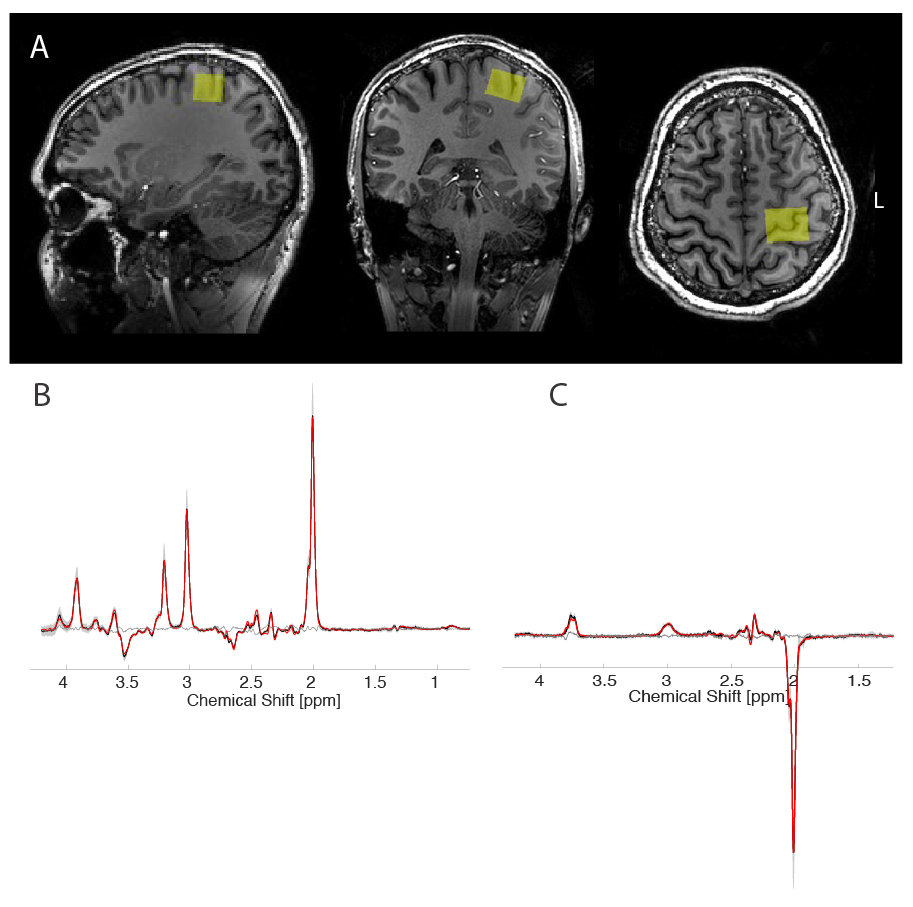
7 healthy, right-handed subjects (19-33 years old) were scanned on a Philips Achieva 7T scanner with dual-transmit 32-channel receive array head coil. Small (15x15cm2) in-house made dielectric pad was placed over the motor cortex to improve the local B1+ field. Spectroscopic voxel (2x2.5x2.5 cm3) was planned on a structural image and placed in the left M1. MRS was acquired using MEGA-sLASER with GOIA refocusing pulses3, interleaved outer volume suppression and VAPOR water suppression and following parameters: TR/TE=4000/74ms; 6ms gaussian editing pulses at 1.9ppm and 7.46ppm (edit-ON and edit-OFF respectively); 96 transients; 4kHz spectral bandwidth. Data were frequency and phase corrected, aligned and subtracted using custom-made script and FID-A4 functions to form a difference spectrum (DIFF). Edit-OFF and DIFF spectra were quantified with LCModel 6.35. Basis sets were generated using custom-built fully localized density matrix simulations6. Quantification parameters for DIFF spectra were adapted from Zollner et al7. GABA (from DIFF-spectrum) and Glu (from OFF-spectrum) were referenced to total Cr (Cr+PCr) from OFF-spectrum.In order to proceed with the SAI protocol, firstly we identified the perception threshold for the median nerve stimulation, which is the minimum stimulation that the subject can clearly perceive after the delivery of the electrical pulse (200us duration) on the wrist. Then, after identifying the motor hotspot, we measured the individual motor threshold at rest, which is the minimum TMS intensity capable of evoking motor evoked potentials (MEPs) higher or equal to 50 uV in 5 out of 10 consecutive stimuli8. Finally, SAI was performed and the maximum level of inhibition was selected on a temporal curve obtained after applying TMS (120% of resting motor threshold) for all time points between 20 and 30 milliseconds after the median nerve stimulation (90% of motor threshold) in steps of 1 ms.
Results
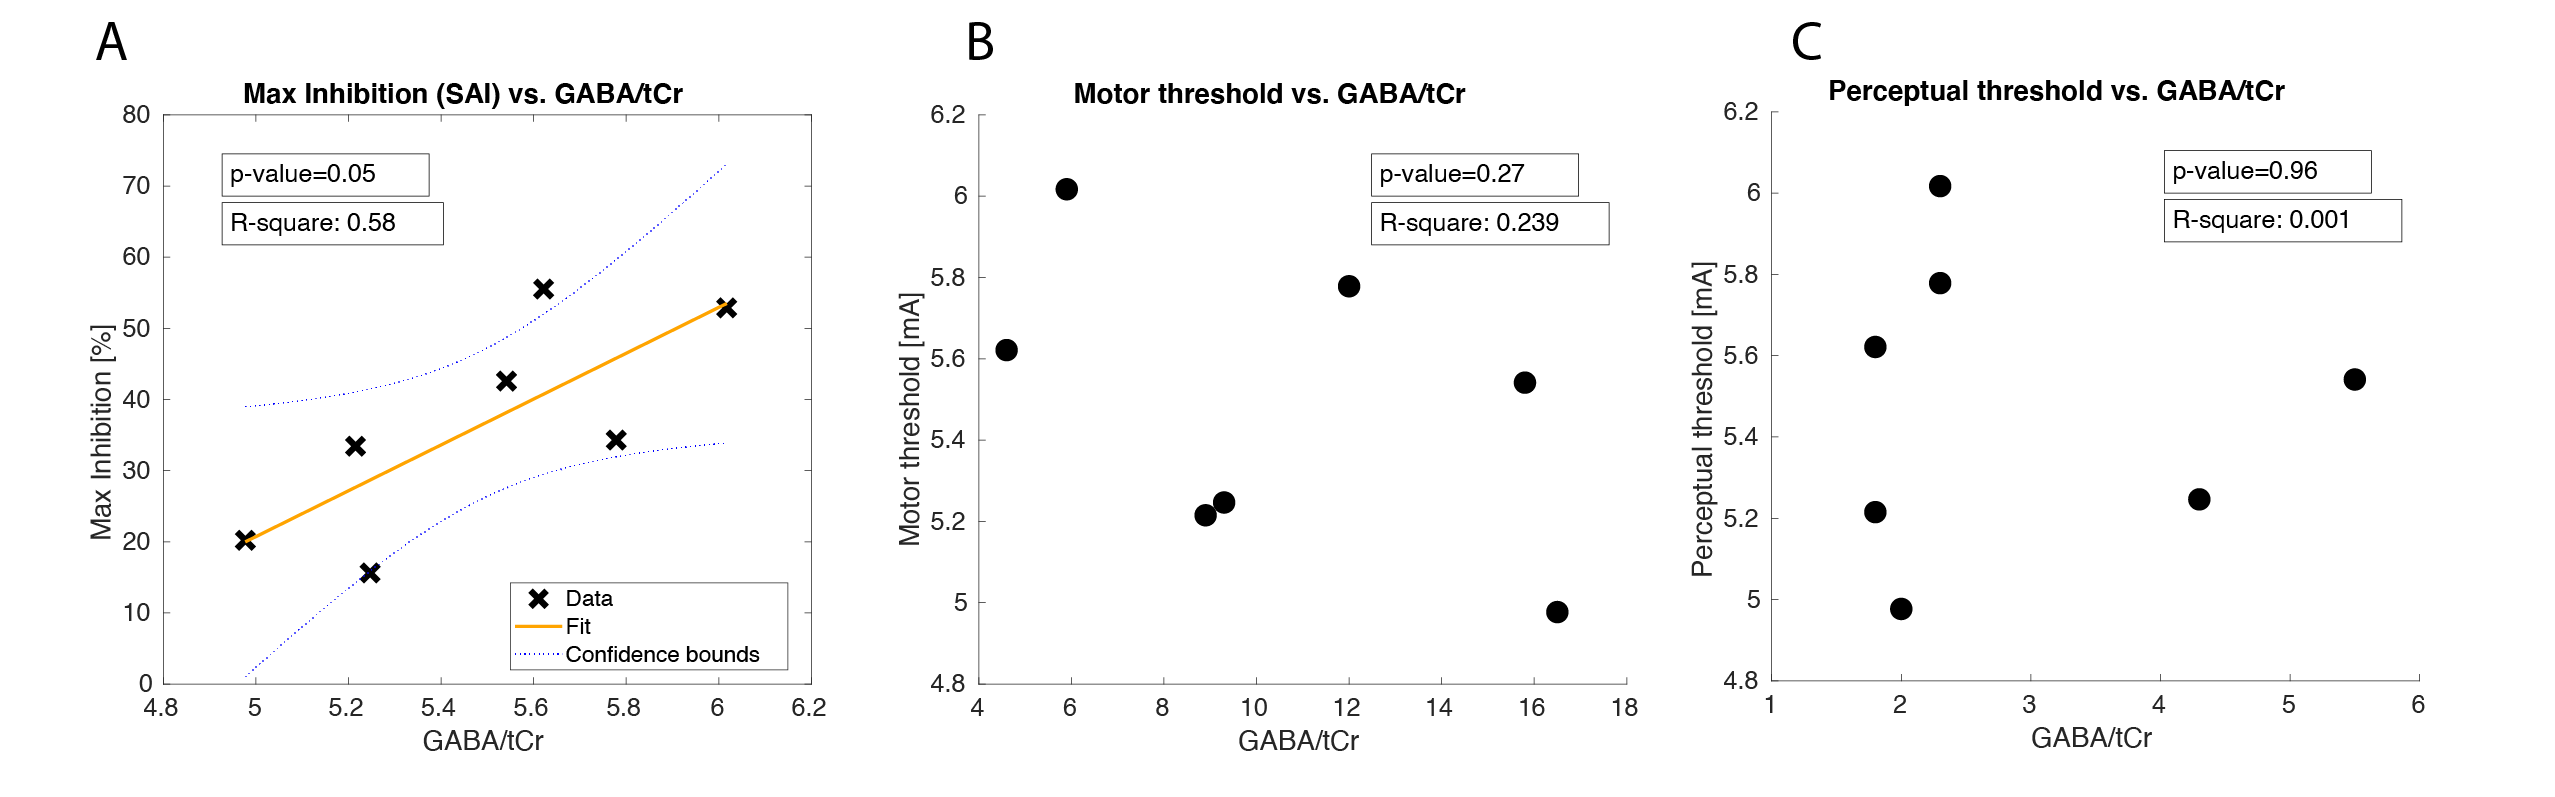
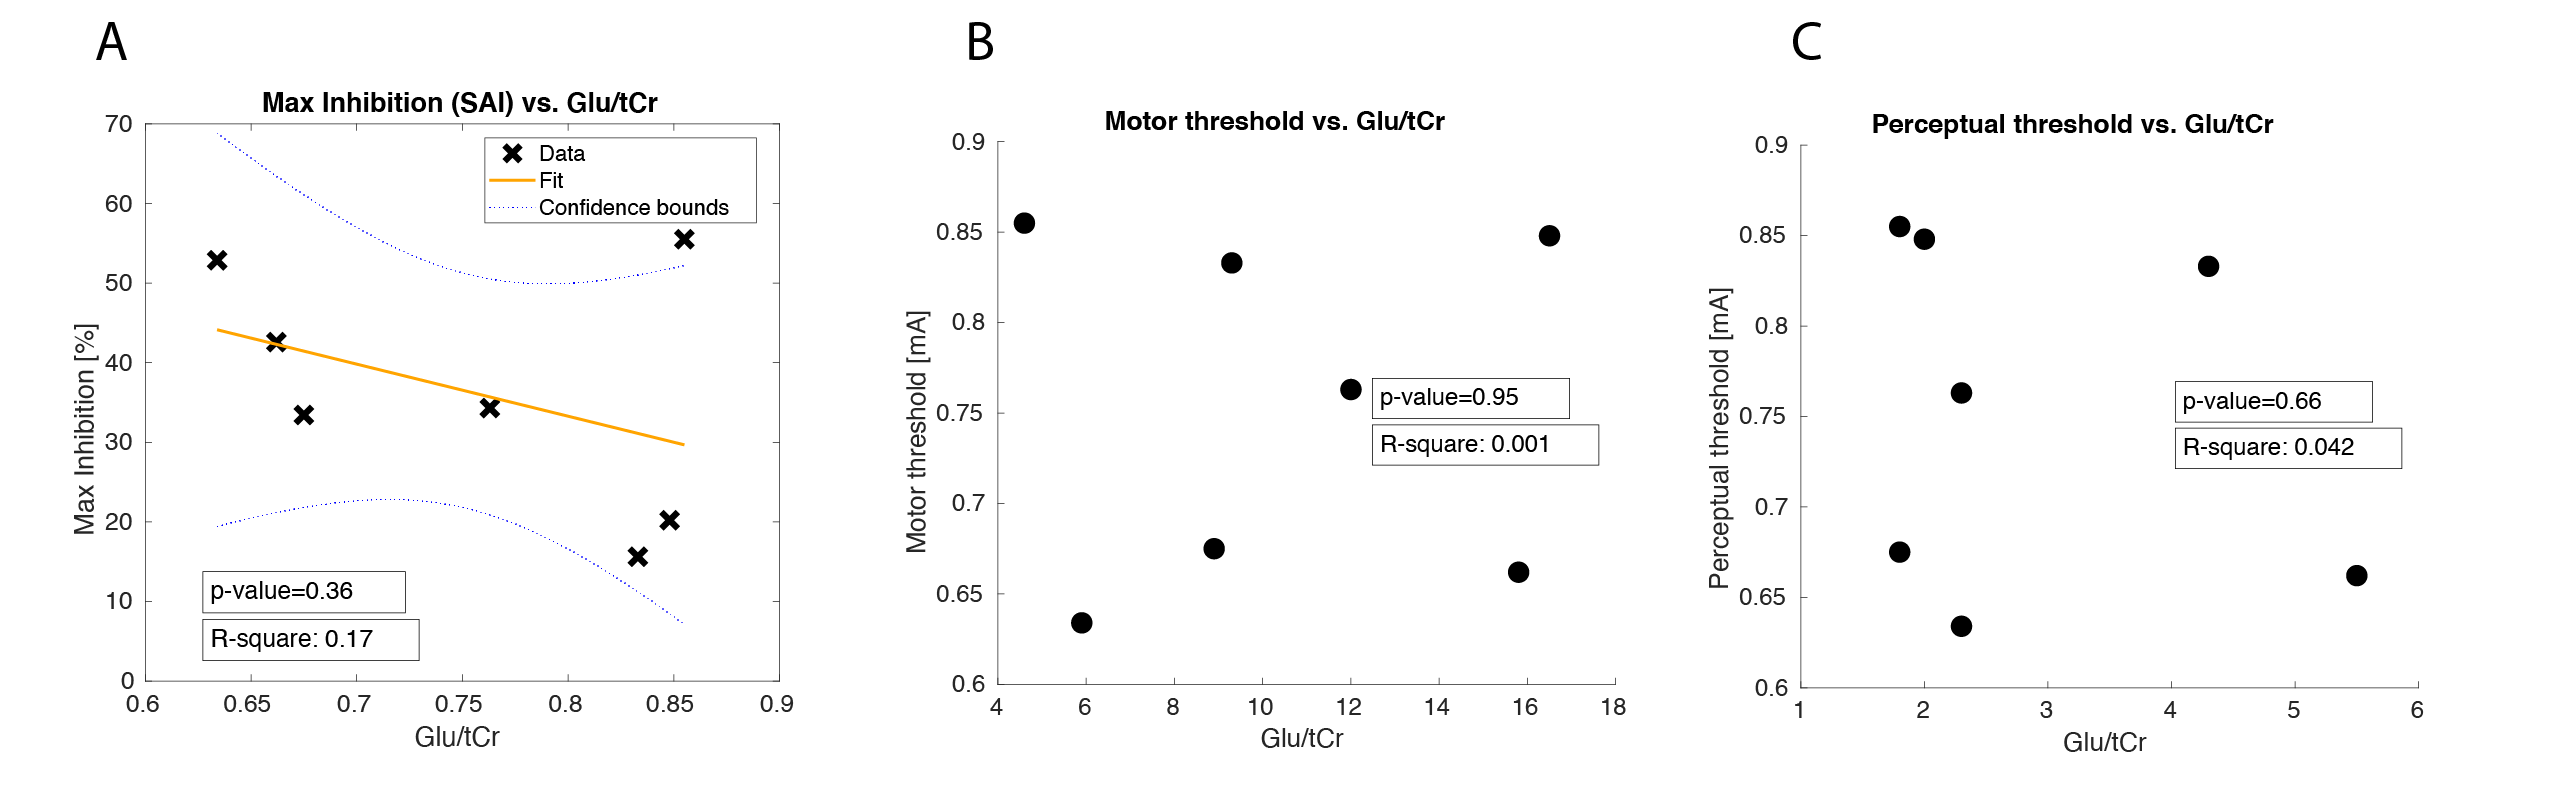
Spectra showed overall good spectral quality with mean CRLBs[%] of 5 (GABA) and 5.7 (Glutamate) (Fig. 1). Mean SNR/Linewidth was 40/7.9Hz and 54/8.8Hz for the DIFF-spectra and the OFF-spectra respectively as reported by LCModel. No significant correlation was found between GABA/tCr and motor threshold (r = 0.239, p-value = 0.27) or perception threshold (r = 0.001, p-value = 0.96), however a significant positive correlation was found between GABA/tCr and maximum inhibition from SAI protocol (r = 0.58, p-value = 0.05). There was no correlation between Glu/tCr and motor threshold (r = 0.001, p-value = 0.95), perception threshold (r = 0.042, p-value = 0.66) or maximum inhibition (r = 0.17, p-value = 0.36).Discussion
In this study we show that while perception levels and motor threshold are not linked to the excitatory and inhibitory neurotrasmitters’ concentration in the sensory-motor cortex, the maximum level of inhibition after afferent input is related to the amount of Glu and GABA.Previous pharmacological studies have shown that SAI is likely mediated by GABA and more precisely it showed reduction when benzodiazepines, which are GABA_A receptor agonist, were administered9,10. Therefore, our finding is in line by showing that higher levels of GABA induce higher level of inhibition. On the other hand, previous studies did not show a convincing relationship between GABAergic inhibitory TMS protocols and concentrations of Glu and GABA11,12 This might be due to methodological differences between our study and the previous ones or to the different mechanisms involved when the inhibition is evaluated after the direct transcranial stimulation or after the afferent input. Our results are preliminary and more datasets will need to be acquired to support our findings.
Acknowledgements
Supported by Lundbeck Fonden grant number R346-2020-1822.
References
1. Hallett M. Transcranial magnetic stimulation: a primer. Neuron. 2007;55:187-199.
2. Puts NAJ, Edden RAE. In vivo magnetic resonance spectroscopy of GABA: A methodological review. Prog Nucl Magn Reson Spectrosc. 2012;60:29-41. doi:10.1016/j.pnmrs.2011.06.001
3. Berrington A, Gillen JS, Boer V. GOIA-WURST optimisation for ultra-high field single-voxel MRS at short-TE. In: Proc. Intl. Soc. Mag. Reson. Med. ; 2021:1988.
4. Simpson R, Devenyi GA, Jezzard P, Hennessy TJ, Near J. Advanced processing and simulation of MRS data using the FID appliance (FID-A) - An open source, MATLAB-based toolkit. Magn Reson Med. 2017;77(1):23-33. doi:10.1002/mrm.26091
5. Provencher SW. Estimation of metabolite concentrations from localized in vivo proton NMR spectra. Magn Reson Med. 1993;30(6):672-679. doi:10.1002/mrm.1910300604
6. Berrington A, Voets NL, Plaha P, et al. Improved localisation for 2-hydroxyglutarate detection at 3T using long-TE semi-LASER. Tomography. 2016;2(2):94-105. doi:10.18383/j.tom.2016.00139
7. Zöllner HJ, Tapper S, Hui SCN, Barker PB, Edden RAE, Oeltzschner G. Comparison of linear combination modeling strategies for edited magnetic resonance spectroscopy at 3 T. NMR Biomed. 2022;35(1):1-18. doi:10.1002/nbm.4618
8. Rossini PM, Burke D, Chen R, et al. Non-invasive electrical and magnetic stimulation of the brain, spinal cord, roots and peripheral nerves: Basic principles and procedures for routine clinical and research application: An updated report from an I.F.C.N. Committee. Clin Neurophysiol. 2015;126(6):1071-1107. doi:10.1016/j.clinph.2015.02.001
9. Di Lazzaro V, Pilato F, Dileone M, Tonali PA, Ziemann U. Dissociated effects of diazepam and lorazepam on short-latency afferent inhibition. J Physiol. 2005;569(1):315-323. doi:10.1113/jphysiol.2005.092155
10. Di Lazzaro V, Oliviero A, Saturno E, et al. Effects of lorazepam on short latency afferent inhibition and short latency intracortical inhibition in humans. J Physiol. 2005;564(2):661-668. doi:10.1113/jphysiol.2004.061747
11. Tremblay S, Beaulé V, Proulx S, et al. Relationship between transcranial magnetic stimulation measures of intracortical inhibition and spectroscopy measures of GABA and glutamate+glutamine. J Neurophysiol. 2013;109(5):1343-1349. doi:10.1152/jn.00704.2012
12. Stagg CJ, Bestmann S, Constantinescu AO, et al. Relationship between physiological measures of excitability and levels of glutamate and GABA in the human motor cortex. J Physiol. 2011;589(23):5845-5855. doi:10.1113/jphysiol.2011.216978
Figures