3698
Diffusion-weighted MR spectroscopy of the prostate1Department of Medical Imaging, Radboud University Medical Center, Nijmegen, Netherlands, 2Magnetic Resonance Methodology, Institute of Diagnostic and Interventional Neuroradiology, University of Bern, Bern, Switzerland, 3Translational Imaging Center, sitem-insel, Bern, Switzerland, 4Cardiff University Brain Research Imaging Centre (CUBRIC), School of Psychology, Cardiff University, Cardiff, United Kingdom
Synopsis
Keywords: Spectroscopy, Diffusion/other diffusion imaging techniques
Diffusion-weighted Magnetic Resonance Spectroscopy (DW-MRS) is ideally suited to explore complex microstructure with metabolites selectively distributed in different subspaces. So far this technique was applied in brain and muscle only. In this work, we explored DW-MRS for the first time in the prostate, an organ, with potentially more motion problems. Thus, dedicated acquisition and post-processing techniques were used including the measurement of water next to that of metabolites for corrections. ADC values of citrate, total choline, total creatine and spermine were estimated and evaluated according to the compartmental structure of the prostate indicating hindered metabolite diffusion in the luminal space.
Introduction
Prostate tissue has a complex microstructure composed of three major components: epithelial cells, stromal cells and large extracellular (luminal) spaces (LS). MRI has been used to elucidate these spaces in prostate tissue by relaxometry and diffusion-weighted MRI1,2. Diffusion-weighted MR Spectroscopy (DW-MRS)3 is ideally suited to explore complex microstructure in vivo with metabolites selectively distributed in different subspaces. So far this technique has been applied in brain and muscle. In this work, we explore DW-MRS for the first time in the prostate, an abdominal organ prone to motion artefacts. We tackled motion by concurrently acquiring a water signal for corrections, and dealt with limited SNR by simultaneous fitting of spectral shape and signal attenuation at multiple b-values.Method
Single-voxel DW-MRS was performed with a non–water-suppressed STEAM sequence with metabolite-cycling to concurrently measure metabolite and water signals3. Acquisition parameters were: TE/TM/TR 33/35/2500 ms with b-values 124, 359, 776, 1353, 1988, 2516, and in-vitro additionally 112, 3106, 3759 s/mm2. This was applied to a prostatic fluid mimic phantom containing citrate (Cit), spermine (Spe) and myo-inositol (mI) in the presence of ions and 15 g/l BSA4. We examined the prostate of 9 healthy volunteers in-vivo (mean age 56y, range 31-66) with a mean VOI of 13.9 cm3, covering ~60% central gland and ~40% peripheral zone tissue. Measurements were performed on 3T MR systems (Siemens, Germany) with an external phased-array coil for signal reception.In post-processing, a motion-compensation scheme was applied for inter-acquisition distortions, using the co-acquired water signal as reference to correct phase and frequency fluctuations, eddy-current distortions, and to compensate for nonlinear motion to restore potential signal loss in individual acquisitions3. The processed MR spectra were fitted for signals of Cit, total choline (tCho), Spe, total creatine (tCr), mI and separately for water. For the simultaneous 2D spectrum-ADC fitting, FiTAID5 was used, employing metabolite spectra simulated in VeSPA6 assuming ideal RF pulses. The ADCs of the metabolites were modeled by a mono-exponential decay function, while the water ADC was represented bi-exponentially. A cohort-average spectrum with high SNR was also constructed to verify the fit model. In-vivo ADC values in Table 1 were calculated as weighted average using the inverse of the CRLBs as weights.
Results and Discussion
The ADC values derived from the decaying signals of the compounds in the phantom (Fig.1) show that those for Cit and Spe are lower than that of mI (Table 1), which would agree with their lower T2 values relative to mI measured in studies of similar phantoms, indicating (transient) complexation of these compounds4.The MR spectra of healthy volunteers obtained at increasing b-values show good to moderate quality (Fig.2 and 3, respectively). Excellent spectroscopic fits of the metabolites were achieved as demonstrated by the residuals in Figs 2, and 3 (red line). It is observed that Cit resonances decay fastest.
The ADC values derived from these experiments reveal that tCho and tCr have the lowest weighted-average values (Table 1), in agreement with their intracellular origin, while the higher values for Cit and Spe would confirm that these compounds dominantly originate from the LS7,8 with less diffusion restrictions. However, the ADC of Cit is substantially higher than that of Spe (p<0.05) and inspection of the cohort-averaged spectra (Fig.4) confirms the fairly slow Spe signal decay visually. As shown by MRS studies of prostate tissue and prostatic fluid7 there is a strong correlation between Cit and Spe levels suggesting transient complex-formation of these compounds as was demonstrated in-vitro by T2 measurements4. Moreover, this and other studies suggested that this complex and/or its components transiently bind to proteins within the LS. As the luminal concentration of Cit is much higher than that of Spe, and assuming a 1:1 complex, it follows that the fraction of free compound is much larger for Cit than Spe, which could explain the higher ADC for Cit compared to Spe because of its larger free fraction in solution.
As the average luminal diameter is about 200 µM9 one would expect nearly unrestricted diffusion for Cit, Spe and mI with much higher ADCs for such small molecules than what we measured in this study (around 6-9 rather than 2-3 10-4 mm2/s), which further supports that protein-binding as described above occurs in LS.
Why the ADC value of mI is even lower than expected for a free small uncharged molecule in LS is less obvious. NMR spectra of prostatic fluid are dominated by signals of Cit, Spe and mI6,7 of which the concentrations roughly agree with their prostate in-vivo concentrations taking the luminal fraction into account1, but some mI may still be located intracellularly.
Finally, we obtained two ADC values for water from a bi-exponential fit of its signal decay (Table 1) of which the higher ADC component would represent water in the luminal space and the other that of cellular water. This could be used to calculate compartment-specific concentrations.
Conclusions
We successfully demonstrate that DW-MRS of the prostate is feasible and provides a window on the microenvironment of prostatic compartments. The preliminary results indicate restricted or hindered diffusion of Cit and Spe in the LS despite its large size, indicating complexation with macromolecules in this compartment.Acknowledgements
This work is supported by the Marie-Sklodowska-Curie Grant #813120 (Inspire-Med) and the Swiss National Science Foundation (#320030-175984).References
1. Lemberskiy G, Fieremans E, Veraart J, Deng FM, Rosenkrantz AB, Novikov DS. Characterization of prostate microstructure using water diffusion and NMR relaxation. Front Phys. 2018;6(SEP). doi:10.3389/fphy.2018.00091
2. Chatterjee A, Mercado C, Bourne RM, et al. Validation of Prostate Tissue Composition by Using Hybrid Multidimensional MRI: Correlation with Histologic Findings. Radiology. 2022;302(2). doi:10.1148/radiol.2021204459
3. Döring A, Adalid V, Boesch C, Kreis R. Diffusion-weighted magnetic resonance spectroscopy boosted by simultaneously acquired water reference signals. Magn Reson Med. 2018;80(6). doi:10.1002/mrm.27222
4. Jupin M, van Heijster FHA, Heerschap A. Metabolite interactions in prostatic fluid mimics assessed by 1H NMR. Magma Magn Reson Mater Physics, Biol Med. Published online 2022.
5. Chong DGQ, Kreis R, Bolliger CS, Boesch C, Slotboom J. Two-dimensional linear-combination model fitting of magnetic resonance spectra to define the macromolecule baseline using FiTAID, a Fitting Tool for Arrays of Interrelated Datasets. Magn Reson Mater Physics, Biol Med. 2011;24(3). doi:10.1007/s10334-011-0246-y
6. Soher BJ, Semanchuk P, Todd D, Steinberg J, Young K. VeSPA: Integrated applications for RF pulse design, spectral simulation and MRS data analysis. J Magn Reson Ser A. 1994;12(2).
7. Lynch MJ, Nicholson JK. Proton MRS of human prostatic fluid: Correlations between citrate, spermine, and myo-inositol levels and changes with disease. Prostate. 1997;30(4). doi:10.1002/(SICI)1097-0045(19970301)30:4<248::AID-PROS4>3.0.CO;2-H
8. Serkova NJ, Gamito EJ, Jones RH, et al. The metabolites citrate, myo-inositol, and spermine are potential age-independent markers of prostate cancer in human expressed prostatic secretions. Prostate. 2008;68(6). doi:10.1002/pros.20727
Figures
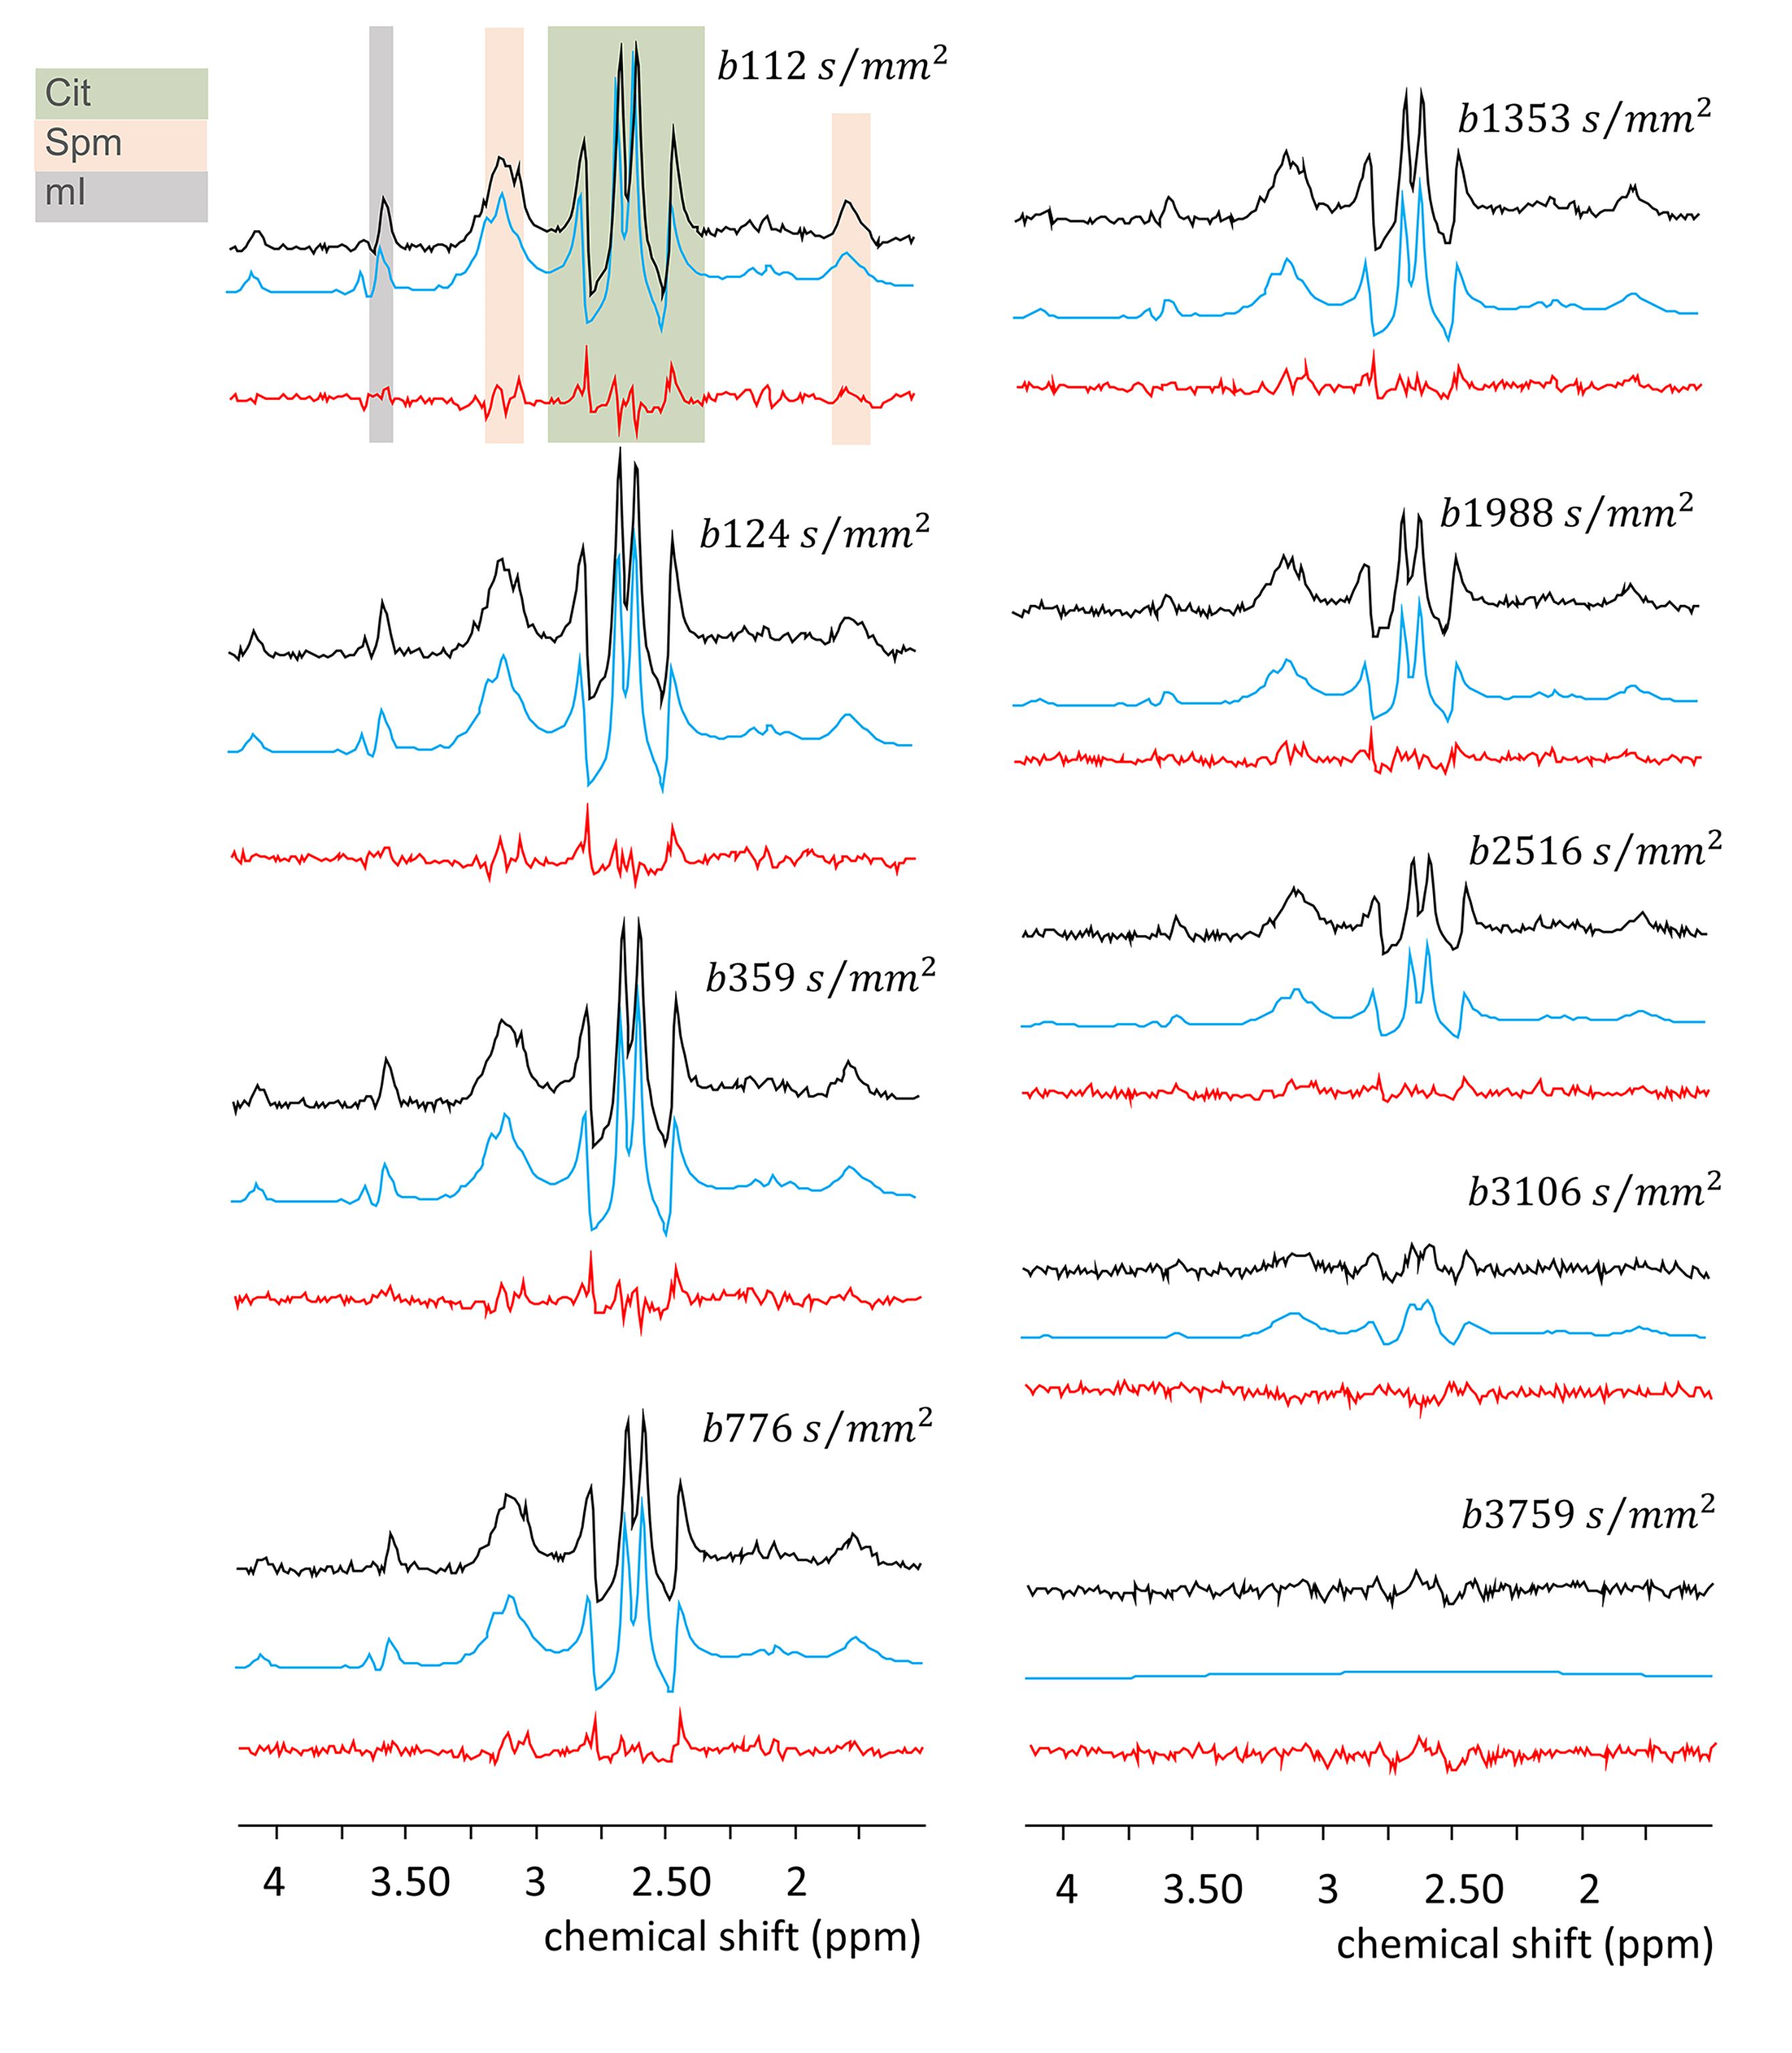
Figure 1. In vitro single-voxel DW-MRS – MR spectra acquired for 9 b-values. Black: spectra after motion correction scheme; Blue: the fits of the metabolites signals; Red: fit residual
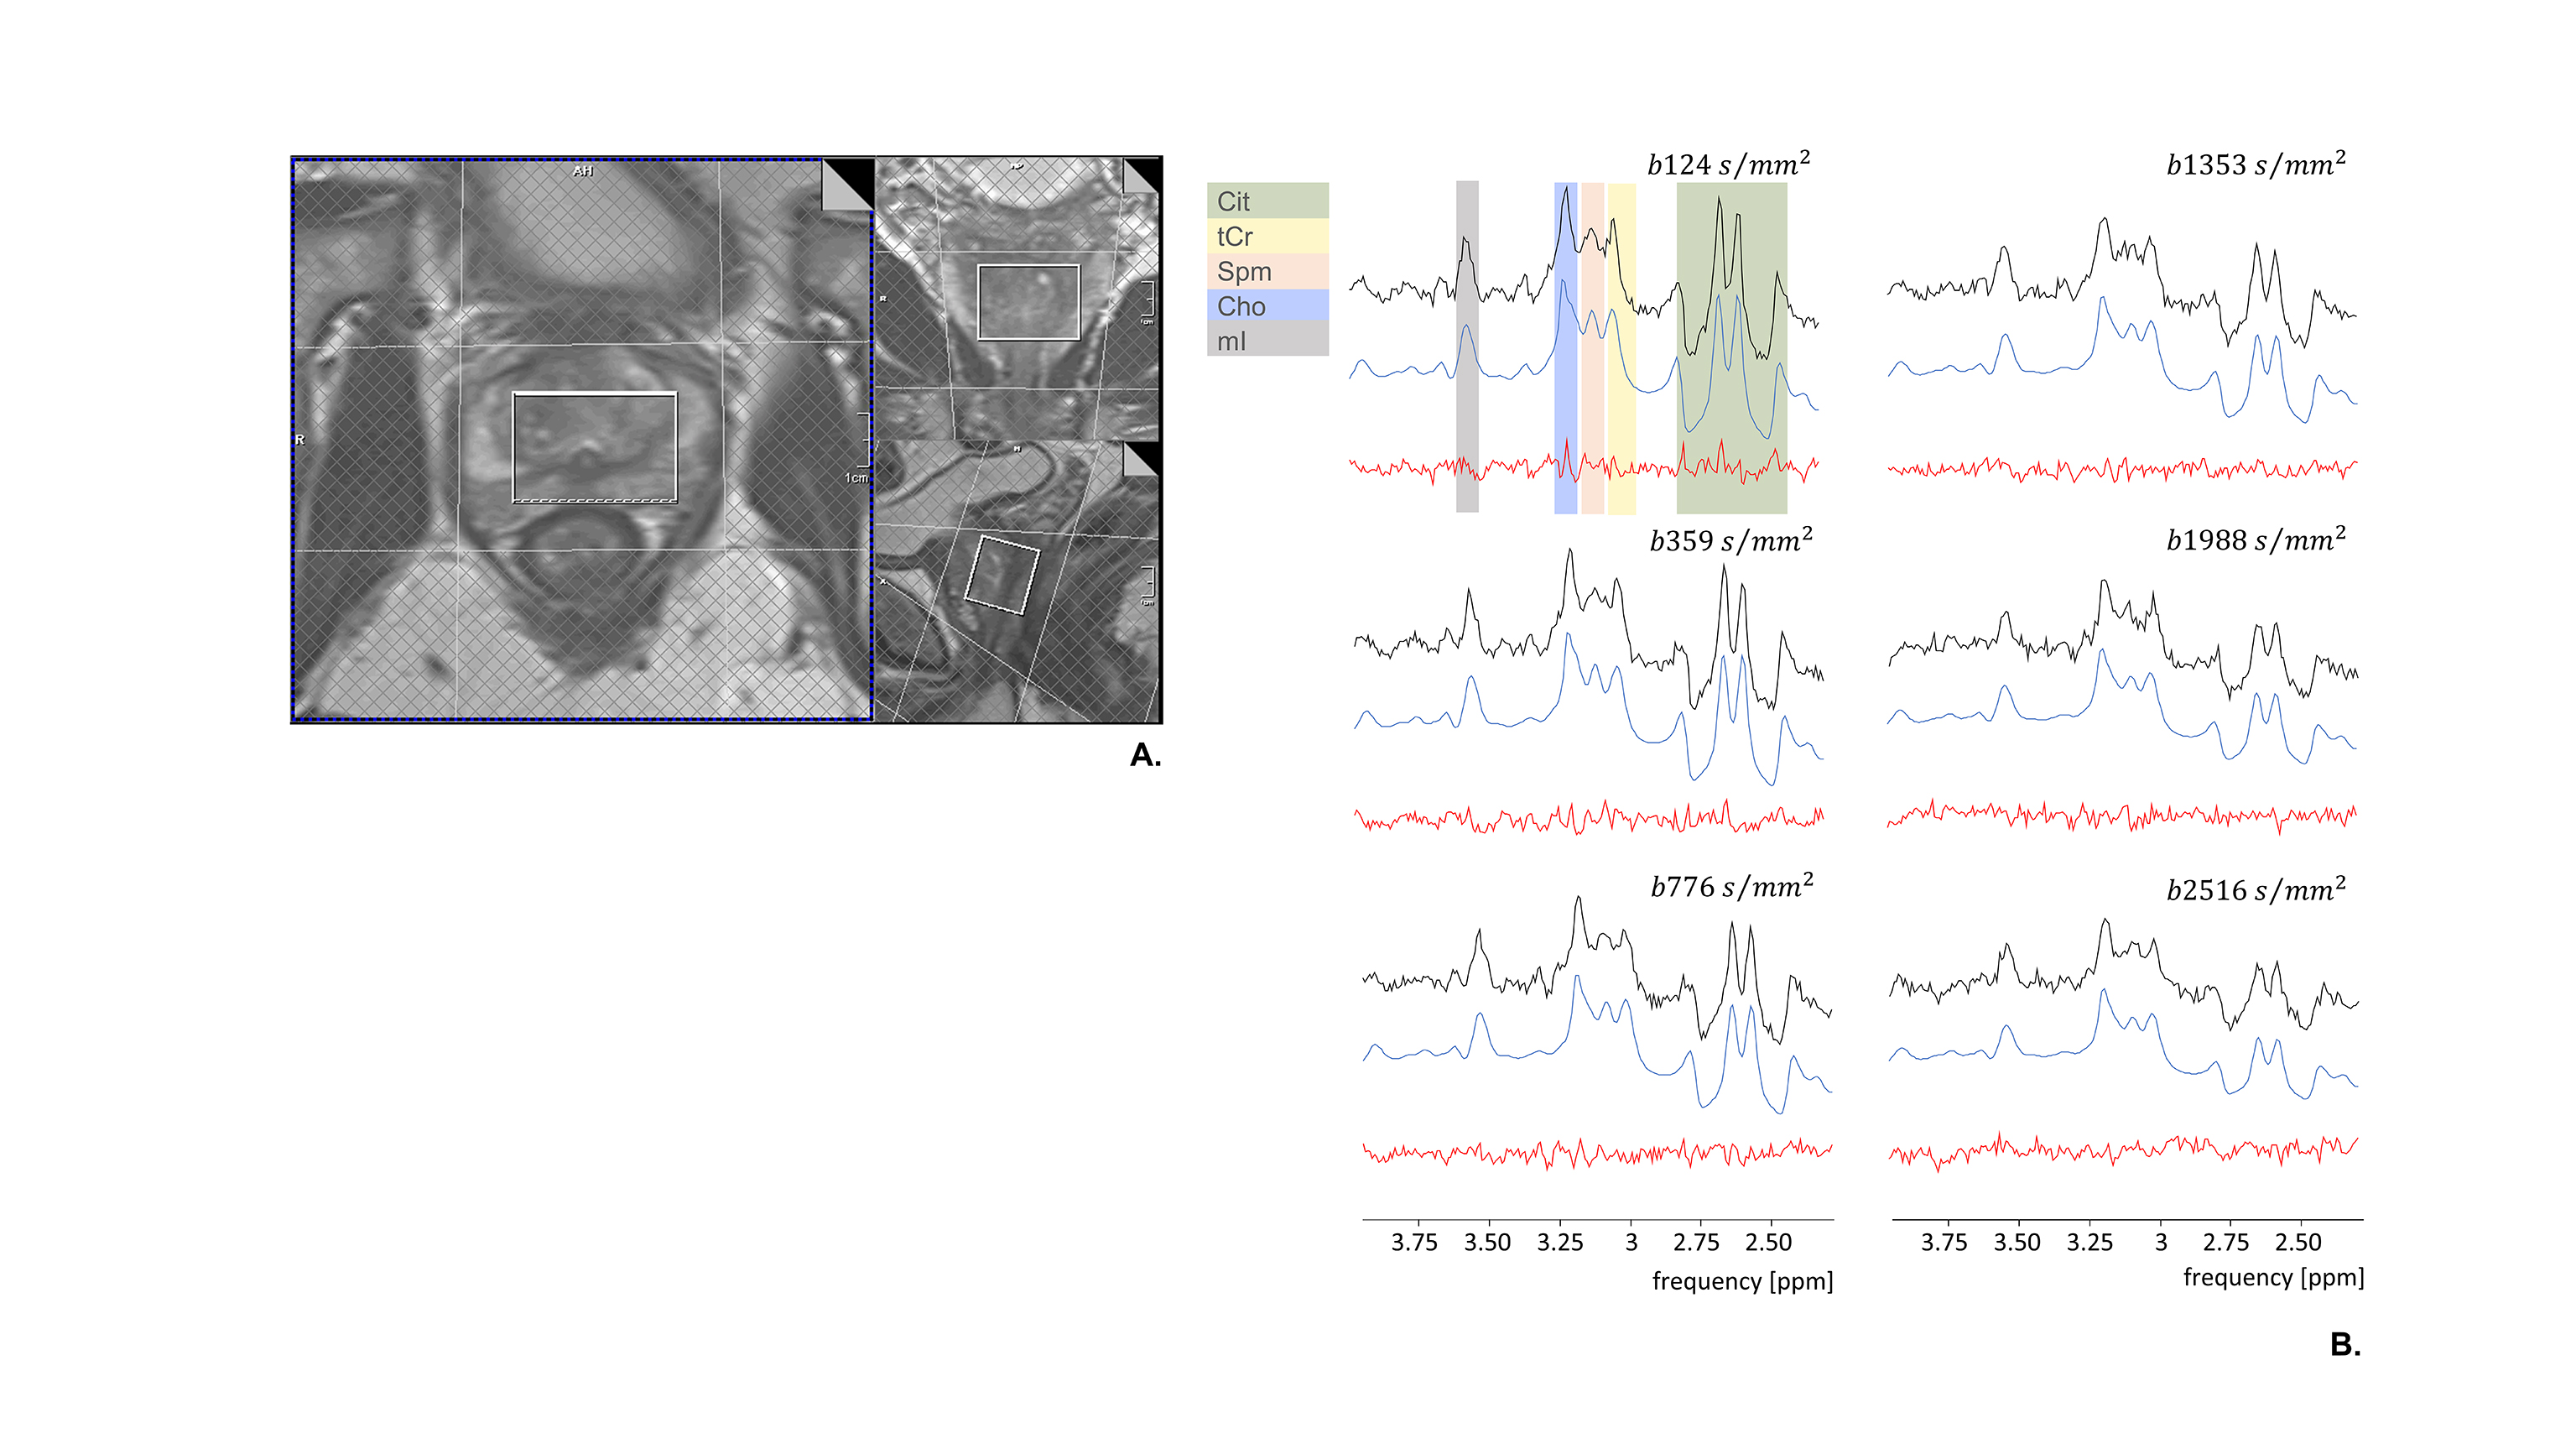
Figure 2. In vivo single-voxel DW-MRS of good quality – A. T2w image showing voxel position (volume= 13.2 cm3) B. MR spectra acquired for 6 b-values. Black: spectra after corrections; Blue: fitting of metabolite signals; Red: fit residuals. Citrate diffuses fastest, while the other metabolites diffuse slower with Spe and mI unexpectedly slow (similarly to tCho and tCr) even though present in the luminal space.
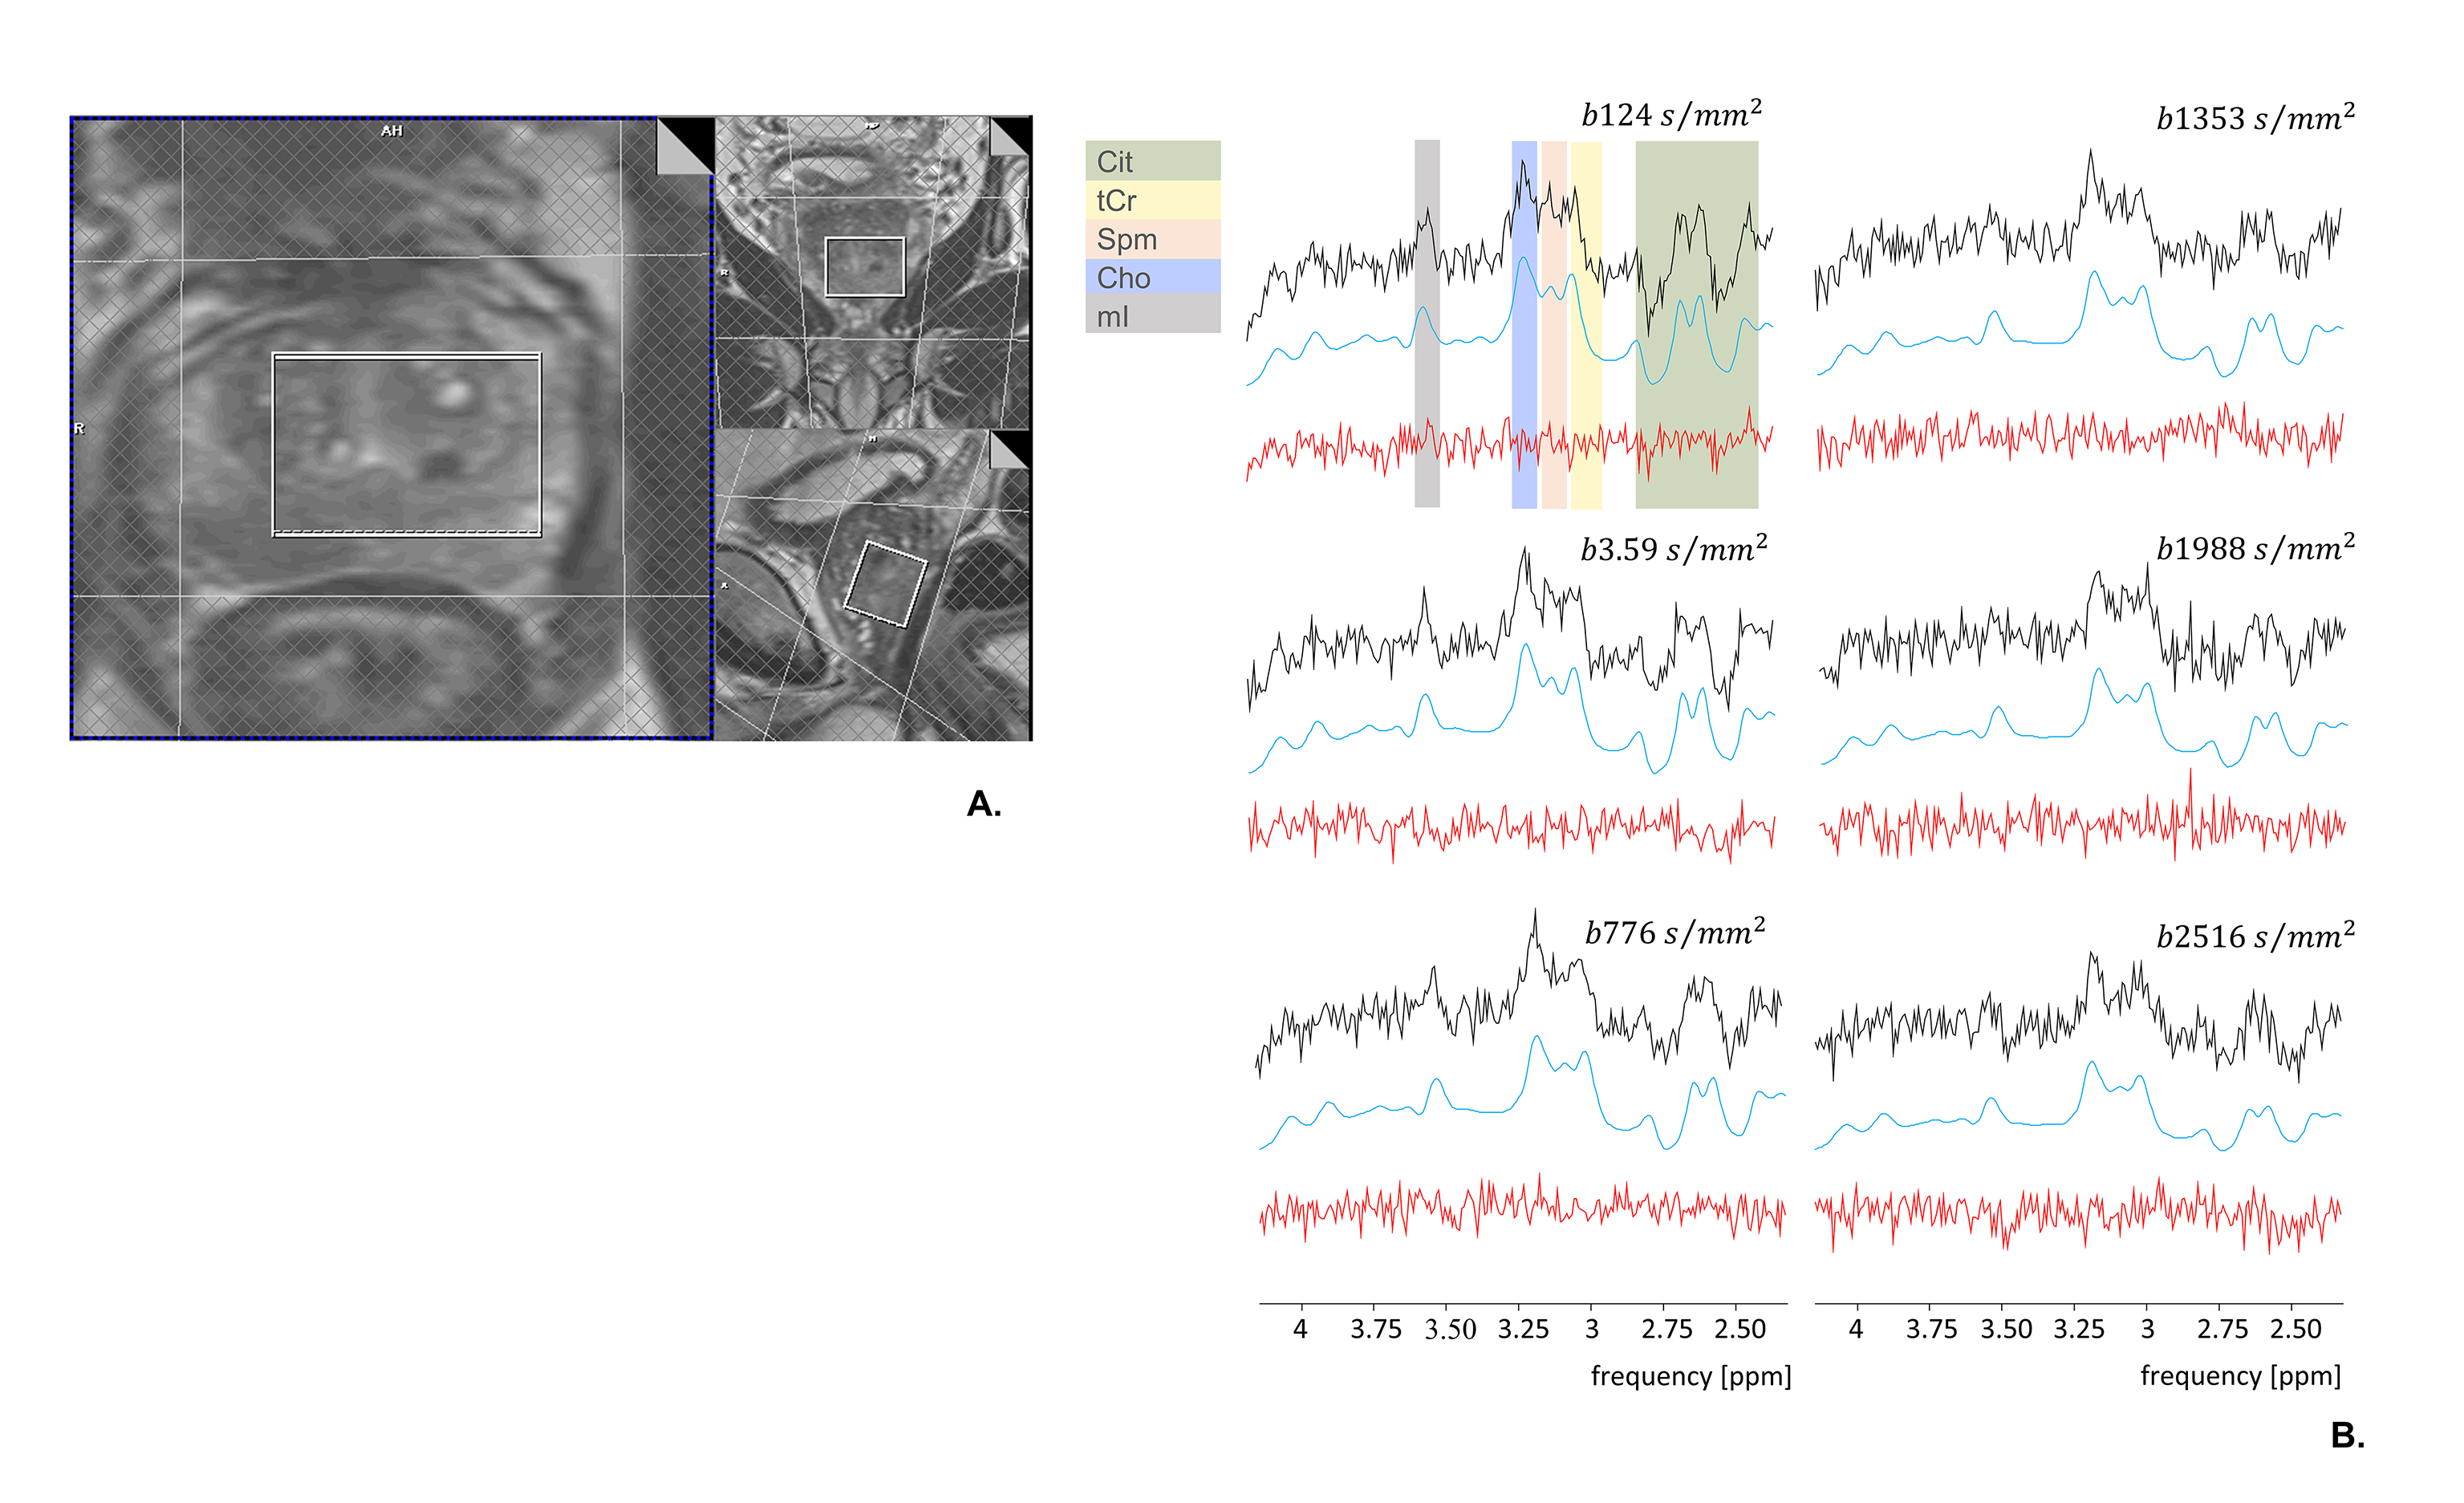
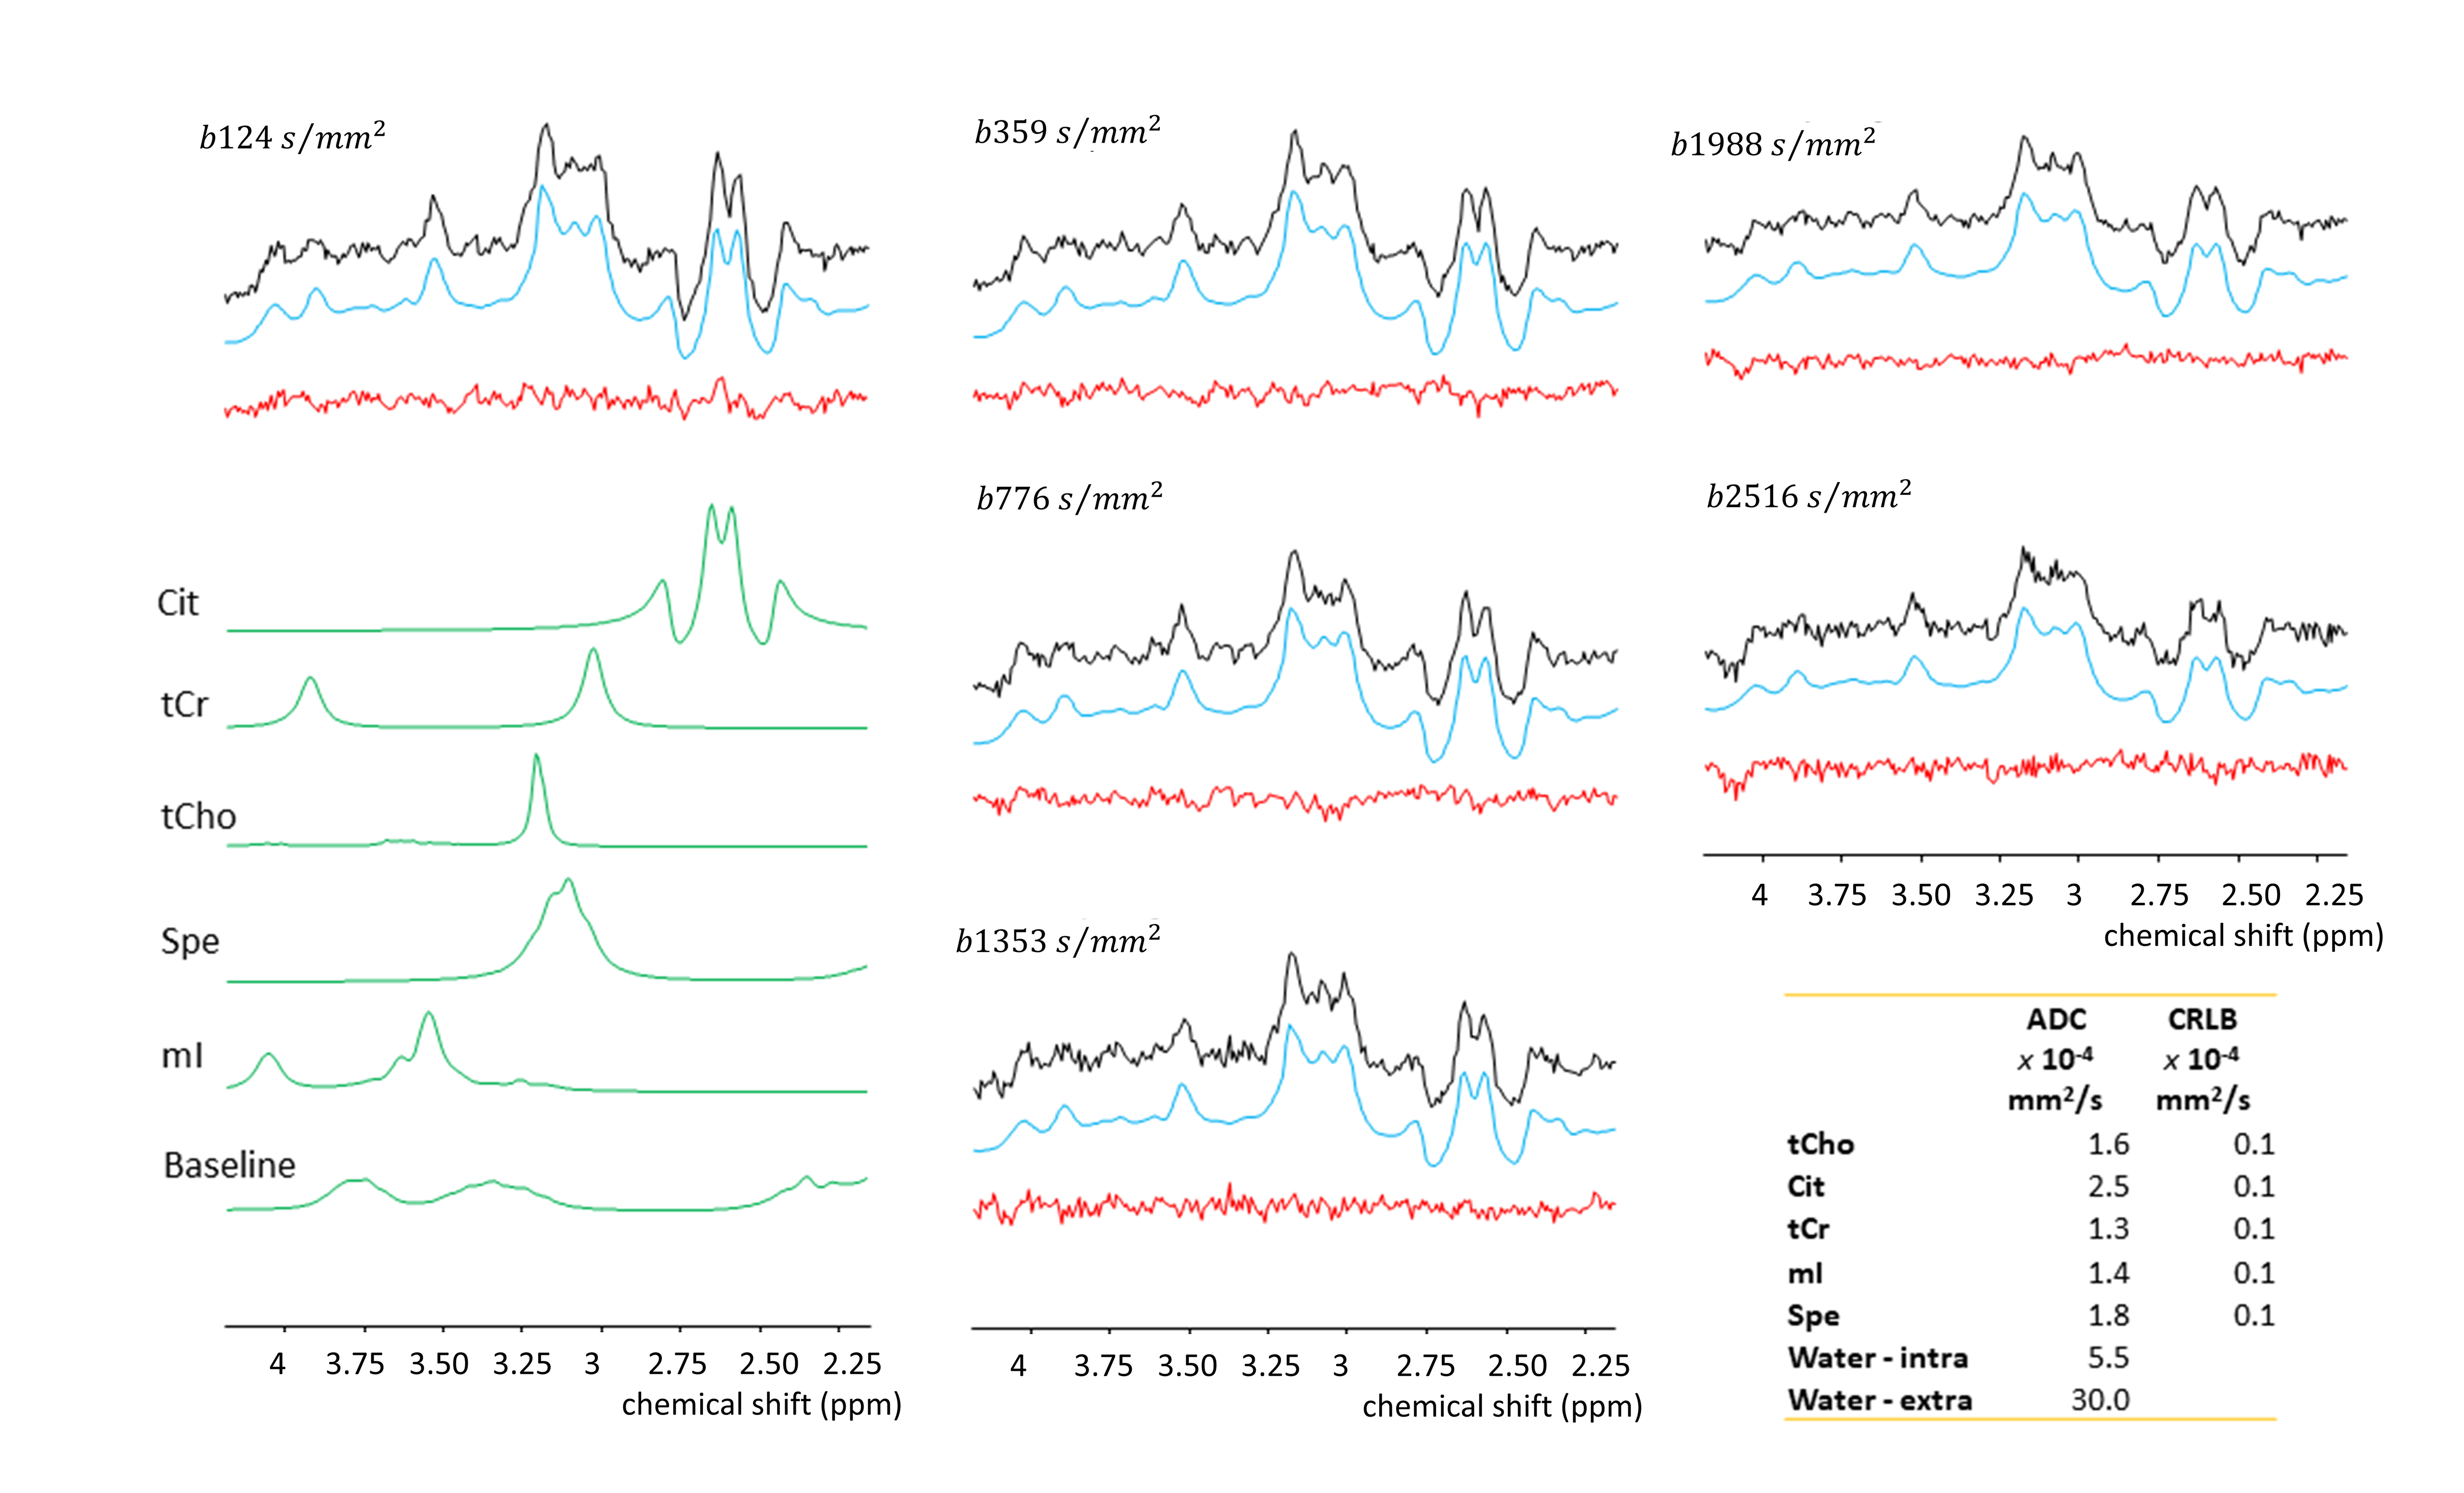
Figure 4. In-vivo single-voxel DW-MRS of averaged spectra obtained from nine volunteers – Black: spectra after corrections; Blue: fit of metabolite signals; Red: fit residuals. In green the fitted metabolite patterns for the metabolites of interest. Tissue ADCs and estimates’ precision (Cramer Rao Lower Bound, CRLB) are reported for water and tCho, Cit, tCr, mI and Spe.
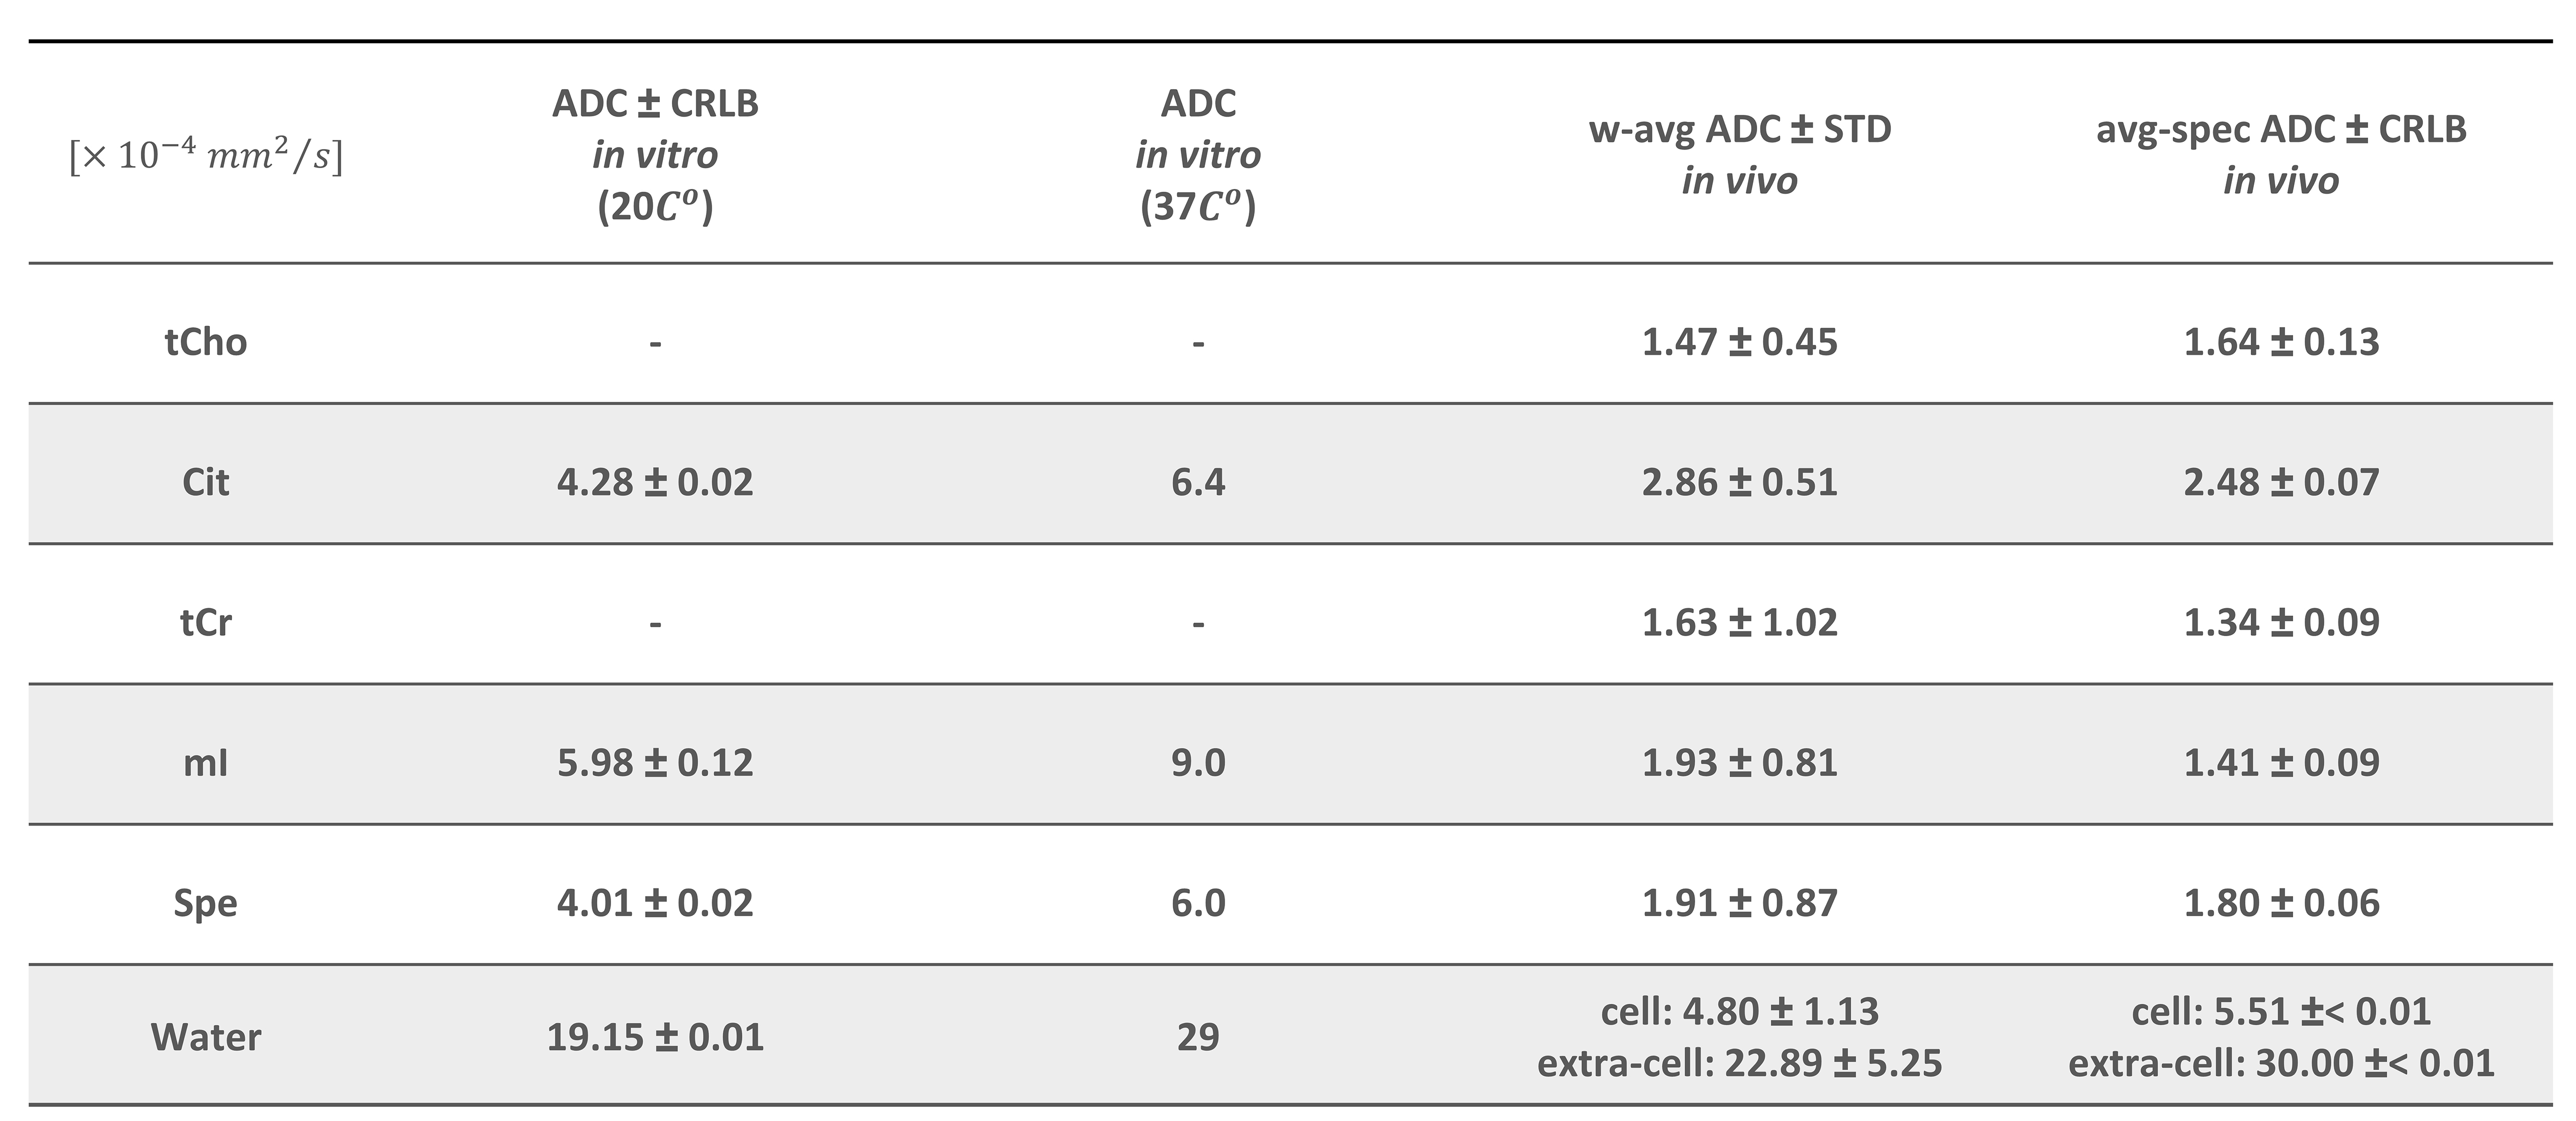
Table 1. Estimated ADC values of metabolites and water – In-vitro ADC values are listed as obtained from in vitro measurements in a prostatic fluid mimic solution at 200C and when approx. temperature-corrected for 370C. In-vivo ADC values correspond to the weighted average from the individual subjects’ results, and to the ADC estimated from the fit of a cohort-averaged spectra (Fig. 4).