3697
Effects of denoising on diffusion-weighted MRS data1Center for Magnetic Resonance Research, University of Minnesota, Minneapolis, MN, United States
Synopsis
Keywords: Spectroscopy, Data Processing, Diffusion-Weighted MRS, High Field (3T), Denoising, Low-Rank Model
Diffusion-weighted (DW) MRS is a useful tool for detecting microstructural changes linked to neurological diseases. However, DW-MRS suffers from low signal-to-noise ratio, which makes human application extremely difficult. To overcome this issue, a denoising algorithm based on low-rank approximation was recently utilized. Here, effects of the application of low-rank based denoising algorithm to DW-MRS data are described based on synthetic data. Severely artifactually low group SDs for the apparent diffusion coefficients (ADCs) of all metabolites and biased mean ADC values were observed after denoising. These findings suggest that low-rank approximations are detrimental to a reliable quantification of ADCs of metabolites.Introduction
Diffusion-weighted (DW) MRS has been validated as a tool for detecting microstructural changes linked to neurological diseases1. Alterations in apparent diffusion coefficients (ADC) of N-acetylaspartate and N-acetylaspartylglutamate (NAA+NAAG=tNAA), creatine and phosphocreatine (Cr+PCr=tCr), and choline containing compounds (typically glycerophosphorylcholine and phosphorylcholine; GPC+PCho=tCho) were observed in ischemic stroke2, lupus3, and multiple sclerosis4. Similarly, variations of myo-inositol (mIns) and glutamate (Glu) ADCs were observed in aging5.However, DW-MRS suffers from intrinsically low signal-to-noise ratio (SNR), which makes application of this technique extremely difficult and time consuming. To overcome this issue, a denoising algorithm based on low-rank approximation of the acquired data was recently utilized6. Similar algorithms were previously applied for denoising MRSI7, diffusion MRI8,9 and functional MRI10 data.
In this abstract, the effects of the application of low-rank based denoising algorithm to DW-MRS data are described in detail using synthetic DW-MRS data in which ADC values are known.
Methods
Theory: assuming that the dataset X is a noisy redundant representation of some ground truth Y, a low-rank approximation of X may be a more informative dataset of Y, because reducing the dimensionality of the original dataset X might discard part of the noise.With DW-MRS data, a redundant complex matrix X is built by concatenating N FIDs of M time points. Using the singular value decomposition, the matrix can be decomposed as X = USV*, where U is a complex matrix of dimension N×N, V is a complex matrix of dimension M×M, and V* is its conjugate transpose, and S is a real diagonal matrix of dimension N×M and is composed by eigenvalues in descending order (i.e., S1,1 is the highest eigenvalue). The low-rank matrix X’ is then achieved by truncating the diagonal matrix S at a target rank P and by computing the inverse operation X’ = US’V*, where S’ is the truncated diagonal matrix.
Different algorithms were proposed for an optimal choice of the rank P6-9. Here, the output of low-rank approximation of simulated DW-MRS experiments were investigated using P = 1, 3, 5, 10, 30, 50, 100, and 200. Results were compared with noisy data and the ground truth.
Data: Ninety DW-MRS datasets were generated with Matlab matching data quality previously obtained in-vivo at 3 T in the human occipital lobe with stimulated acquisition mode5 sequence (STEAM; TE/TM=21.22/105 ms).
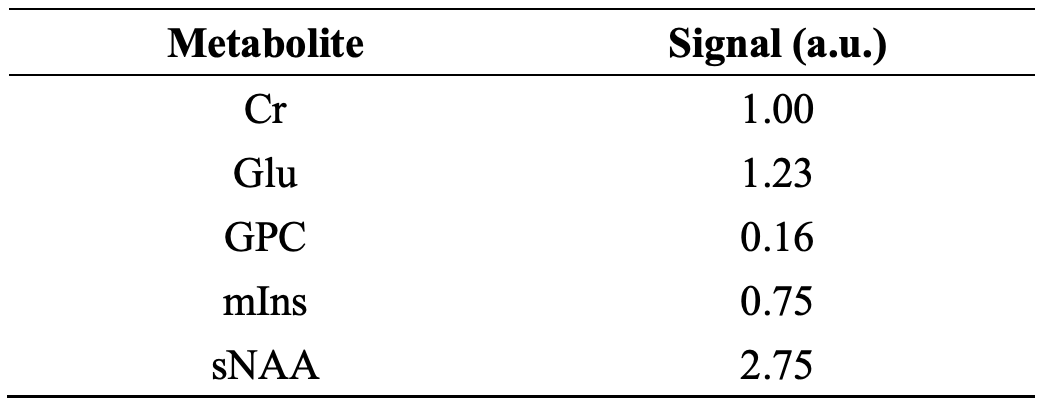
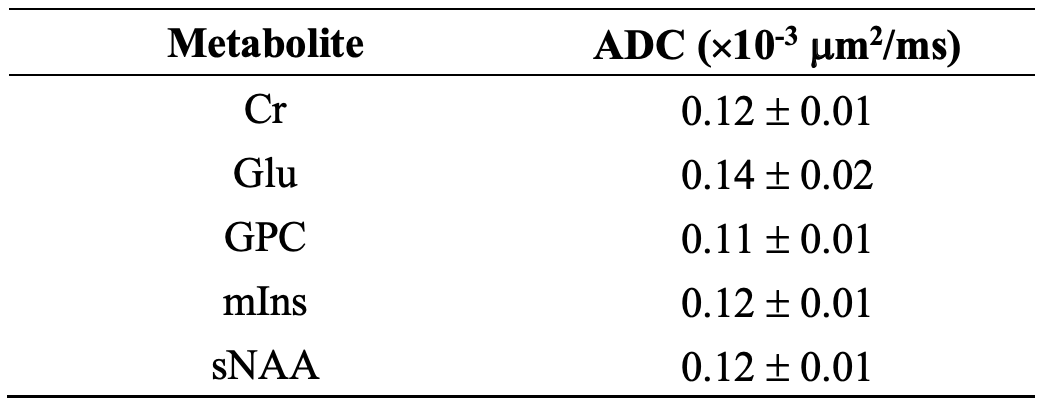
Spectra were created by linear summation of the signals from five metabolites: Cr, Glu, GPC, mIns, and NAA singlet (sNAA, i.e., CH3 group). For each dataset, seven diffusion conditions were simulated: a null b-value (16 averages; Table 1), and six DW directions (48 averages; Table 2) with b-value of 3172 s/mm2. The six diffusion weighted directions were simulated to mimic the application of three bipolar gradients5.
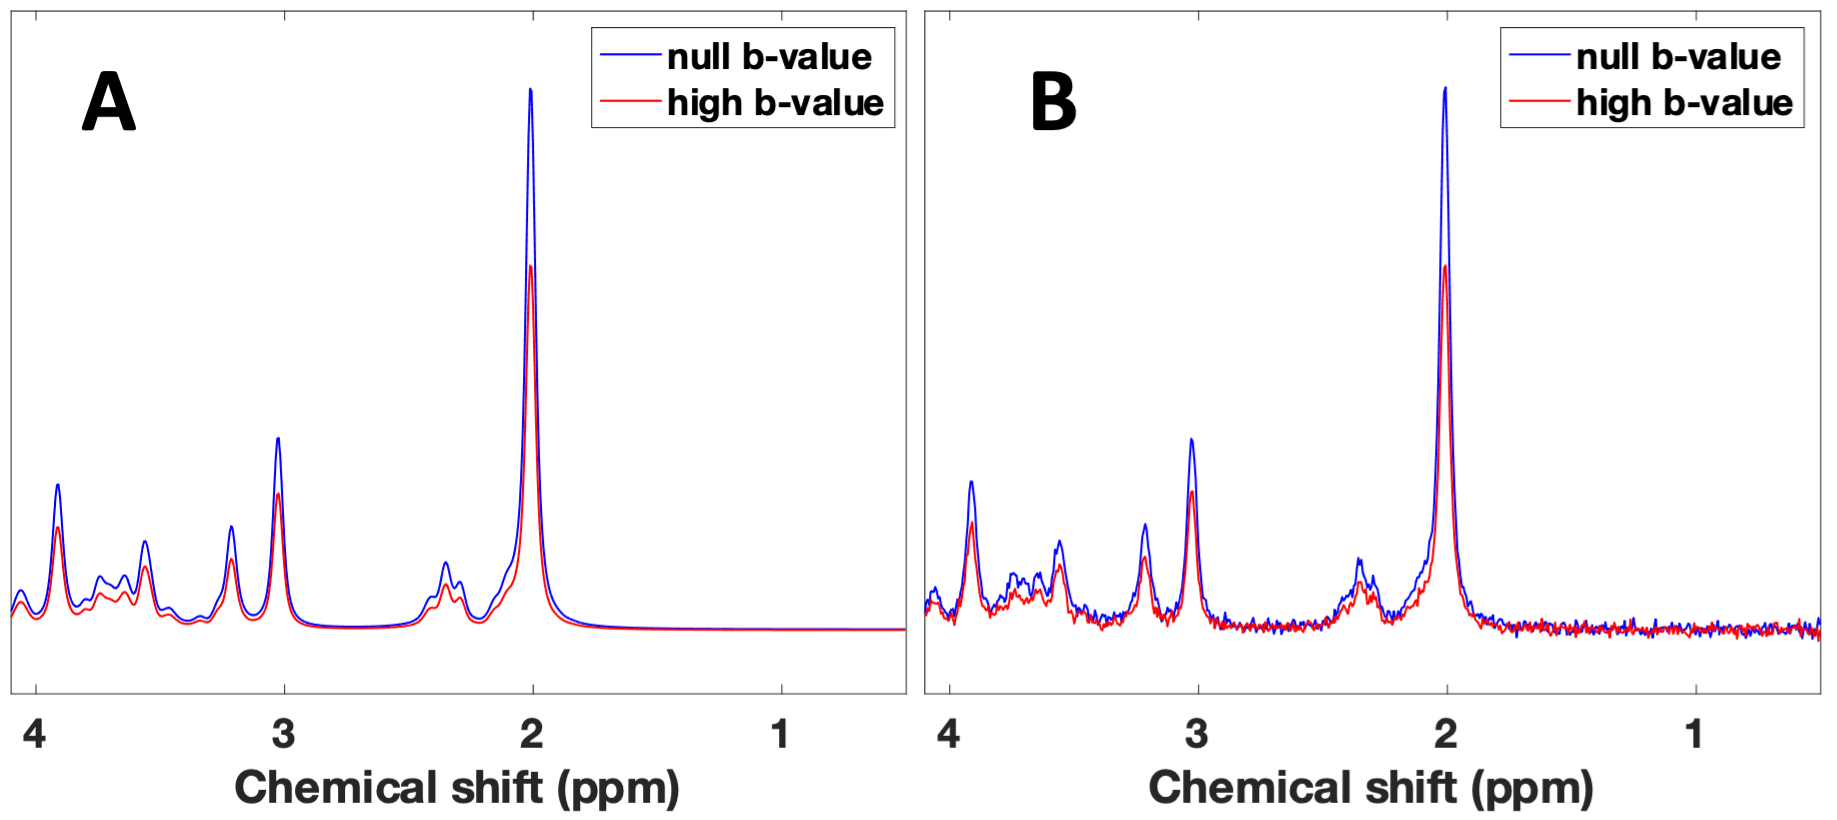
Spectra, at null b-value and for all six DW directions, were averaged and quantified with LCModel11 separately (Figure 1). ADCs for five metabolites are reported for all the investigated ranks. The reported ADCs are the average values from three gradient diffusion directions after computing the geometric mean of the metabolite signals from both gradient polarities5.
Results
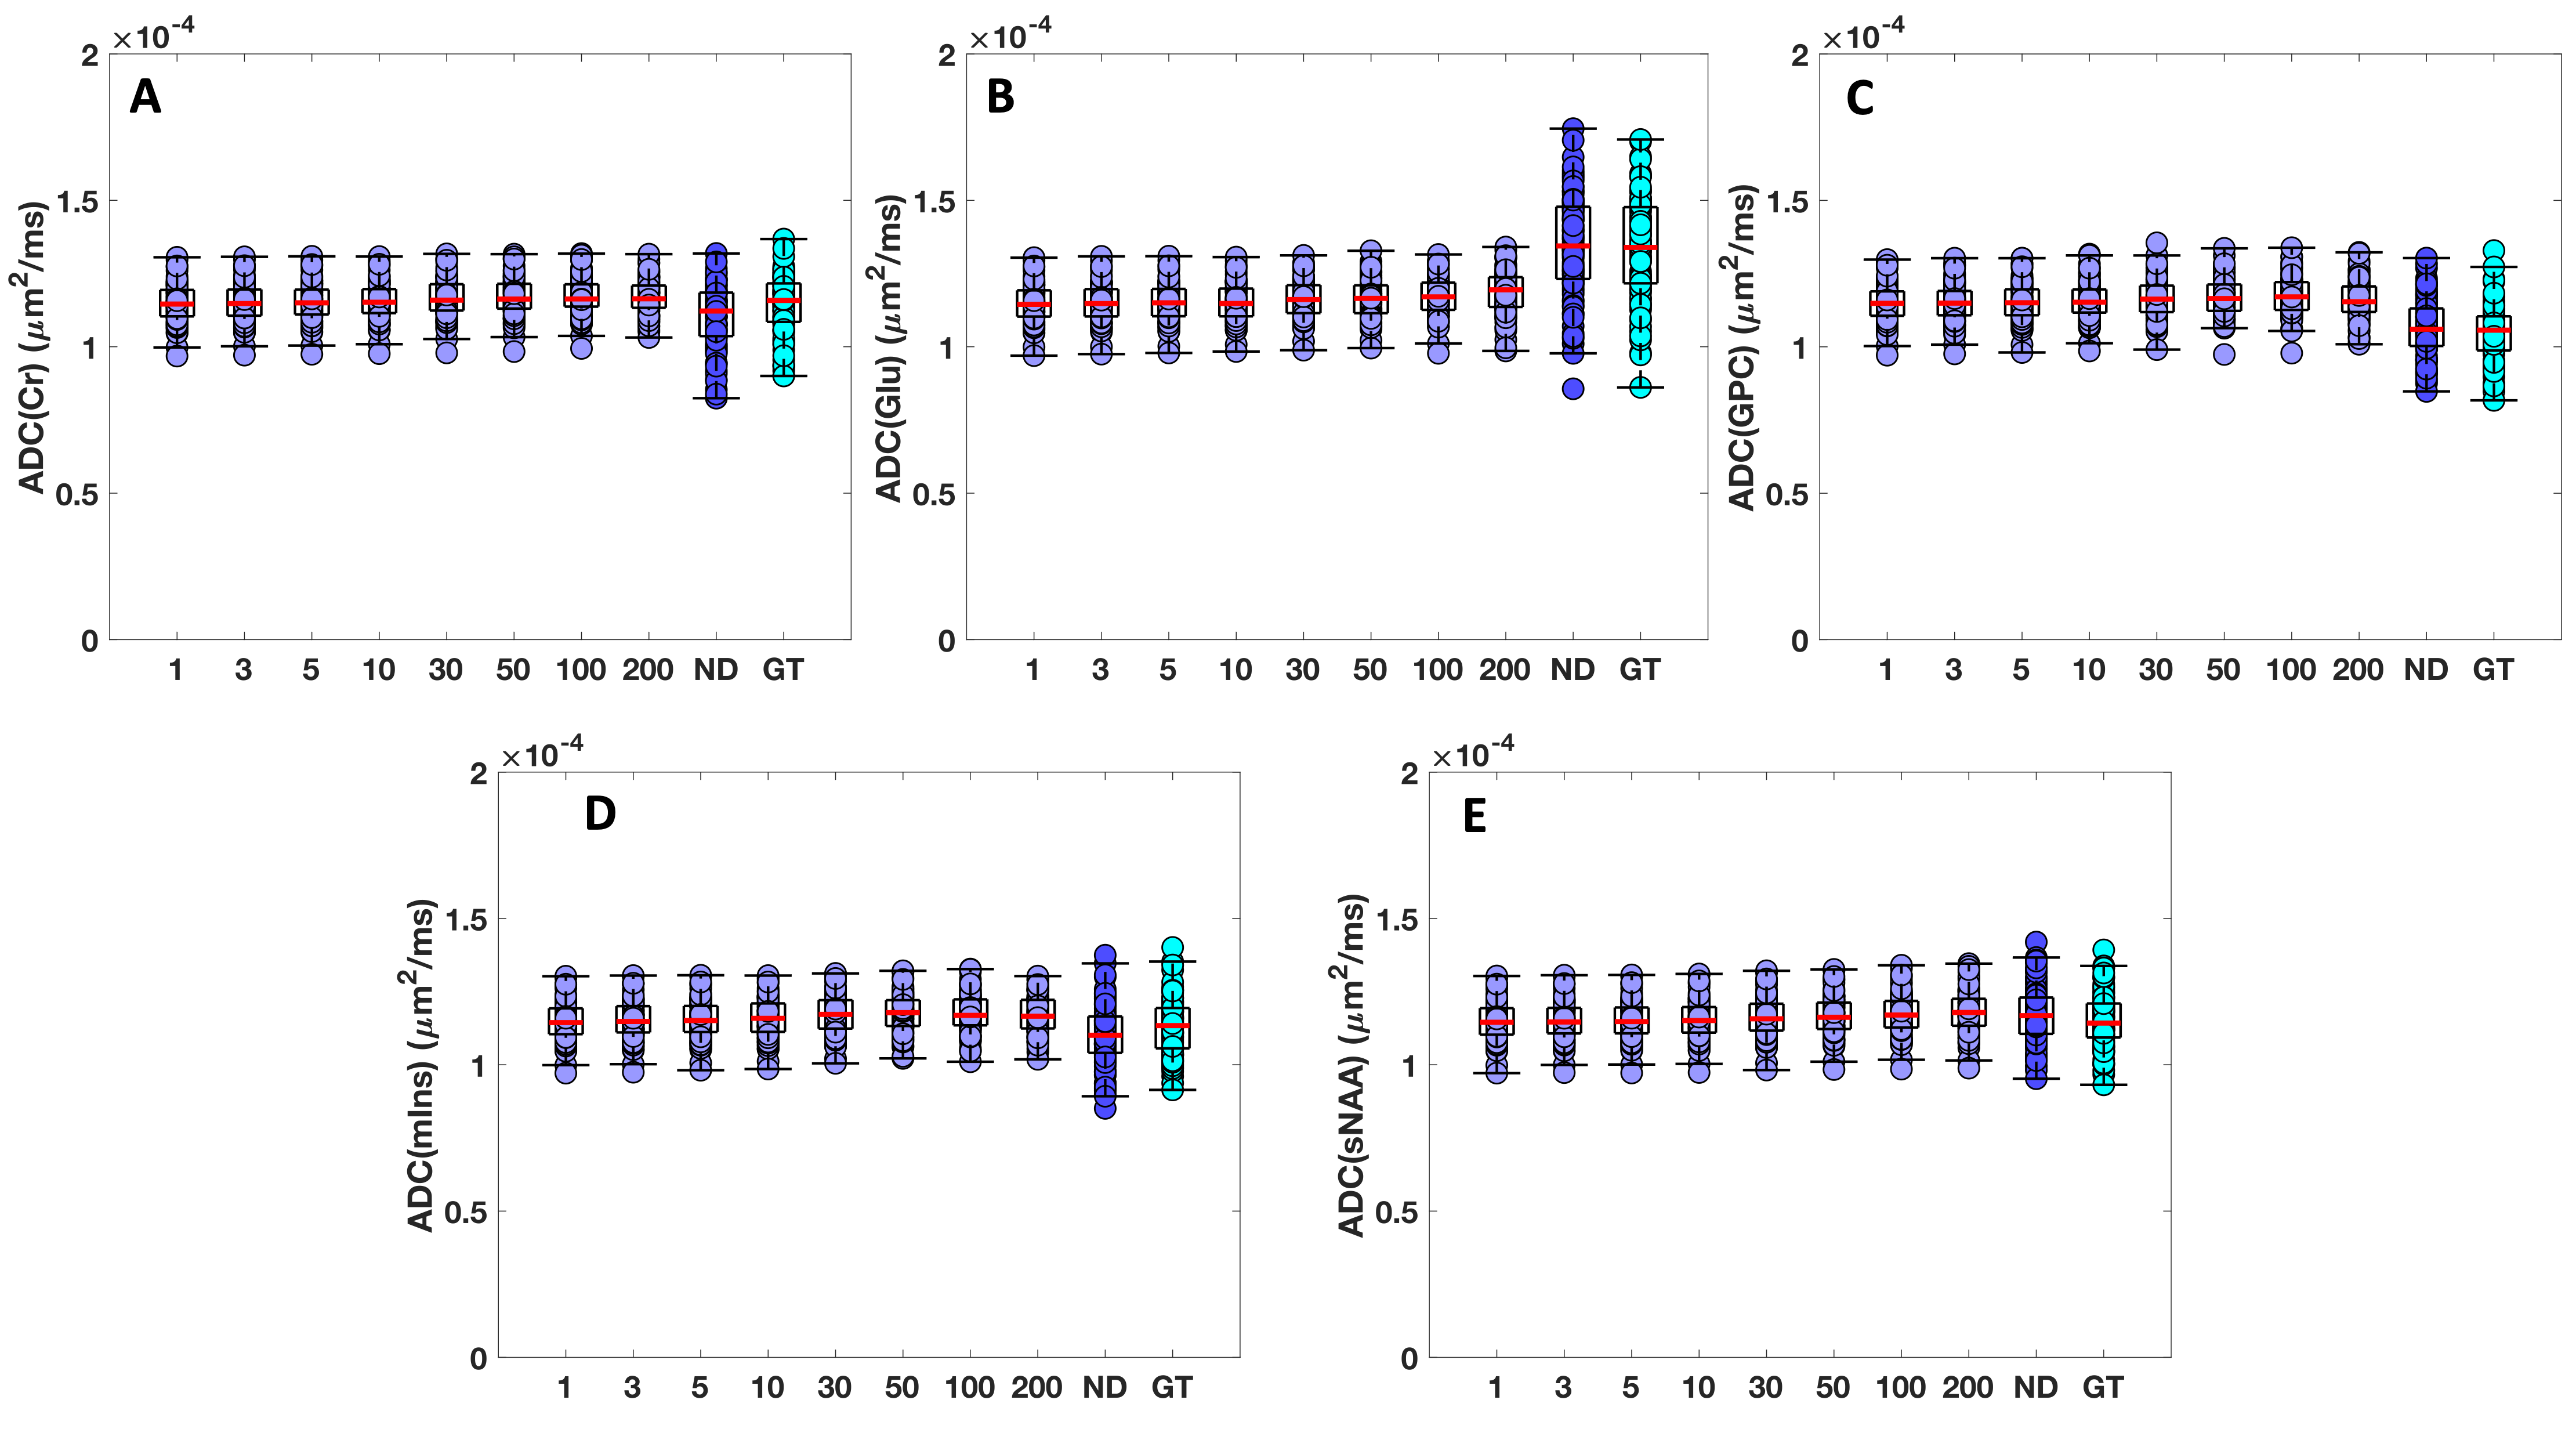
For all ADCs of metabolites, the group SDs from the low-rank data drastically decreased compared to those from the noisy data and the ground truth (Figure 2). Specifically, the decrease between low-rank data and ground truth was ~37% for ADC(Cr), ~62% for ADC(Glu), ~32% for ADC(GPC), ~33% for ADC(mIns), and ~28% for ADC(sNAA).In terms of mean values, the low-rank data showed a drastic increase compared to the ground truth for ADC(Glu) of ~13%, and a decrease was observed for ADC(Cr) of ~5%, for ADC(GPC) of ~9%, and for ADC(mIns) of ~6%. While no differences were observed for ADC(sNAA). Overall, ADCs for all metabolites from the low-rank data were very close to each other, and exactly the same for P=1.
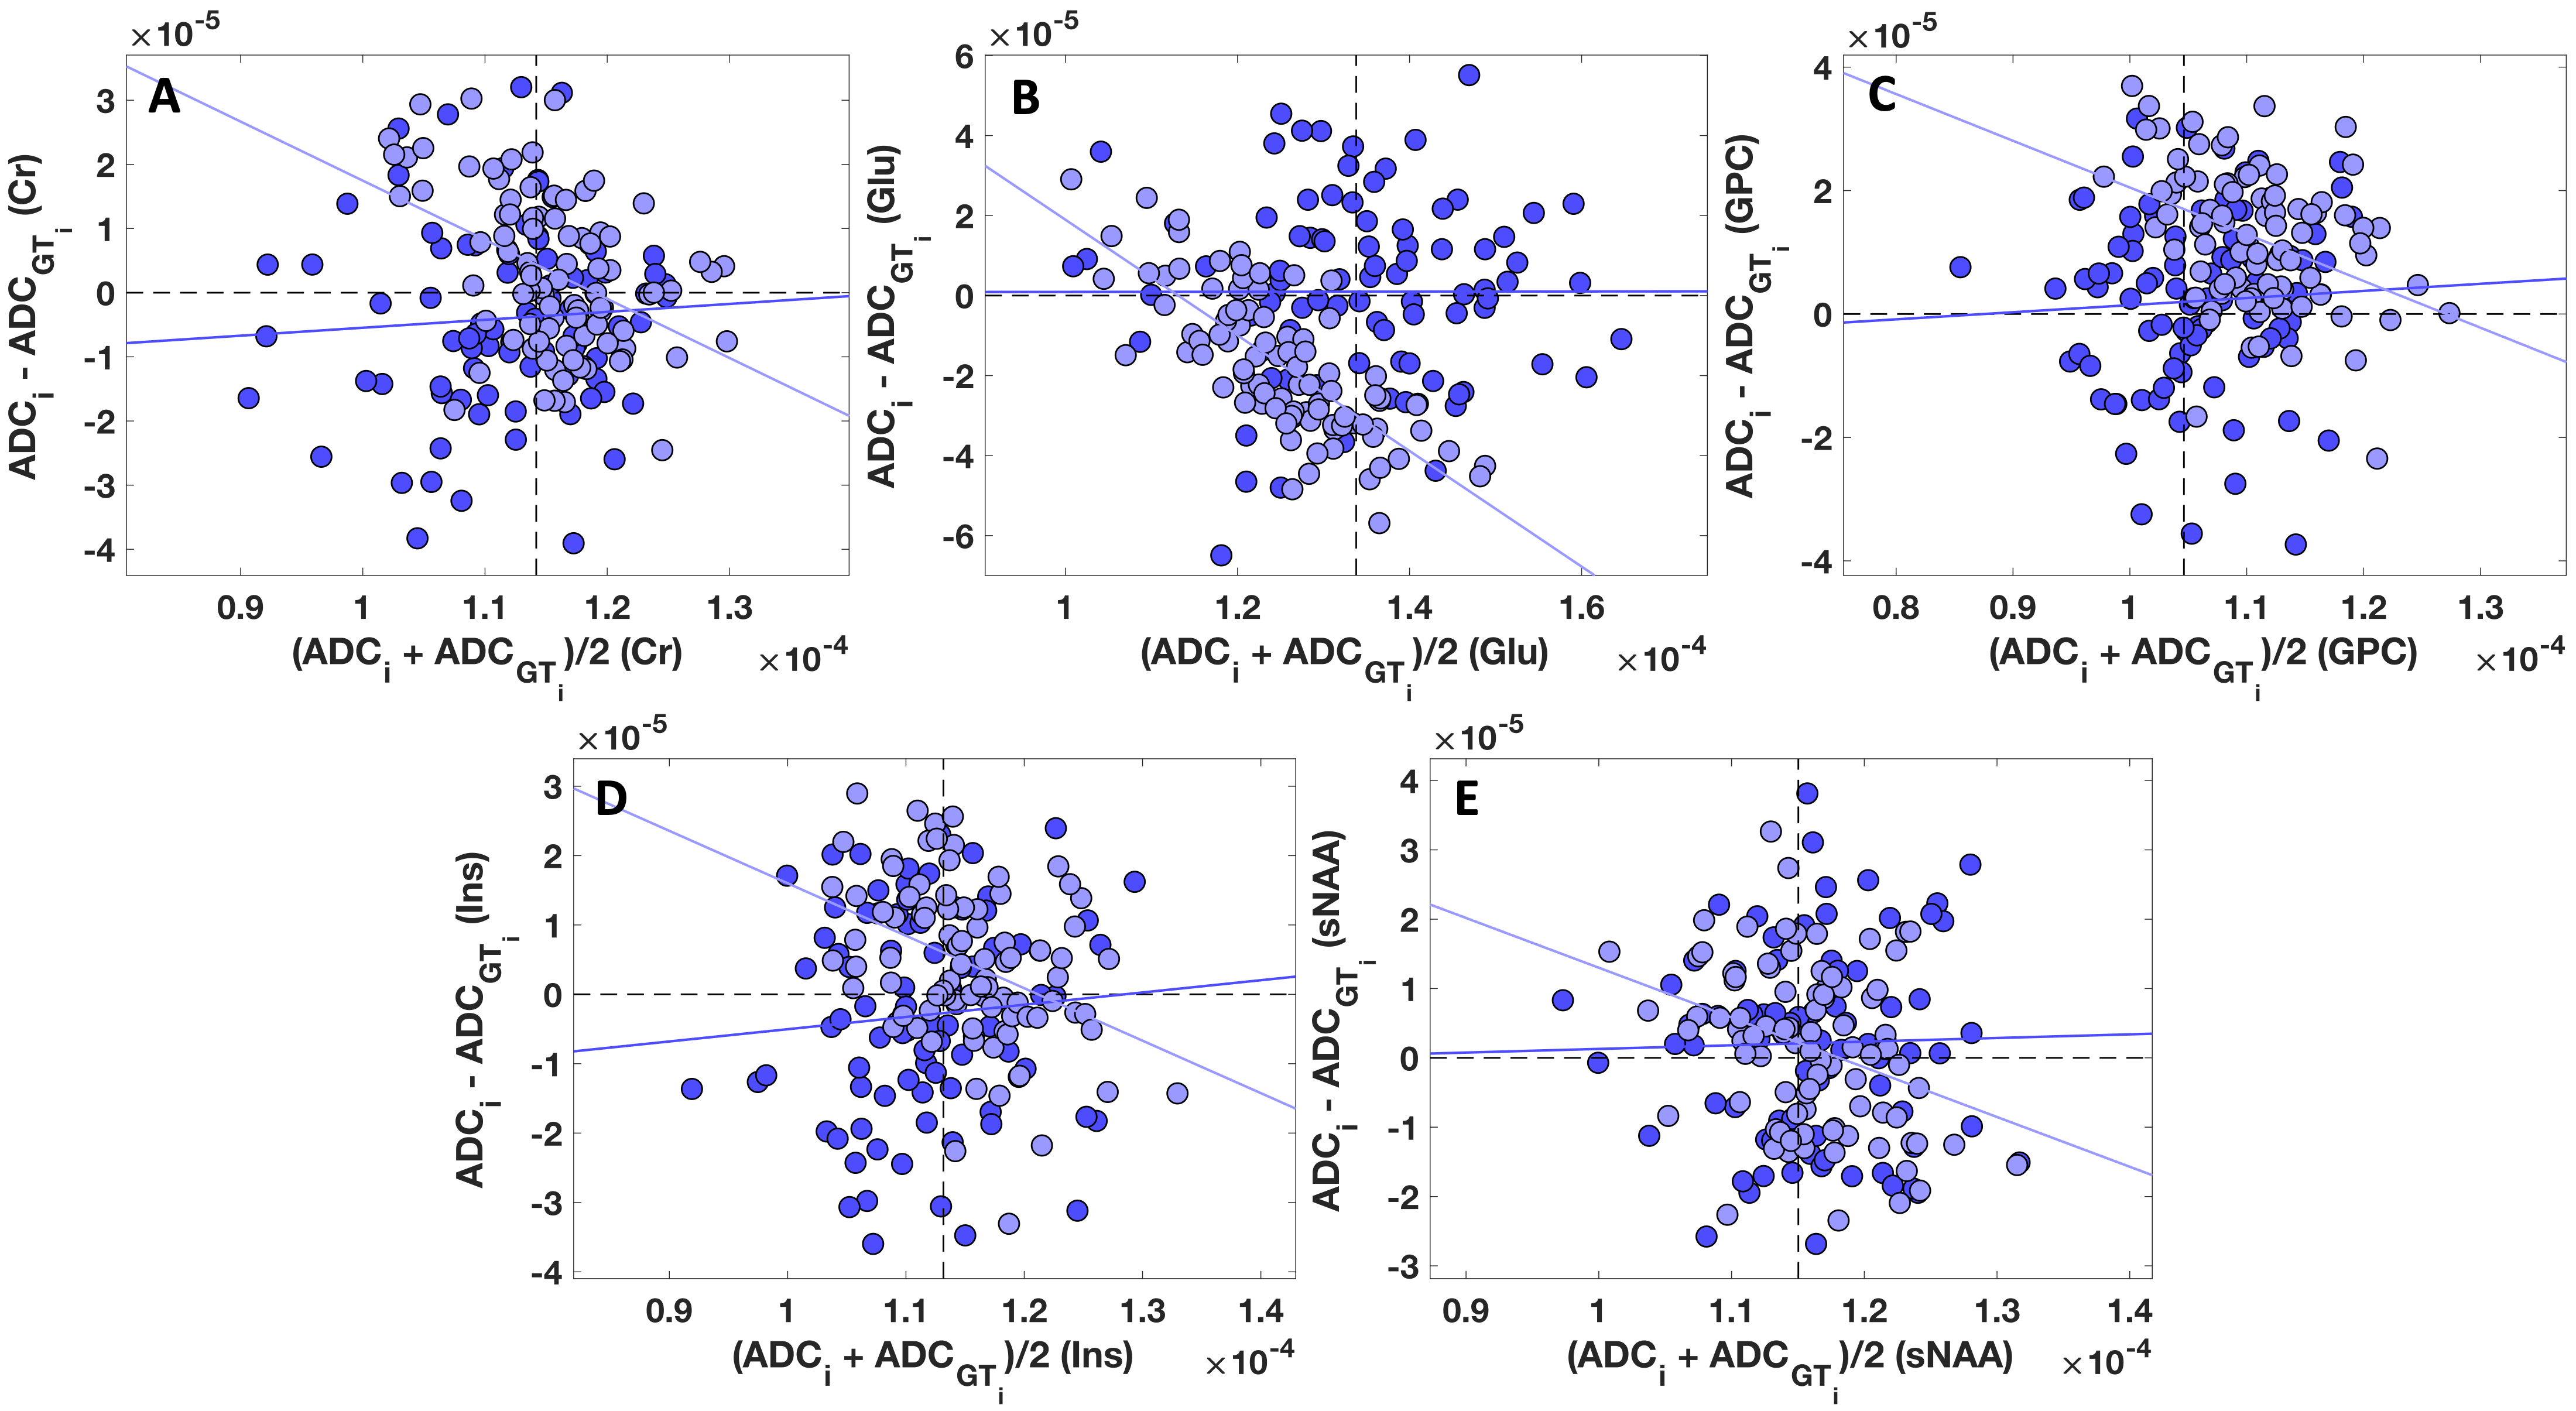
In Figure 3, the Bland-Altman plots of metabolites ADCs from the data with P=50 and from the noisy data are reported. ADCs of metabolites from the data with P=50 exhibited a significant negative correlation (ADC(Cr): r=-0.44, p=2×10⁻⁵; ADC(Glu): r=-0.76, p=4×10-18; ADC(GPC): r=-0.38, p=2×10⁻⁴; ADC(mIns): r=0.44, p=2×10⁻⁴; ADC(sNAA): r=-0.32, p=0.002).
Discussion
The severely lower group SDs for ADCs of all metabolites from the low-rank data compared to the ground truth suggest that the low-rank approaches for denoising DW-MRS data introduce a bias (Figure 2). None of the investigated ranks produced ADCs which matched the group SDs of the ground truth. This finding suggests that low-rank denoising algorithms, even those which use conservative approach in the selection of the rank, remove information from a DW-MRS experiments. A similar conclusion arises from the observation that fairly, or exactly, the same ADCs are obtained for all metabolites from the low-rank data (Figure 2).The significant negative correlations observed in Figure 3 show that low-rank approximations tend to affect the outliers more severely. Therefore, any significant variation observed in a DW-MRS experiment is no longer reliable if a denoising algorithm based on the low-rank approximation is used.
Conclusions
The biases introduced by low-rank approximations are detrimental to a reliable quantification of metabolites ADCs.Acknowledgements
The authors thank K. Kay, PhD, P. Bolan, PhD, and S. Moeller, PhD, for helpful discussion; and D.K. Deelchand, PhD, for providing the basis set.Funding: This work was supported by the National Institutes of Health [grant numbers R01MH113700, R21AG045606, P41EB015894, P30NS076408] and the W.M. Keck Foundation.
References
[1] Palombo et al., Insights into brain microstructure from in vivo DW-MRS, Neuroimage 2018; 182: 97-116, doi: 10.1016/j.neuroimage.2017.11.028.
[2] Genovese et al., Longitudinal monitoring of microstructural alterations in cerebral ischemia by in vivo diffusion-weighted magnetic resonance spectroscopy, Radiology 2022; doi: 10.1148/radiol.220430.
[3] Ercan et al., Glial and axonal changes in systemic lupus erythematosus measured with diffusion of intracellular metabolites, Brain 2016; 139(5): 1447-1457, doi: 10.1093/brain/aww031.
[4] Wood et al., Investigating Axonal Damage in Multiple Sclerosis by Diffusion Tensor Spectroscopy, J Neurosci. 2012; 32(19): 6665-6669, doi: 10.1523/jneurosci.0044-12.2012.
[5] Deelchand et al., Changes in the intracellular microenvironment in the aging human brain, Neurobiol. Aging 2020; 95: 168-175, doi: 10.1016/j.neurobiolaging.2020.07.017.
[6] Mosso et al., MP-PCA denoising for diffusion MRS data: promises and pitfalls, NeuroImage 2022; doi: 10.1016/j.neuroimage.2022.119634.
[7] Clarke et al., Uncertainty in denoising of MRSI using low-rank methods, MRM 2022; 87(2): 574-588, doi: 10.1002/mrm.29018
[8] Veerart et al., Denoising of diffusion MRI using random matrix theory, NeuroImage 2016; 142: 394-406, doi: 10.1016/j.neuroimage.2016.08.016.
[9] Moeller et al., Noise Reduction with DIstribution Corrected (NORDIC) PCA in dMRI with complex-valued-parameter-free locally low-rank processing, NeuroImage 2021; 10.1016/j.neuroimage.2020.117539
[10] Vizioli et al., Lowering the thermal noise barrier in functional brain mapping with magnetic resonance imaging, Nat. Commun. 2021; 12: 5181, doi: 10.1038/s41467-021-25431-8.
[11] Provencher SW. Estimation of metabolite concentrations from localized in vivo proton NMR spectra, MRM 1993; 30(6): 672–679, doi: 10.1002/mrm.1910300604.
Figures