3695
Implementation of Zoom MRSI at 7T for High-resolution GABA and Glutamate Mapping1Wolfson Brain Imaging Center, Department of Clinical Neurosciences, University of Cambridge, Cambridge, United Kingdom, 2Department of Psychology, University of Cambridge, Cambridge, United Kingdom, 3School of Health Sciences, Purdue University, West Lafayette, IN, United States, 4Weldon School of Biomedical Engineering, Purdue University, West Lafayette, IN, United States
Synopsis
Keywords: Spectroscopy, Brain, GABA, Glutamate, MRSI
High-resolution neurochemical mapping using 2D zoom or reduced field of view (rFOV) magnetic resonance spectroscopy (MRSI) enables the high-resolution metabolic assessment of brain regions that is difficult to probe with standard MRSI sequences. To our knowledge this is the first study to have demonstrated the application of zoom MRSI at 7T for GABA and glutamate mapping.Introduction
High-resolution neurochemical mapping using 2D zoom or reduced field of view (rFOV) Magnetic Resonance Spectroscopic Imaging (MRSI) enables the high-resolution metabolic assessment of brain regions that are difficult to probe with standard MRSI sequences. The 2D zoom MRSI method was recently implemented on a 3T MR system and produced very high-resolution metabolite maps of the cerebellum (voxel volume 62.5 μL) [1]. Here we aimed to implement and demonstrate this new 2D MRSI acquisition at 7T.Methods
A Siemens Terra 7T (Siemens, Germany) MR scanner equipped with 32 channel receive coil (Nova Medical, USA) was used for imaging of a healty volunteer (21 years, F). Written informed consent under an institutionally approved protocol was obtained. The scanning protocol consisted of a localizer and calibration scan, a high-resolution T1-weighted MP2RAGE scan (TR/TE/TI1/TI2 = 5000/2.56/900/2750 ms, FA1/FA2 = 5/3o, 240 sagittal slices, 0.65 x 0.65 x 0.65 mm3), followed by vendor-provided B0 and B1 shimming. Zoom MRSI [1] is performed using semi-LASER localization and 2D-density weighted concentric k-space sampling (DW-CRT) [2]. Water unsuppressed MRSI parameters were: TR/TE = 4030/36 ms, a 48x48 grid was used within the rFOV, while the nominal in-plane resolution of 2.5 mm x 2.5 mm with 20 mm thickness was obtained using rFOV = 120 mm x 120 mm x 20 mm; scanning time was 8 minutes. The MRSI volume was placed asymmetrically over the dorsolateral cortical regions above the cerebellum. Data reconstruction algorithms were implemented in MATLAB (Mathworks, Natick, USA). The residual water peak was removed using HLSVD algorithm [3]. LCModel [4] fitting was performed over the spectral range from 1.75 to 4.2 ppm. Metabolite levels are reported relative to tCr.Results
Figure 1 demonstrates the concentration and Cramer-Rao lower bound (CRLB) maps for the following metabolites: GABA, Glu, total NAA (NAA + NAAG) and total Cho (Pcho + GPC). Figure 2 shows the zoom MRSI spectra and LCModel fit results obtained from occipital cortex.Discussion
To our knowledge this is the first study to have demonstrated the application of zoom MRSI at 7T for GABA and glutamate mapping. The spectral quality enabled the quantification of GABA, Glu, total Cho and total NAA distribution on the imaging volume. Glu, tCho and tNAA CRLB’s were homogenuous througout the MRSI volume with values below 10%. The GABA CRLBs were within acceptable range (<15%) for the occipital lobe. It was observed that GABA concentration was higher in gray matter compared to white matter regions. The limitation of this study is the small sample size. Future studies will include more participants. In addition, test-retest assesment is needed to further estimate the reliability of the technique.Conclusion
Initial findings presented in this study indicate that high-resolution GABA and glutamate mapping of the occipital cortex is feasible using zoom MRSI at 7T.Acknowledgements
This work was supported by grants to Zoe Kourtzi from the Wellcome Trust [grant number 205067/Z/16/Z, 221633/Z/20/Z].References
1. Emir UE, Sood J, Chiew M, Thomas MA, Lane SP. High-resolution metabolic mapping of the cerebellum using 2D zoom magnetic resonance spectroscopic imaging. Magn Reson Med. 2021 May; 85(5): 2349-2358.
2. Chiew M, Jiang W, Burns B, Larson P, Steel A, Jezzard P, Albert Thomas M, Emir UE. Density-weighted concentric rings k-space trajectory for 1 H magnetic resonance spectroscopic imaging at 7 T. NMR Biomed. 2018 Jan; 31(1): e3838.
3. Cabanes E, Confort-Gouny S, Le Fur Y, Simond G, Cozzone PJ. Optimization of residual water signal removal by HLSVD on simulated short echo time proton MR spectra of the human brain. J Magn Reson. 2001; 150:116-125.
4. Provencher SW. Automatic quantitation of localized in vivo 1H spectra with LCModel. NMR Biomed. 2001; 14:260-264.
Figures
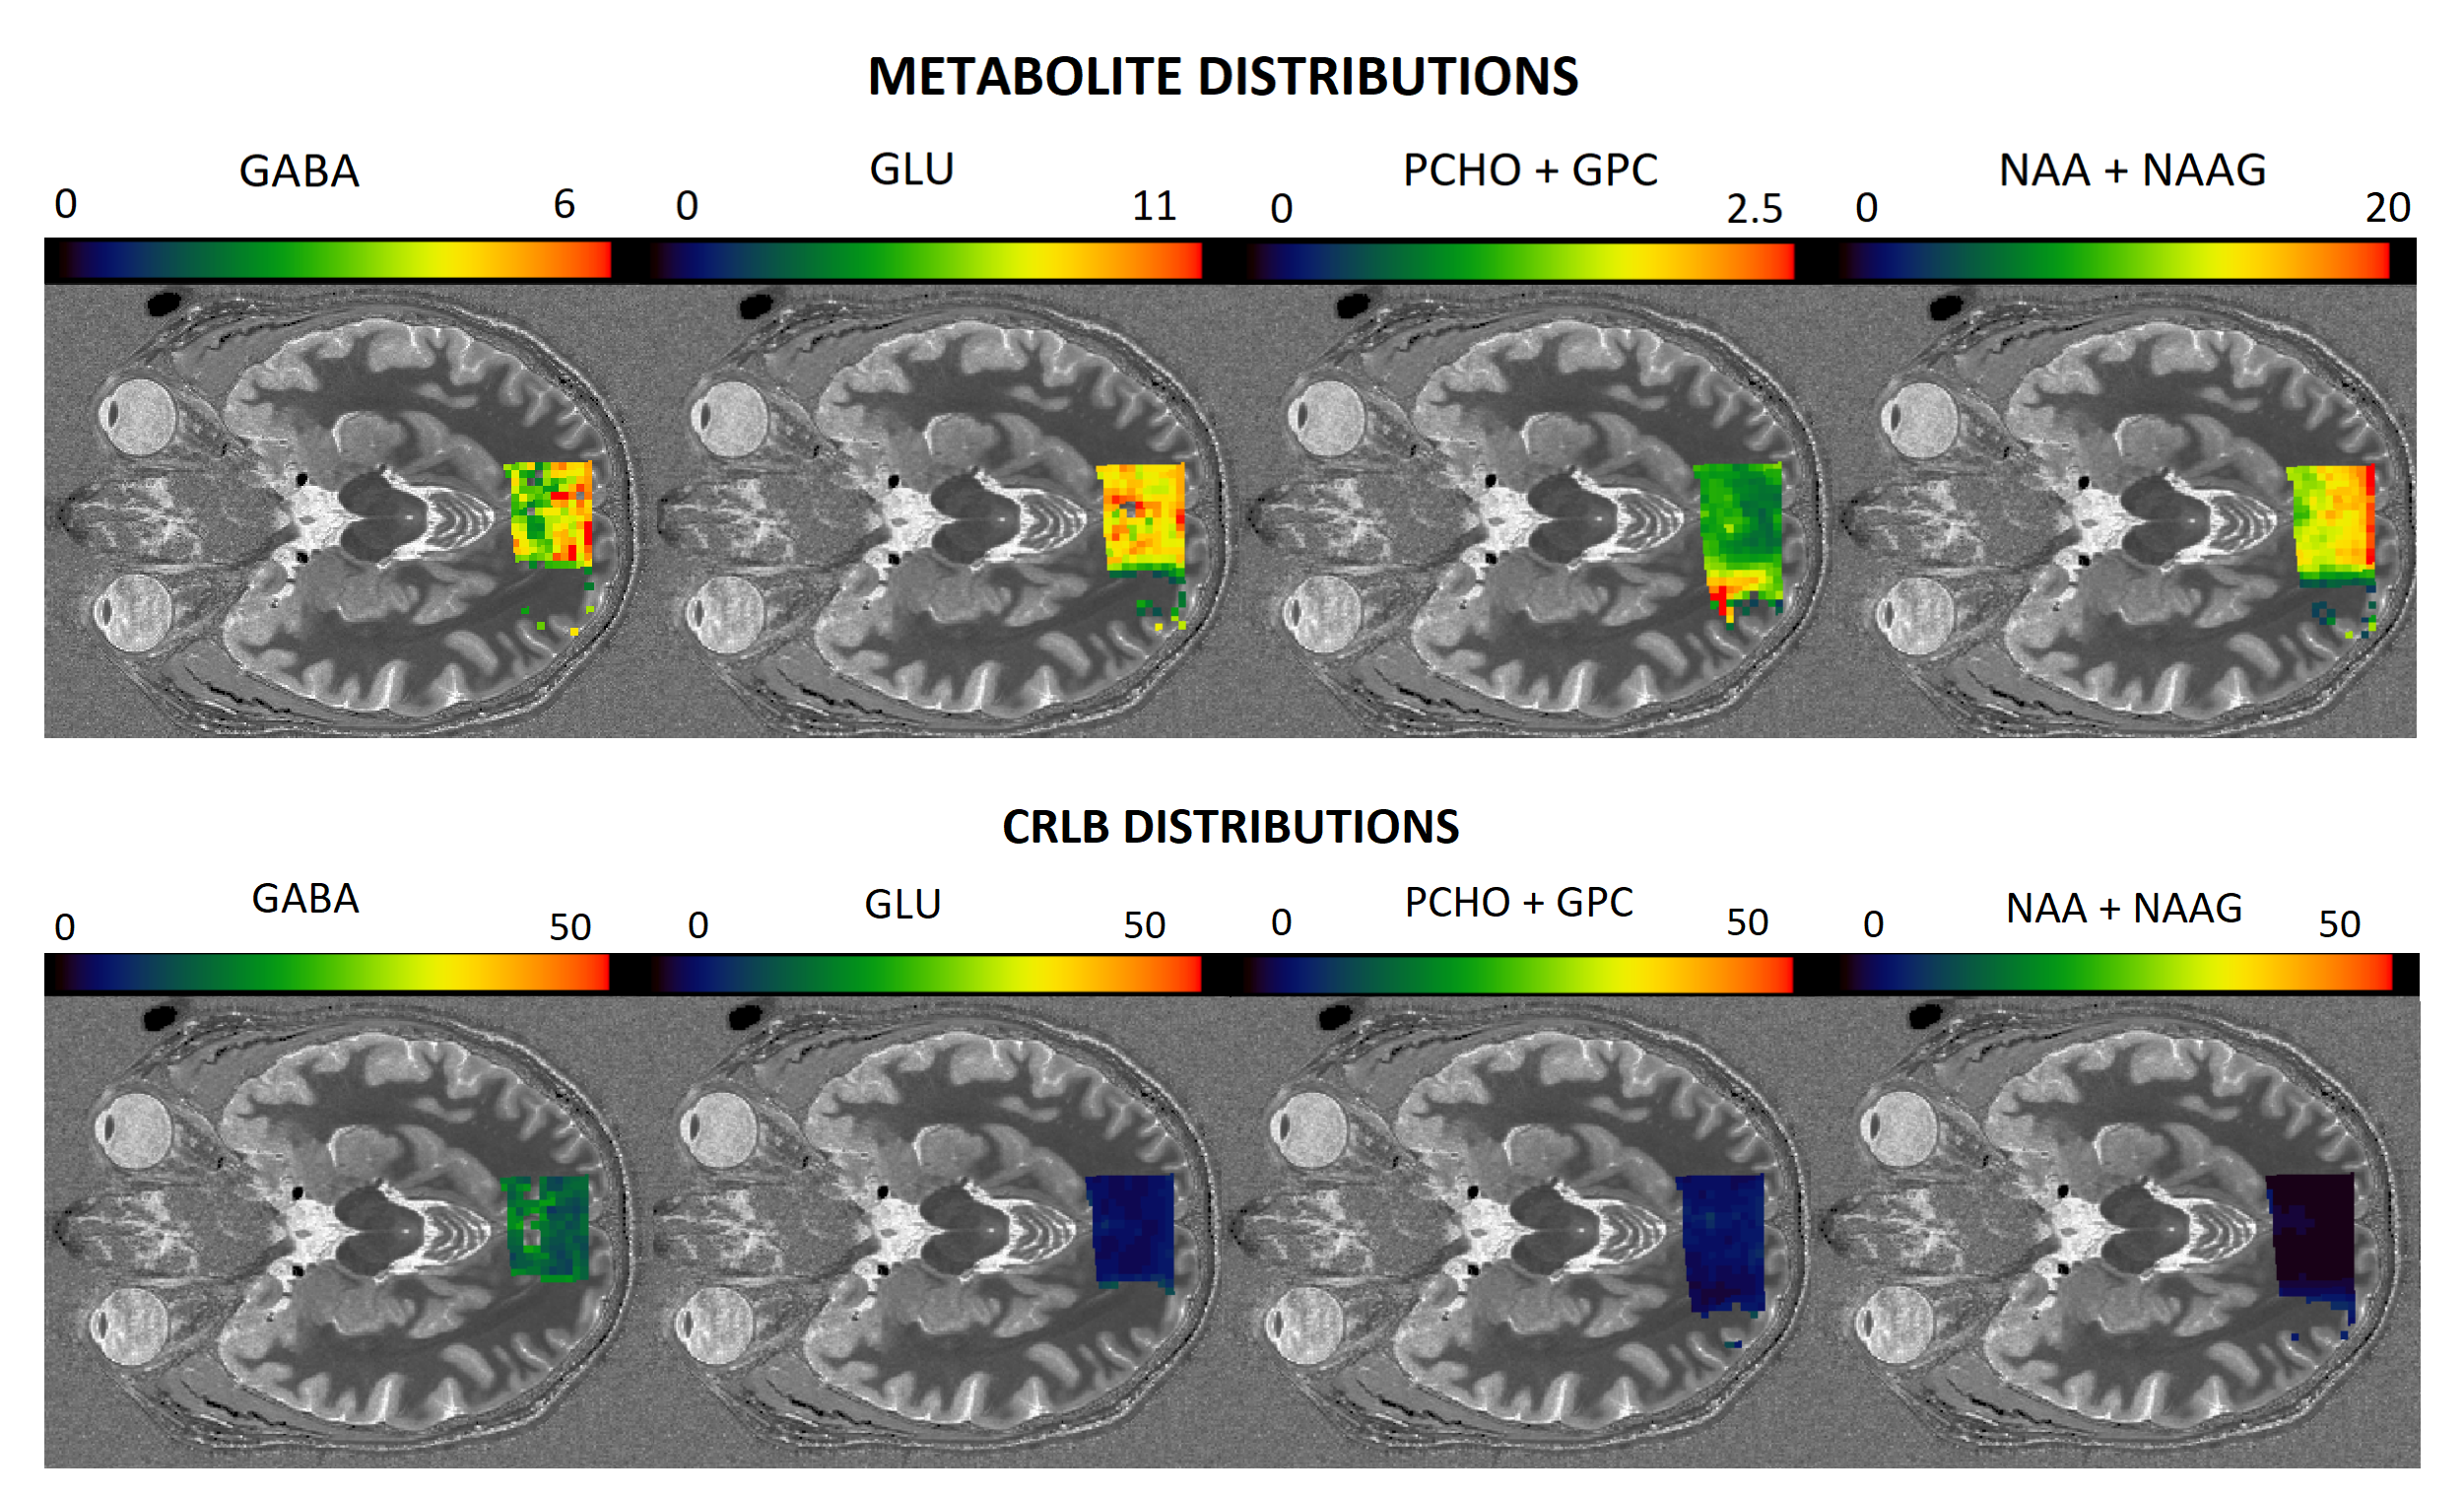
Figure 1. Concentration maps (relative to tCr) and CRLB maps for GABA, Glu, total NAA (NAA + NAAG) and total Cho (PCho + GPC) overlaid on anatomical images.
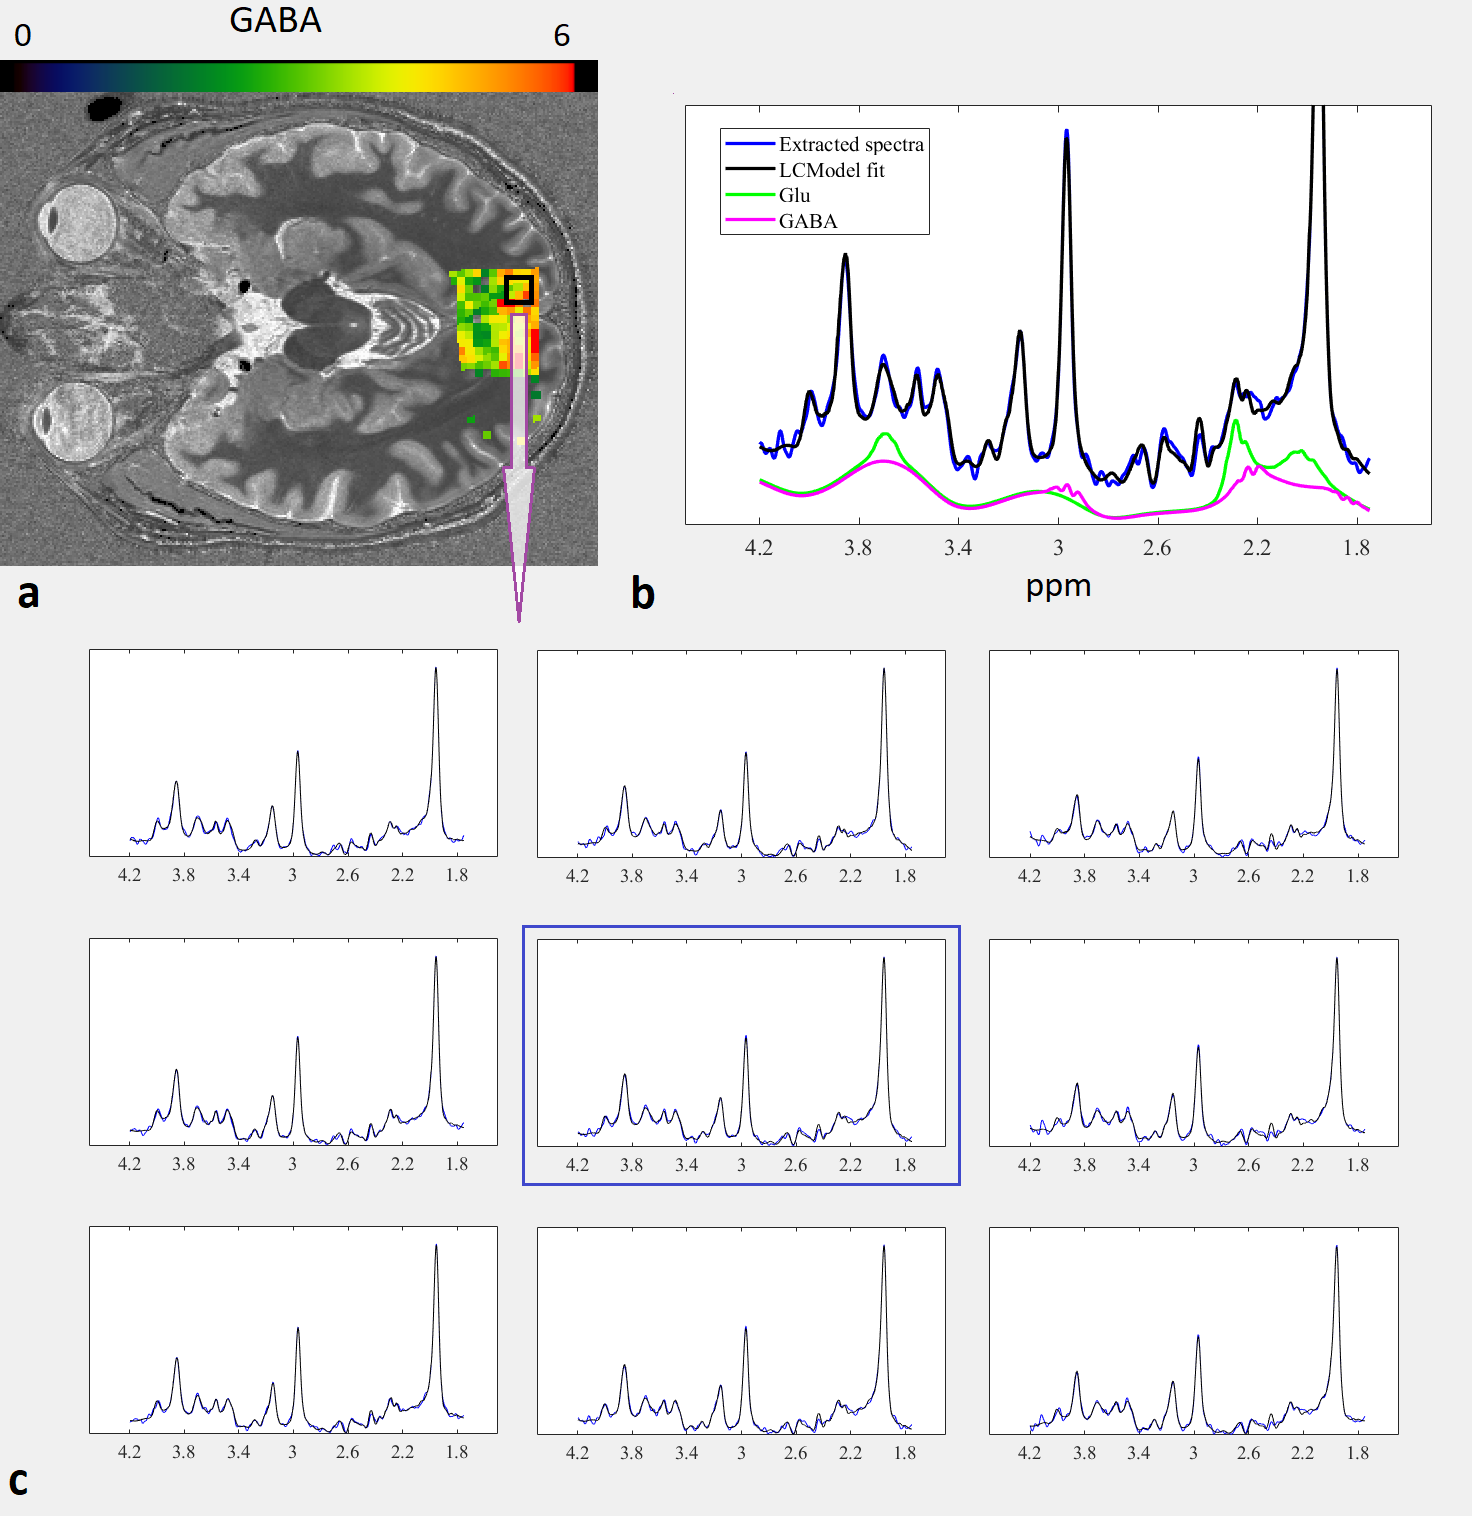
Figure 2. a. GABA concentration map (relative to tCr) overlaid on anatomical image. An ROI (black contour) is selected in the occipital lobe based on high GABA/tCr concentration and low CRLB. b. Sample spectrum from the center of ROI (in a) illustrating the quality of the data (blue) and LCModel fit (black). Individual fits for Glu (green) and GABA (magenta) are shown. c. Extracted spectra (blue) and LCModel fits (black) from 3x3 voxel grid (2.5 mm × 2.5 mm × 20 mm each) within the ROI.