3694
Compressed Sensing for MRSI with Concentric Ring Trajectories at 7 T
Bernhard Strasser1, Ovidiu C Andronesi2, Lukas Hingerl1, Stanislav Motyka1, Siegfried Trattnig1, Wolfgang Bogner1, and Antoine Klauser3
1Department of Biomedical Imaging and Image-guided Therapy, Medical University of Vienna, Vienna, Austria, 2Martinos Center for Biomedical Imaging, Massachusetts General Hospital, Charlestown, MA, United States, 3Department of Radiology and Medical Informatics, University of Geneva, Geneva, Switzerland
1Department of Biomedical Imaging and Image-guided Therapy, Medical University of Vienna, Vienna, Austria, 2Martinos Center for Biomedical Imaging, Massachusetts General Hospital, Charlestown, MA, United States, 3Department of Radiology and Medical Informatics, University of Geneva, Geneva, Switzerland
Synopsis
Keywords: Spectroscopy, New Trajectories & Spatial Encoding Methods
We show the feasibility of compressed sensing for MRSI using concentric ring trajectories. Four volunteers (three for 2D- and one for 3D-MRSI) were measured in about 9 minutes (2D-MRSI), and 14 minutes (3D-MRSI) using an FID-based MRSI sequence at 7 T. An iterative compressed sensing reconstruction including coil sensitivities and a total general variation spatial regularization was performed with retrospective undersampling factors of 1.5, 2.0 and 2.9. RMSE values were below 22 % and SSIM values above 0.8 for medium accelerations below 2.9 in the 2D case. The metabolic maps and spectra are similar to the gold standard without acceleration.INTRODUCTION
The clinical and neuroscientific usefulness of 1H-MRSI is held back by several problems, one of which is the long measurement time. Several acceleration methods have been proposed to overcome this limitation, such as parallel imaging, compressed sensing or spatio-spectral encoding. Spatio-spectral encoding, such as spirals, echo planar spectroscopic imaging, rosettes or concentric ring trajectories (CRT)1 can provide high acceleration factors. However, the measurement time of high-resolution MRSI at high field strengths can still be more than 15 minutes2, which is often considered too long for clinical routine. Therefore, in this study we test to combine 2D- and 3D-CRT with compressed sensing (CS).METHODS
2D CRT was measured in three volunteers at 7 T with the following parameters: TR 600 ms; TE 1.3 ms; 840 FID points; spatial resolution 3.4×3.4 mm²; FoV 220×220×12 mm³; 2778 Hz spectral bandwidth; up to 3 variable temporal interleaves (TI); 14 averages; measurement time 9:27 min:s. Volunteer 1 was only measured with 7 averages, resulting in 4:45 min:s measurement time. 3D CRT was additionally measured in volunteer 3 with the same parameters, except for: TR 450 ms, spatial resolution 3.4×3.4×3.4 mm³, FoV 220×220×133 mm³, slab thickness 50 mm, measurement time 14:18 min:s. The variable temporal interleaving means that the innermost 6 circles were measured with 1 TI and a spectral bandwidth per TI of 2778 Hz, the next 17 circles were measured with 2 TIs and a spectral bandwidth per TI of 2778/2 Hz = 1389 Hz, and the outermost 9 circles were measured with three TIs and a spectral bandwidth per TI of 2778/3 Hz = 926 Hz2. We used HSVD to partially remove water and lipid signal in k-space. Acceleration was simulated by retrospectively removing circles, but not removing circles below a certain radius (see figure 1). The undersampled data were iteratively reconstructed using a model including the coil sensitivity profiles, the non-Cartesian encoding and Total-Generalized-Variation spatial regularization. After that reconstruction, a L1-regularization was additionally performed to remove lipids from the brain. All reconstructed data were fitted with LCModel. We compared the CRLB's as reported by LCModel, and the relative RMSE, and the structural similarity index (SSIM) between the different accelerations.RESULTS
Figure 2 shows example spectra from the location shown by the red box in Figure 4. Figure 3 and 4 show the tCho and tNAA maps for the gold standard and three different acceleration factors, respectively. Figure 5 shows tNAA and tCho maps for the 3D measurement. Metabolic maps and spectra show high similarity to the ground truth for moderate acceleration (R≤2) in the 2D case, but visible differences at higher acceleration. The relative root-mean squared error (mean and std over volunteers) for the 2D results were 11.9±3.9 %, 14.4±3.8 %, 18.3±3.0 % for tCho, and 16.3±4.9 %, 21.6±9.1 %, 36±11 %, for tNAA and R=1.5, R=2.0 and R=2.9, respectively. The SSIM for tCho were 88.6±3.4 %, 85.5±3.4 %, 82.6±1.9 % and for tNAA 87.2±3.3 %, 85.2±2.1 %, 75.5±5.0 % for the same accelerations. The CRLB's were 11.1±4.6 %, 7.5±3.5 %, 8.8±2.5 %, 9.7±2.8 % for tCho and 11.0±5.1 %, 10.6±5.5 %, 10.0±5.5 %, 14±12 % for tNAA for the accelerations R=1.0, R=1.5, R=2.0, R=2.9, respectively.DISCUSSION
We have shown the feasibility of accelerating CRT-MRSI with CS for the first time. Higher accelerations (R≥2.9) for the 2D data led to deviations from the ground truth. It seems that SNR is not the main limitation for accelerating our CRT data, since the quality of datasets with different measurement times were similarly degrading with the same acceleration. This is also shown by the 3D dataset, as its measurement time was longer than in the 2D case, yet the results are worse for the same acceleration factors. We believe that residual nuisance signals are the cause of this issue, which has to be addressed in future work. Partial nuisance removal was necessary, as otherwise only the water and lipid signal could be reconstructed accurately, but not the metabolites.CONCLUSION
We have shown the feasibility of compressed sensing acceleration of 2D and 3D MRSI using a concentric ring trajectory for the first time. Nuisance signal removal is crucial for compressed sensing, as otherwise the nuisance signal dominates the signal, leading to incorrect reconstruction of metabolite signal.Acknowledgements
Austrian Science Fund (FWF): J4124-N36, I 6037-N.
NIH: R01CA211080 and R01CA255479.
References
1. Furuyama et al., Spectroscopic imaging using concentrically circular echo-planar trajectories invivo, MRM 2012, DOI: 10.1002/mrm.23184
2. Hingerl et al., Clinical High-Resolution 3D-MR Spectroscopic Imaging of the Human Brain at 7 T, Invest. Radiol. 2020, DOI: 10.1097/RLI.0000000000000626
Figures
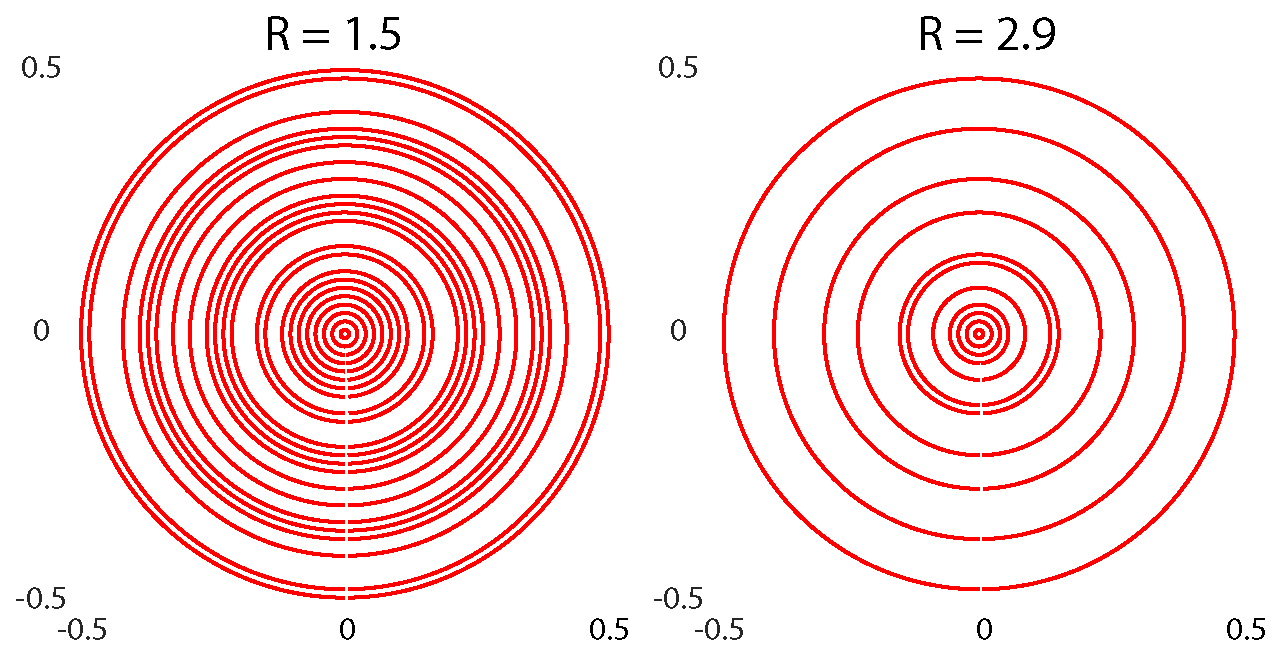
Examples
of undersampling
patterns for two accelerations, R = 1.5, and R = 2.9 for 2D-CRT.
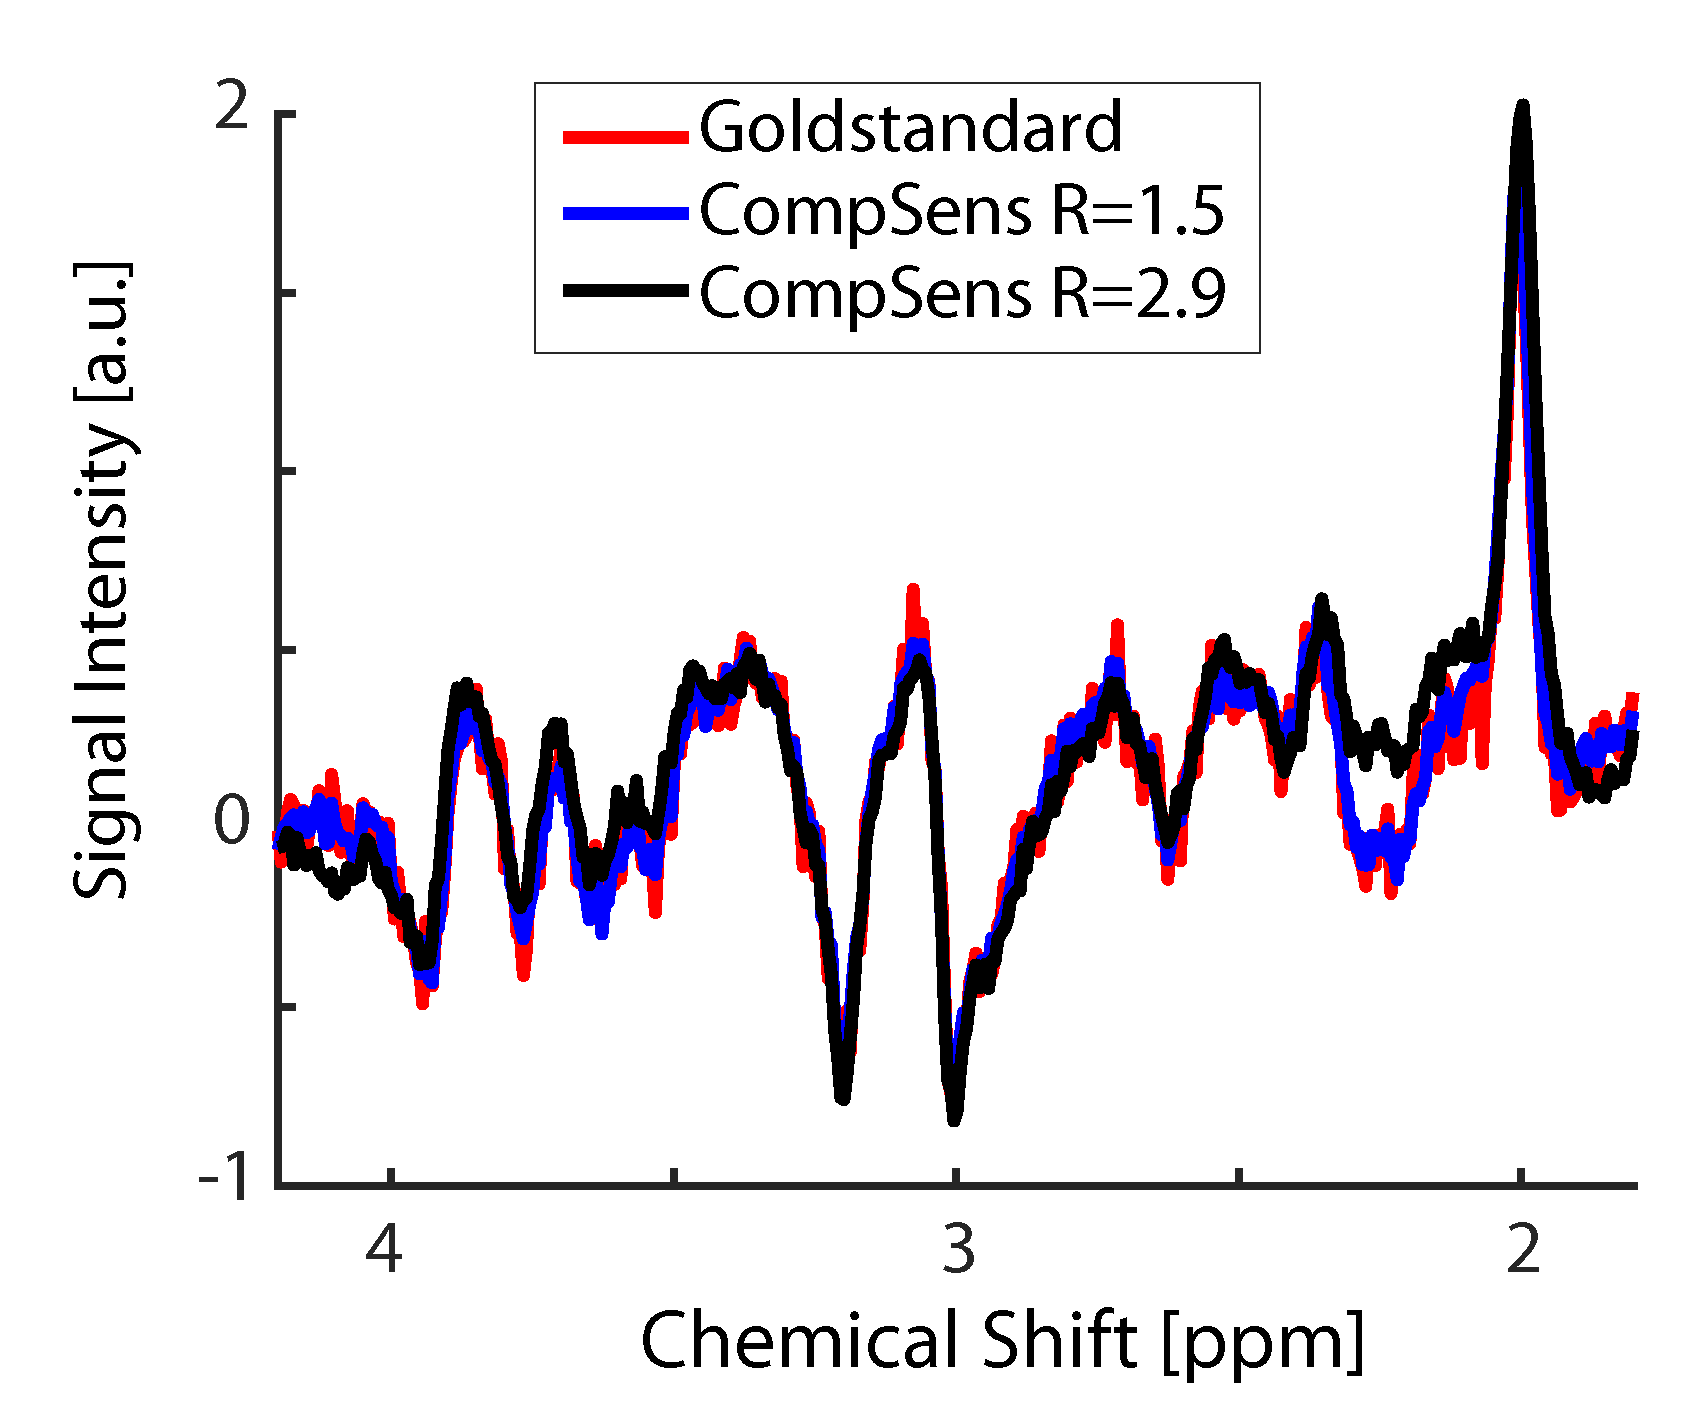
Spectra
for gold standard (red), R = 1.0, 2D-Compressed sensing with acceleration of R
= 1.5 (blue), and an acceleration of R = 2.9 (black). The spectra are from
volunteer #1, marked by the red box on the T1-weighted image of Fig. 4. The
spectrum for R = 1.5 looks very similar to the gold standard, while the high
acceleration spectrum slightly deviates from the gold standard in the NAA
region.
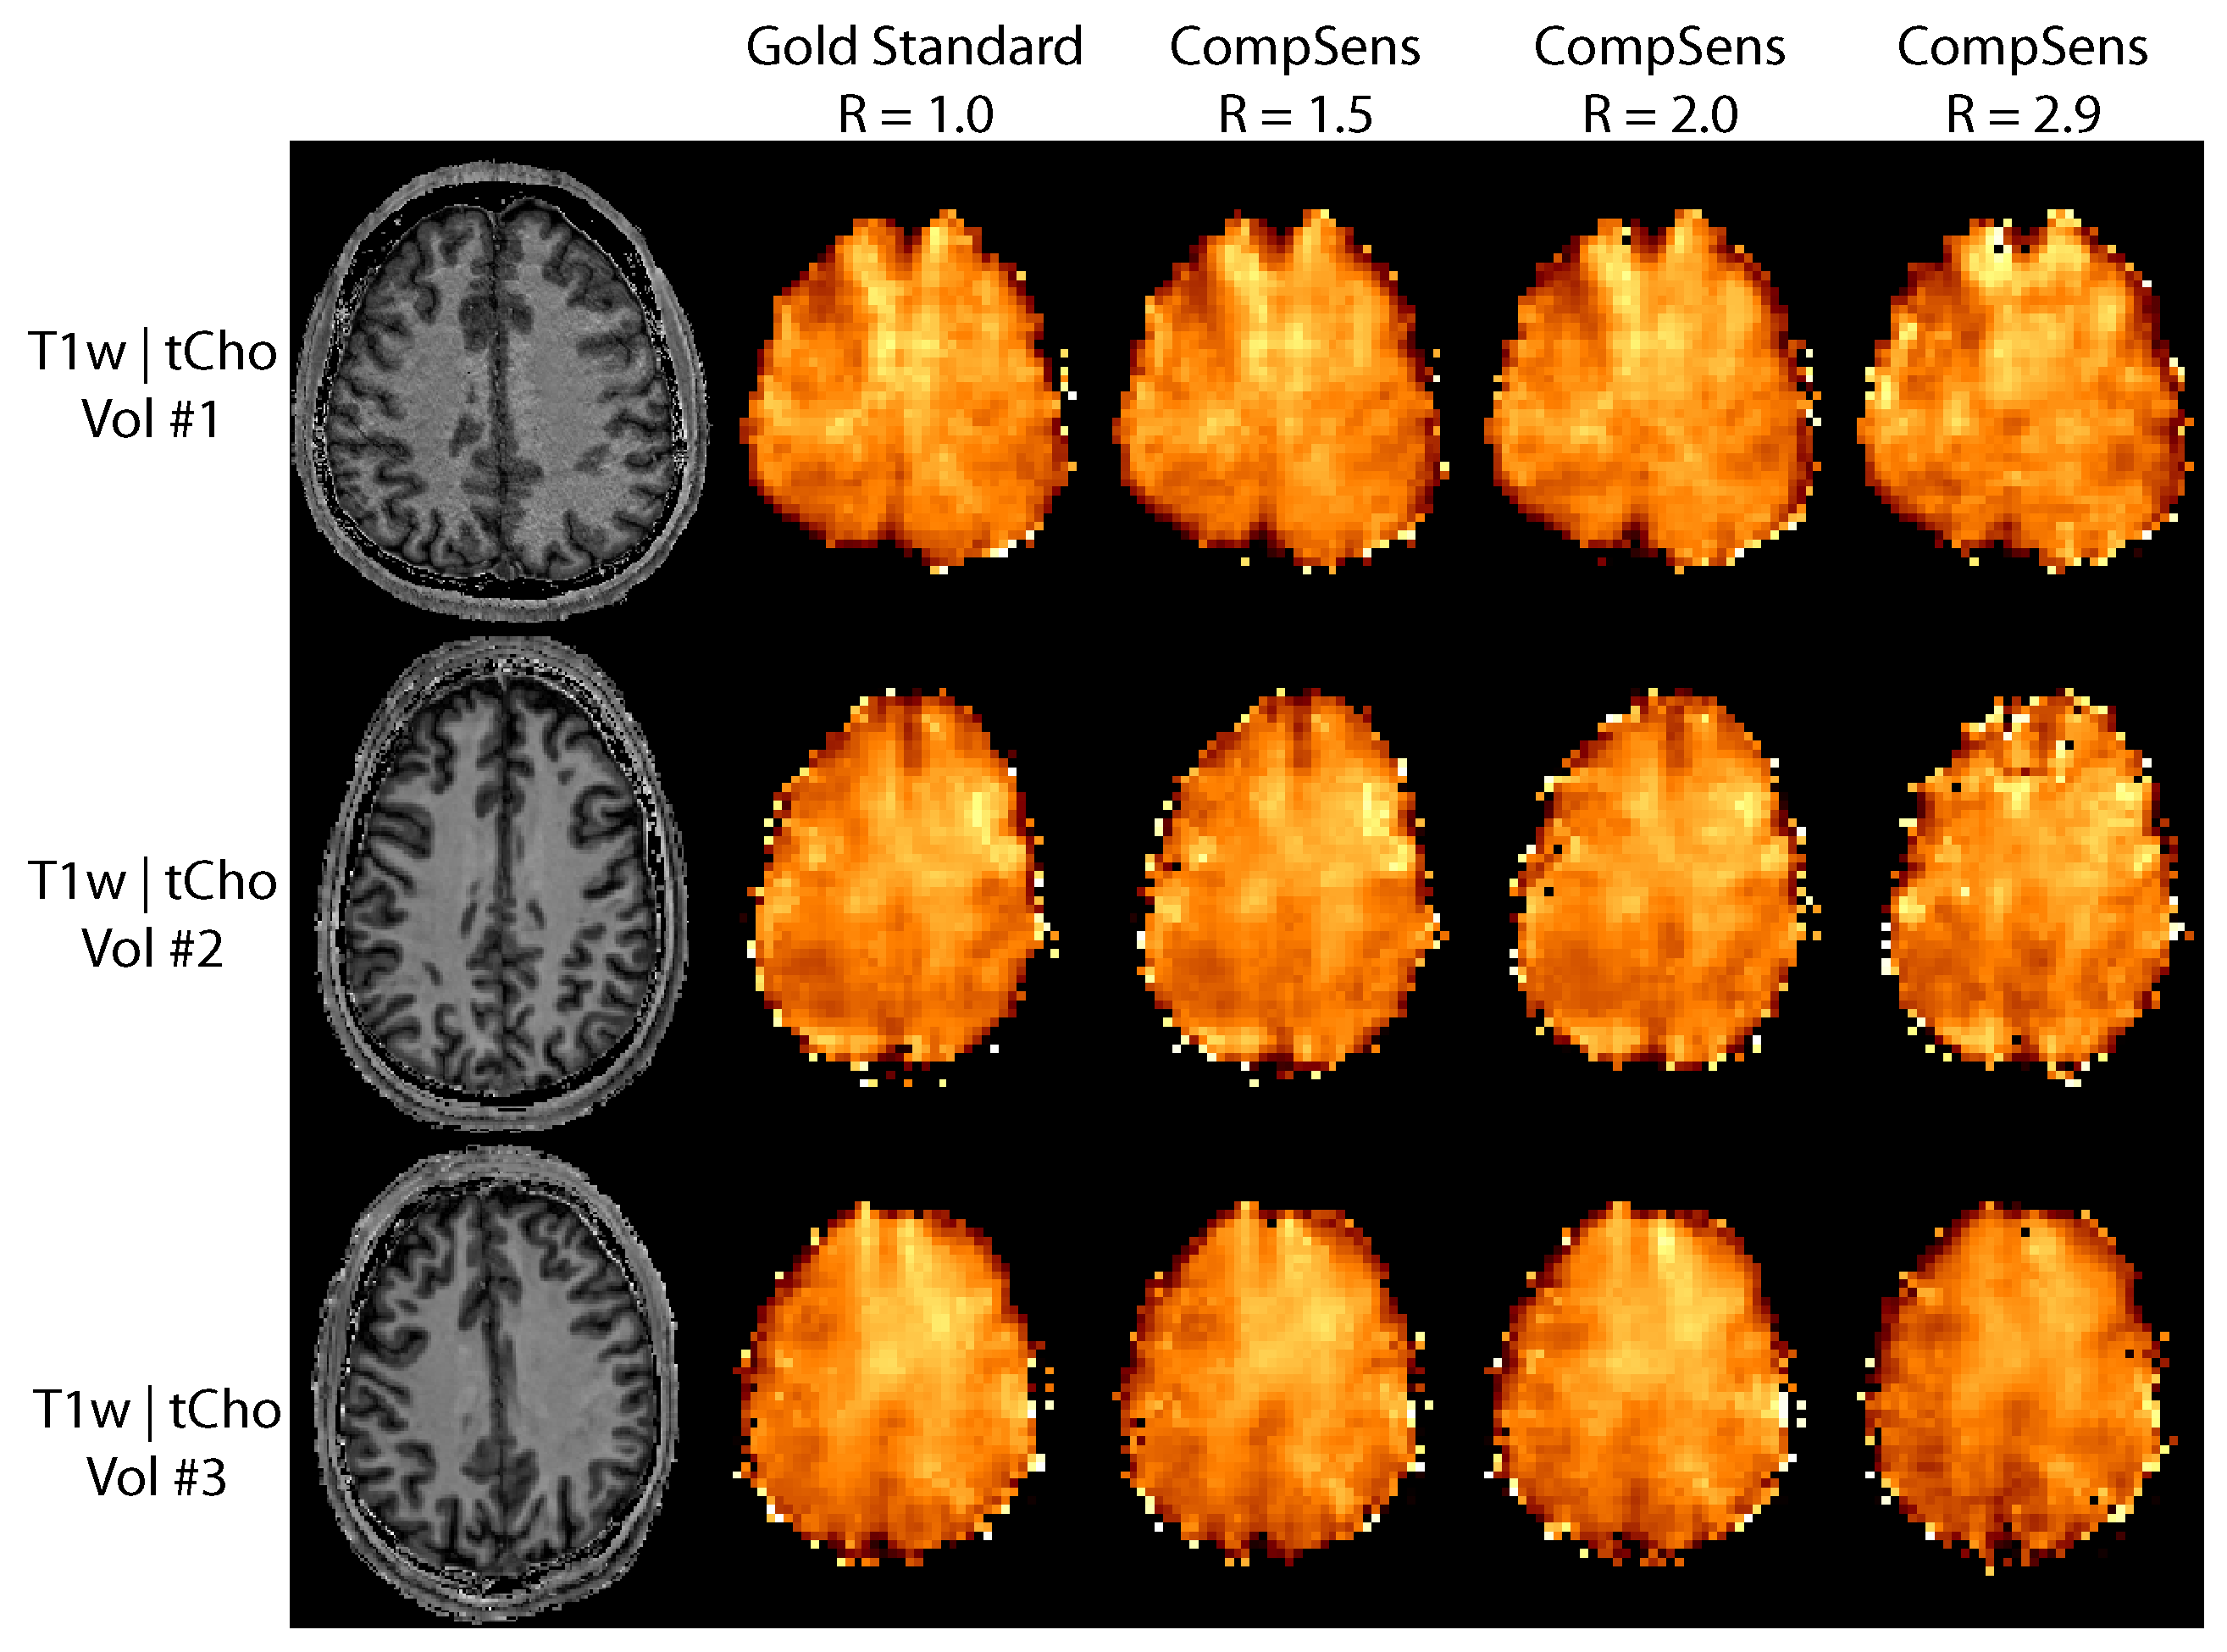
Total
choline maps for the gold standard and three different acceleration factors for
three volunteers measured with 2D-CRT. Clear
negative effects on the metabolic map appearance can be seen, especially for
the highest shown acceleration of R = 2.9. Since Vol #1
was measured with half the measurement time, this indicates that SNR is not the
issue with high accelerations, but rather remaining lipids or water signal.
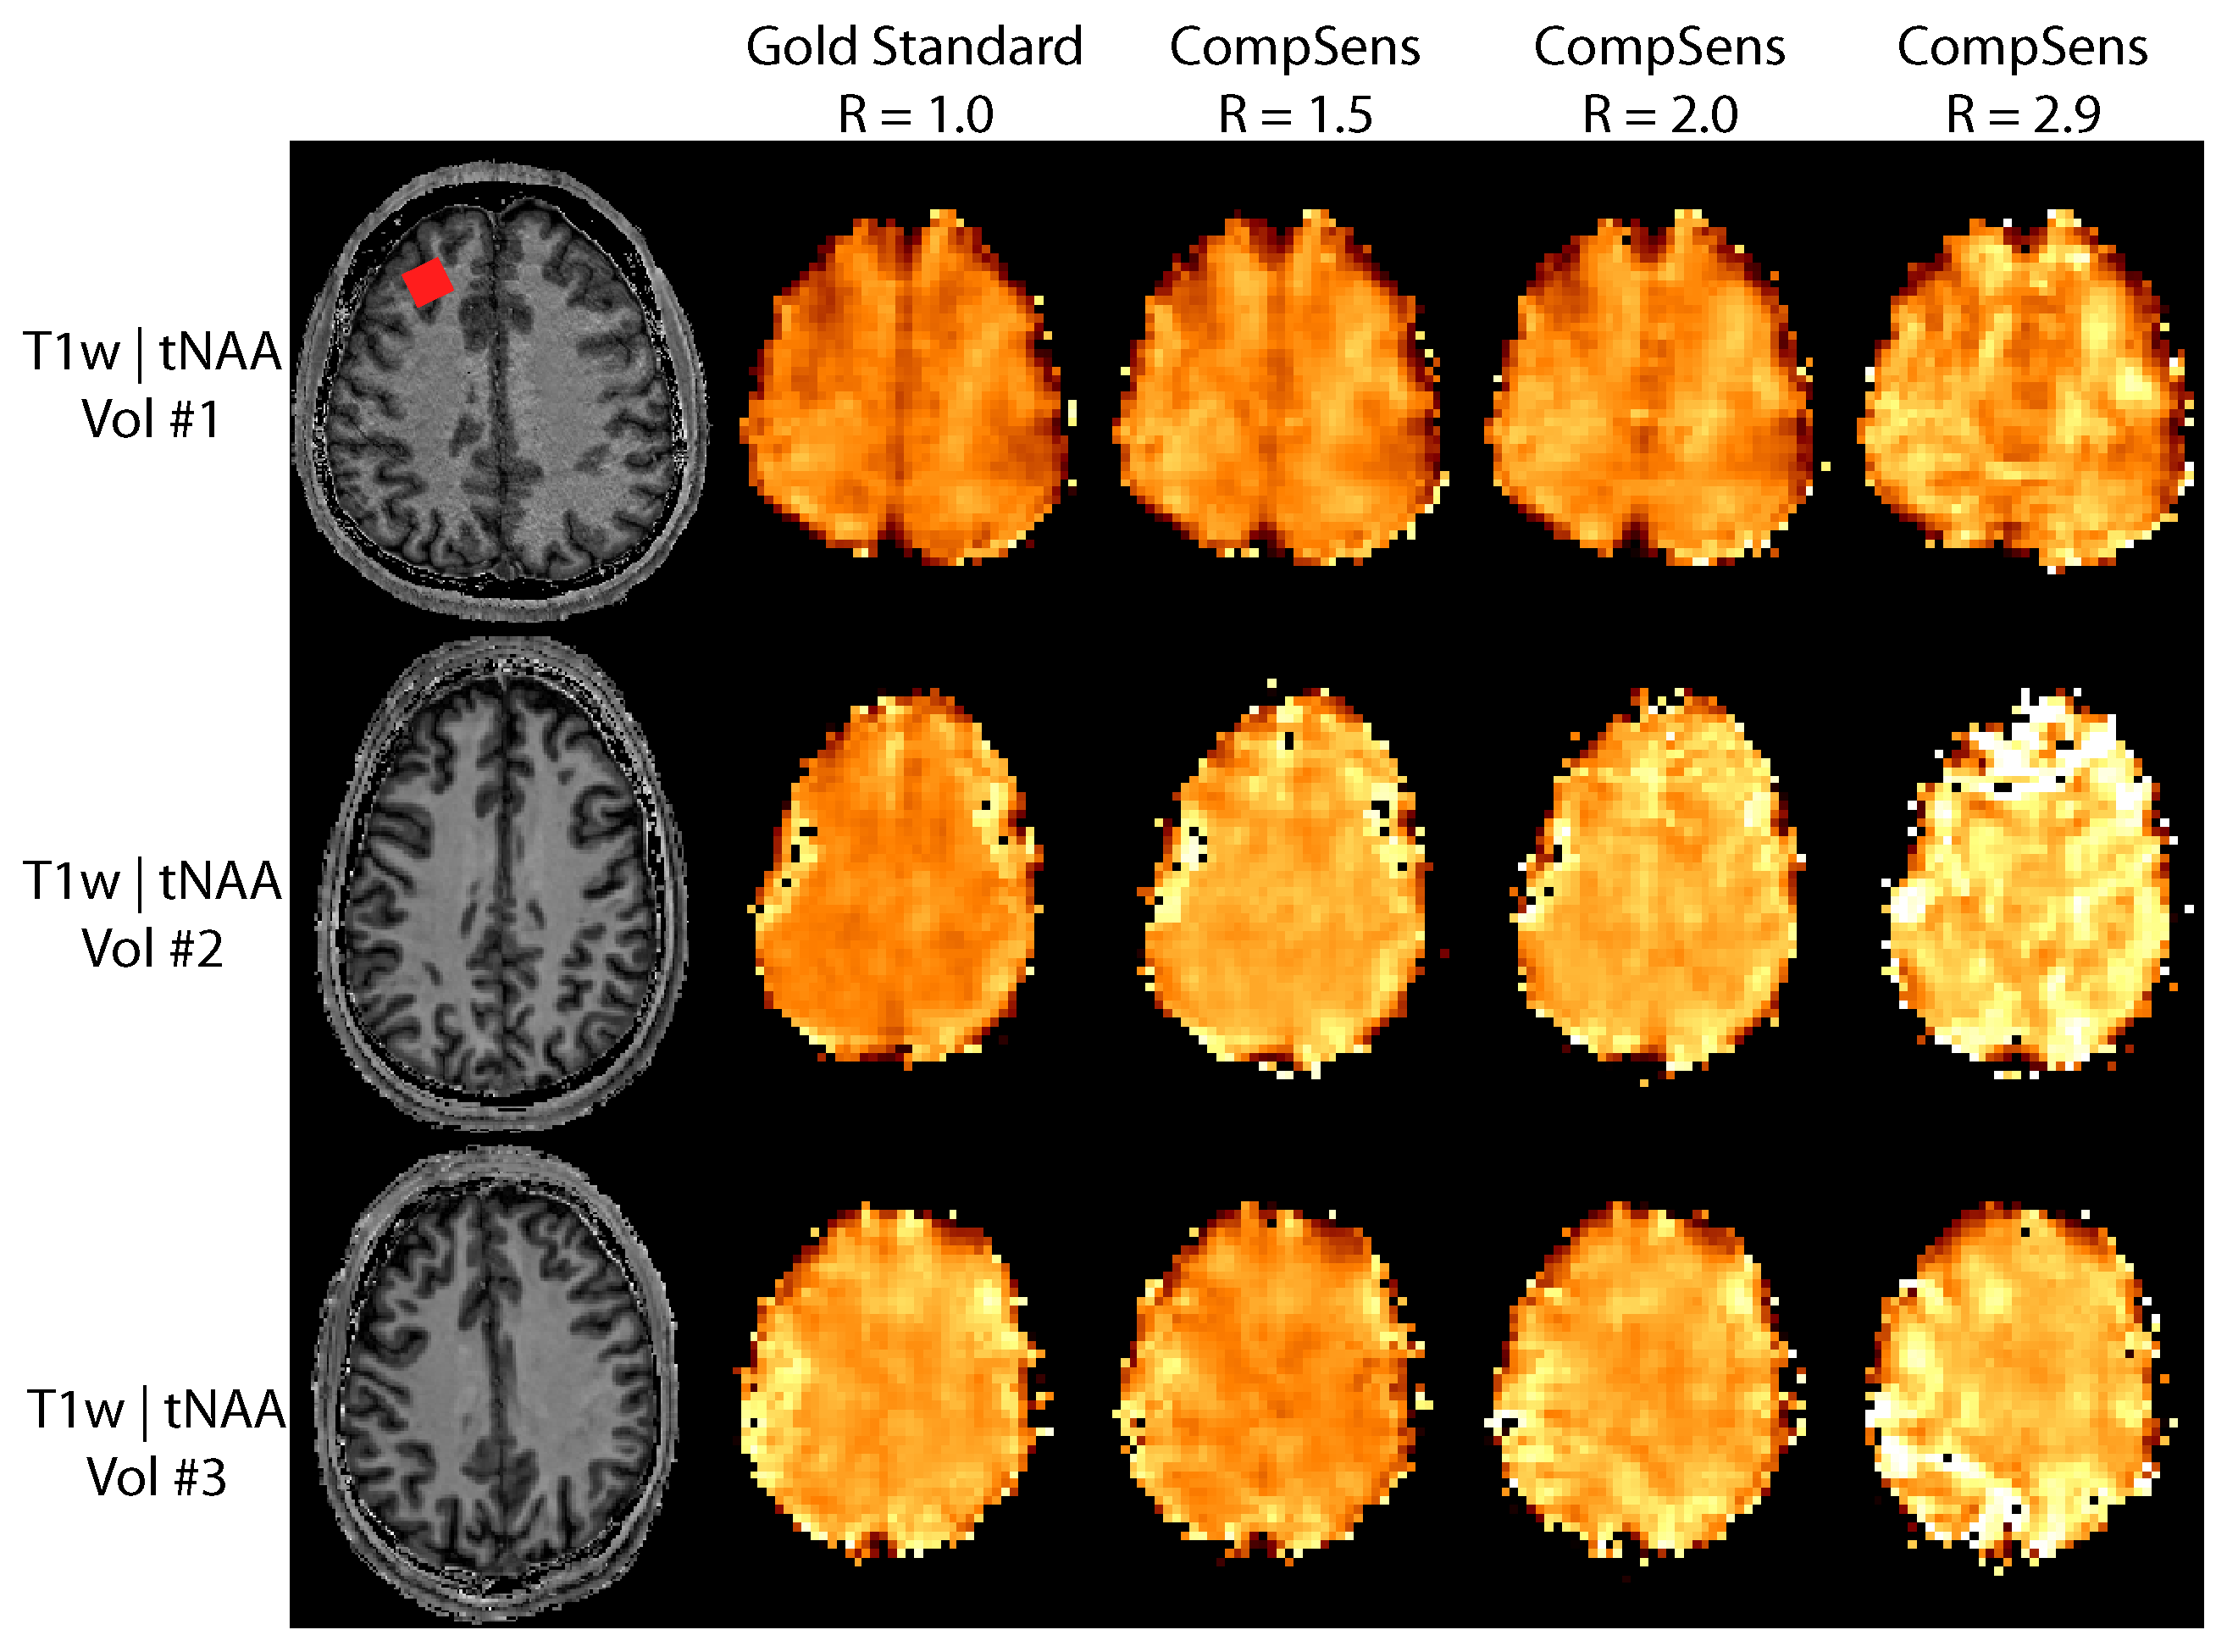
Total
NAA maps for the gold standard and three different acceleration factors for
three volunteers measured with 2D-CRT. tNAA is
especially susceptible to remaining
lipid artifacts, that fold into the brain not just because of the natural point
spread function due to limited k-space coverage, but also due to remaining
aliasing artifacts.
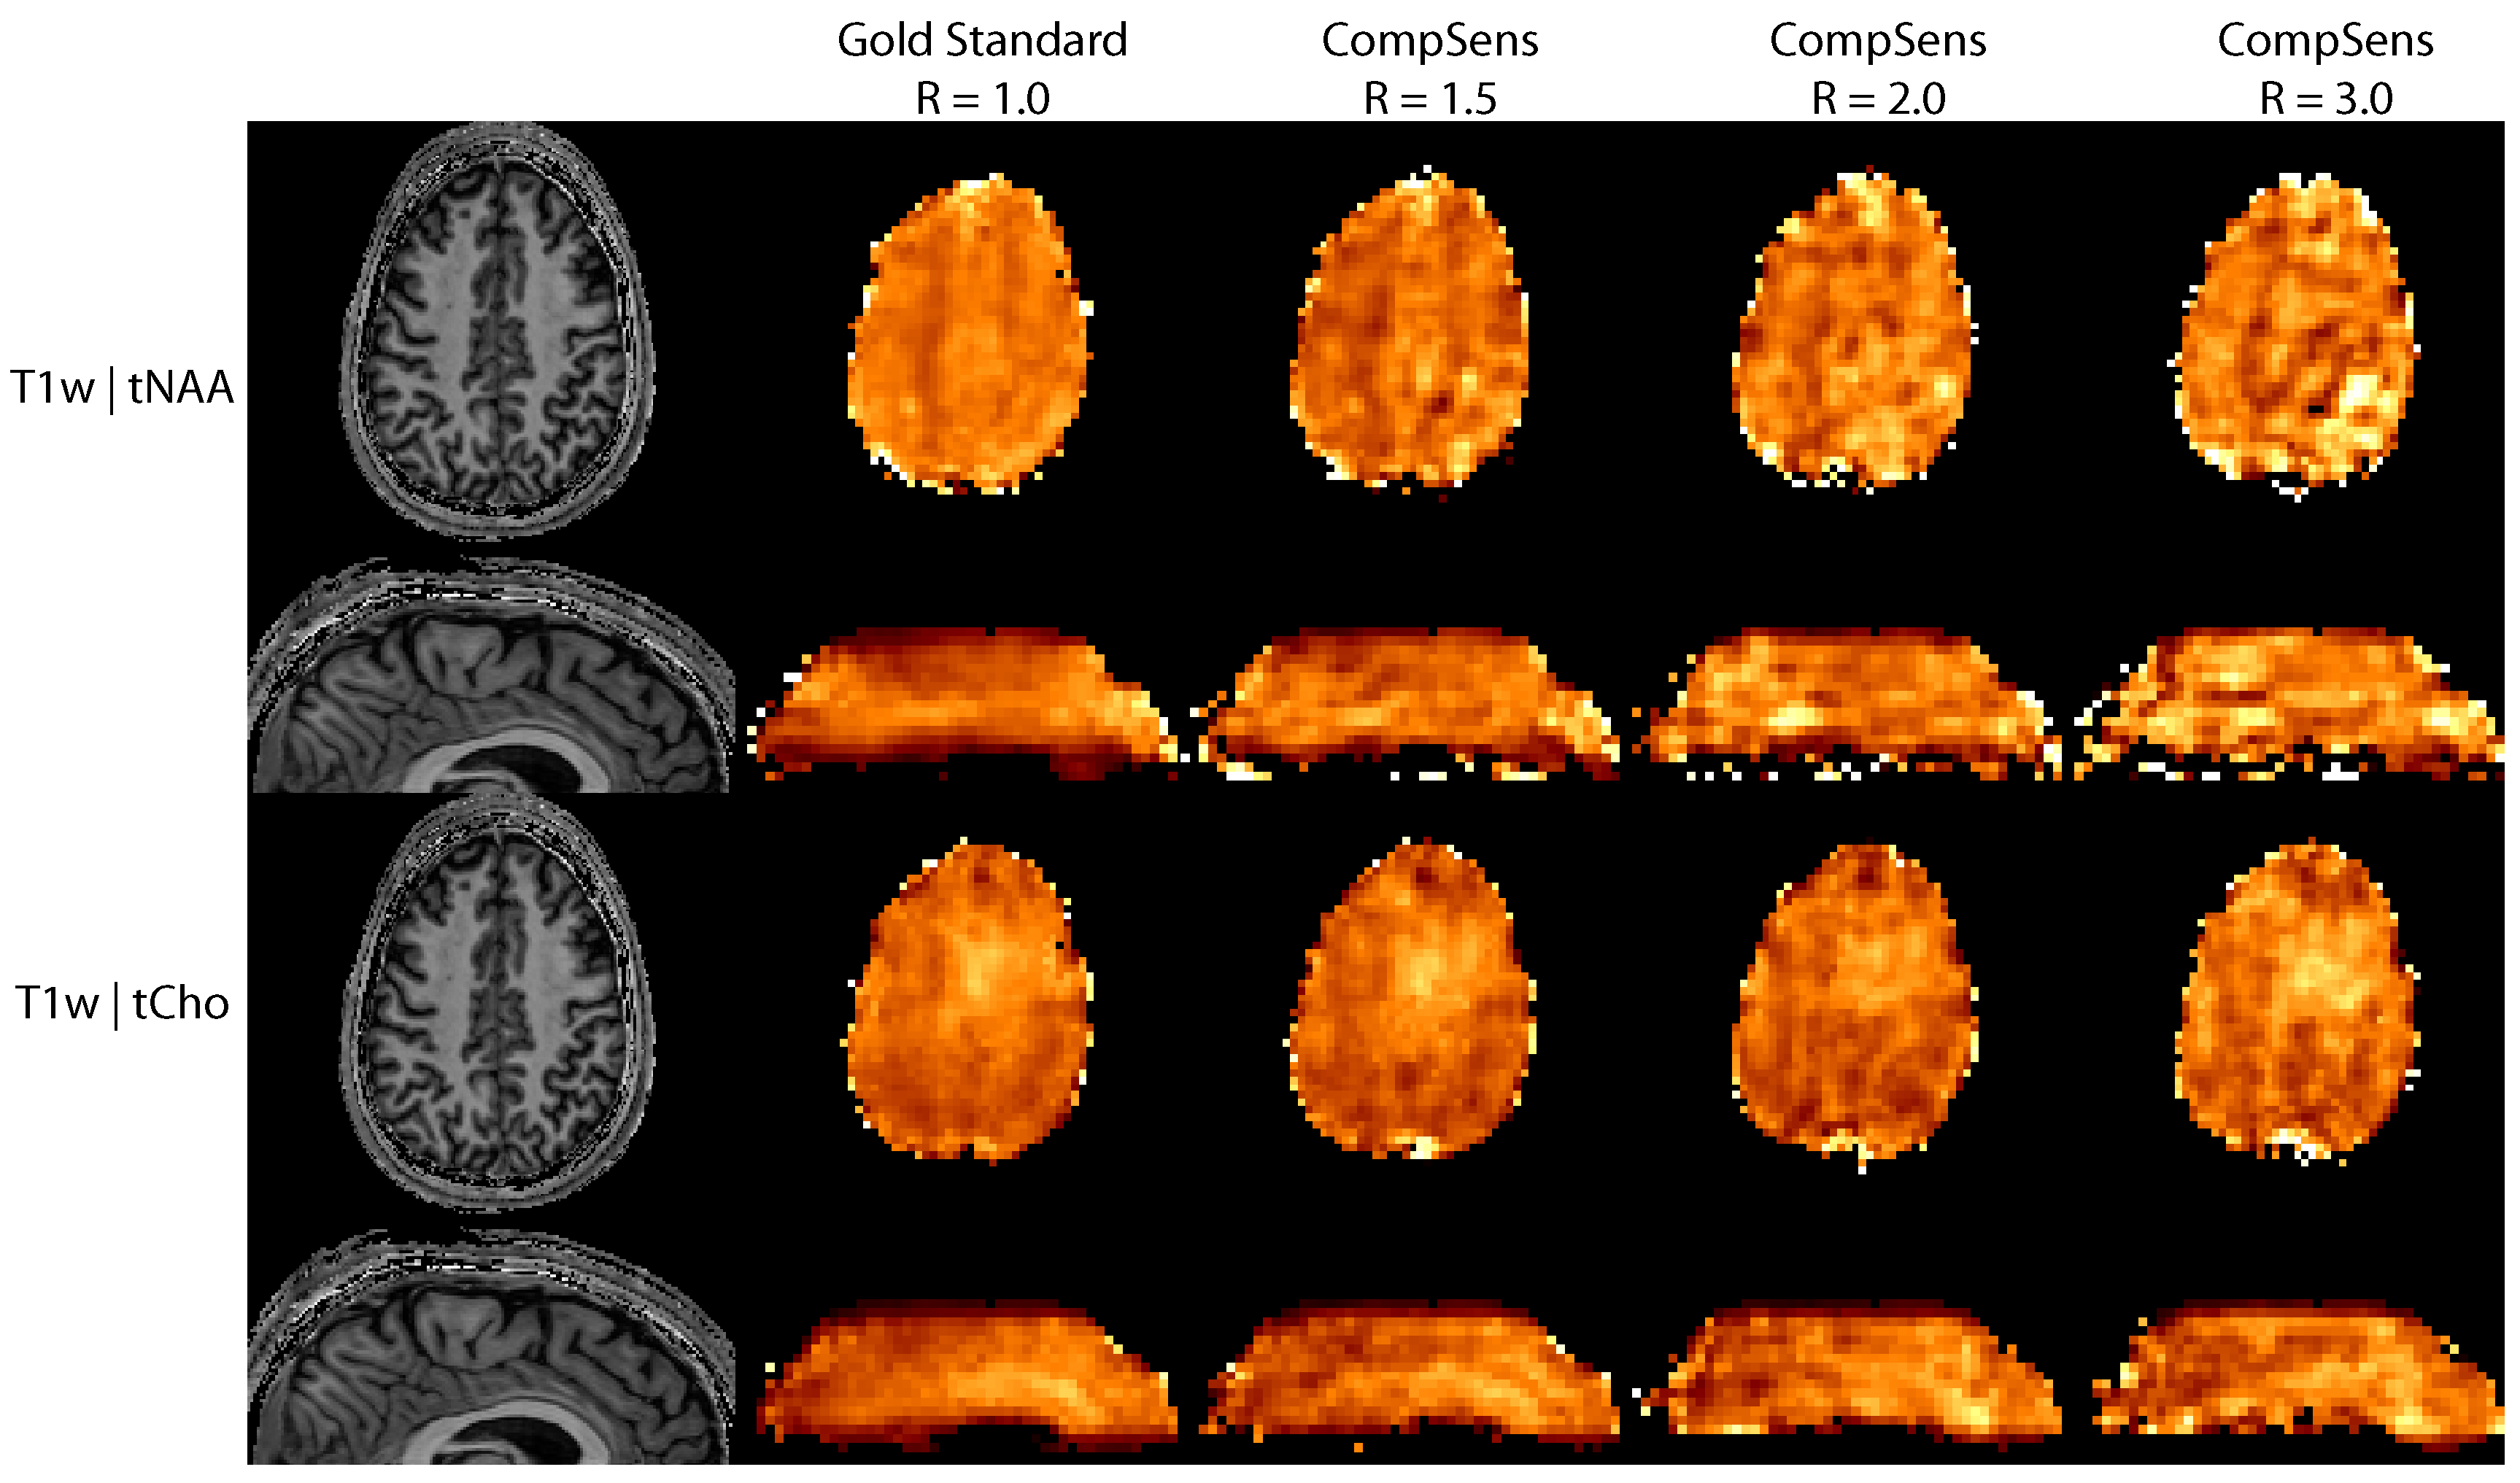
Total
NAA and total choline maps of the volunteer measured with 3D-CRT. The metabolic maps show a fast deterioration
with acceleration, especially tNAA.
Since the 3D measurement was longer than the 2D-measurement, this again shows
that SNR seems to be not the limiting factor for accelerationg
CRT sequences.
DOI: https://doi.org/10.58530/2023/3694