3693
3D High-Resolution T1 Mapping of Brain Metabolites1Beckman Institute for Advanced Science and Technology, University of Illinois at Urbana-Champaign, Urbana, IL, United States, 2Department of Electrical and Computer Engineering, University of Illinois at Urbana-Champaign, Urbana, IL, United States, 3Siemens Medical Solutions USA, Inc., Urbana, IL, United States, 4National Center for Supercomputing Applications, University of Illinois at Urbana-Champaign, Urbana, IL, United States, 5School of Biomedical Engineering, Shanghai Jiao Tong University, Shanghai, China
Synopsis
Keywords: Spectroscopy, Relaxometry
In MRSI studies, T1 values of metabolites are desirable for correcting relaxation and B1 inhomogeneity effects, and for evaluating microenvironmental changes in pathological conditions. Current metabolite T1 mapping has been limited to single-voxel or single-slice experiments due to SNR and imaging time constraints. In this work, we demonstrated the feasibility of 3D high-resolution T1 mapping of brain metabolites using a novel data acquisition and processing method featuring physics-based low-rank tensor modelling and FID acquisitions. The proposed method has been validated using phantom and in vivo data, producing encouraging results.
Introduction
In MRSI experiments with short TRs, T1 values of metabolites are needed for correction of T1 relaxation and B1 inhomogeneity effects, and for optimization of scan parameters.1-4 Metabolite T1 values may also provide useful information about the microenvironment in pathological conditions.5,6 However, due to the high dimensionality of the imaging problem associated with metabolite T1 mapping and low SNR of metabolite signals, current studies have been limited to single-voxel1-6 or single-slice7-9 experiments.In this work we propose a new method for 3D high-resolution T1 mapping of metabolites using fast FID acquisitions with variable flip angles and physics-based low-rank tensor modelling. The low-rank tensor model with pre-learned subspaces significantly reduced the degrees-of-freedom of the underlying imaging problem, enabling T1 mapping of brain metabolites at 2.0×3.0×3.0 mm3 resolution in a 34-min scan. The proposed method has been validated using phantom and in vivo experimental data, producing high-quality and reproducible results.
Methods
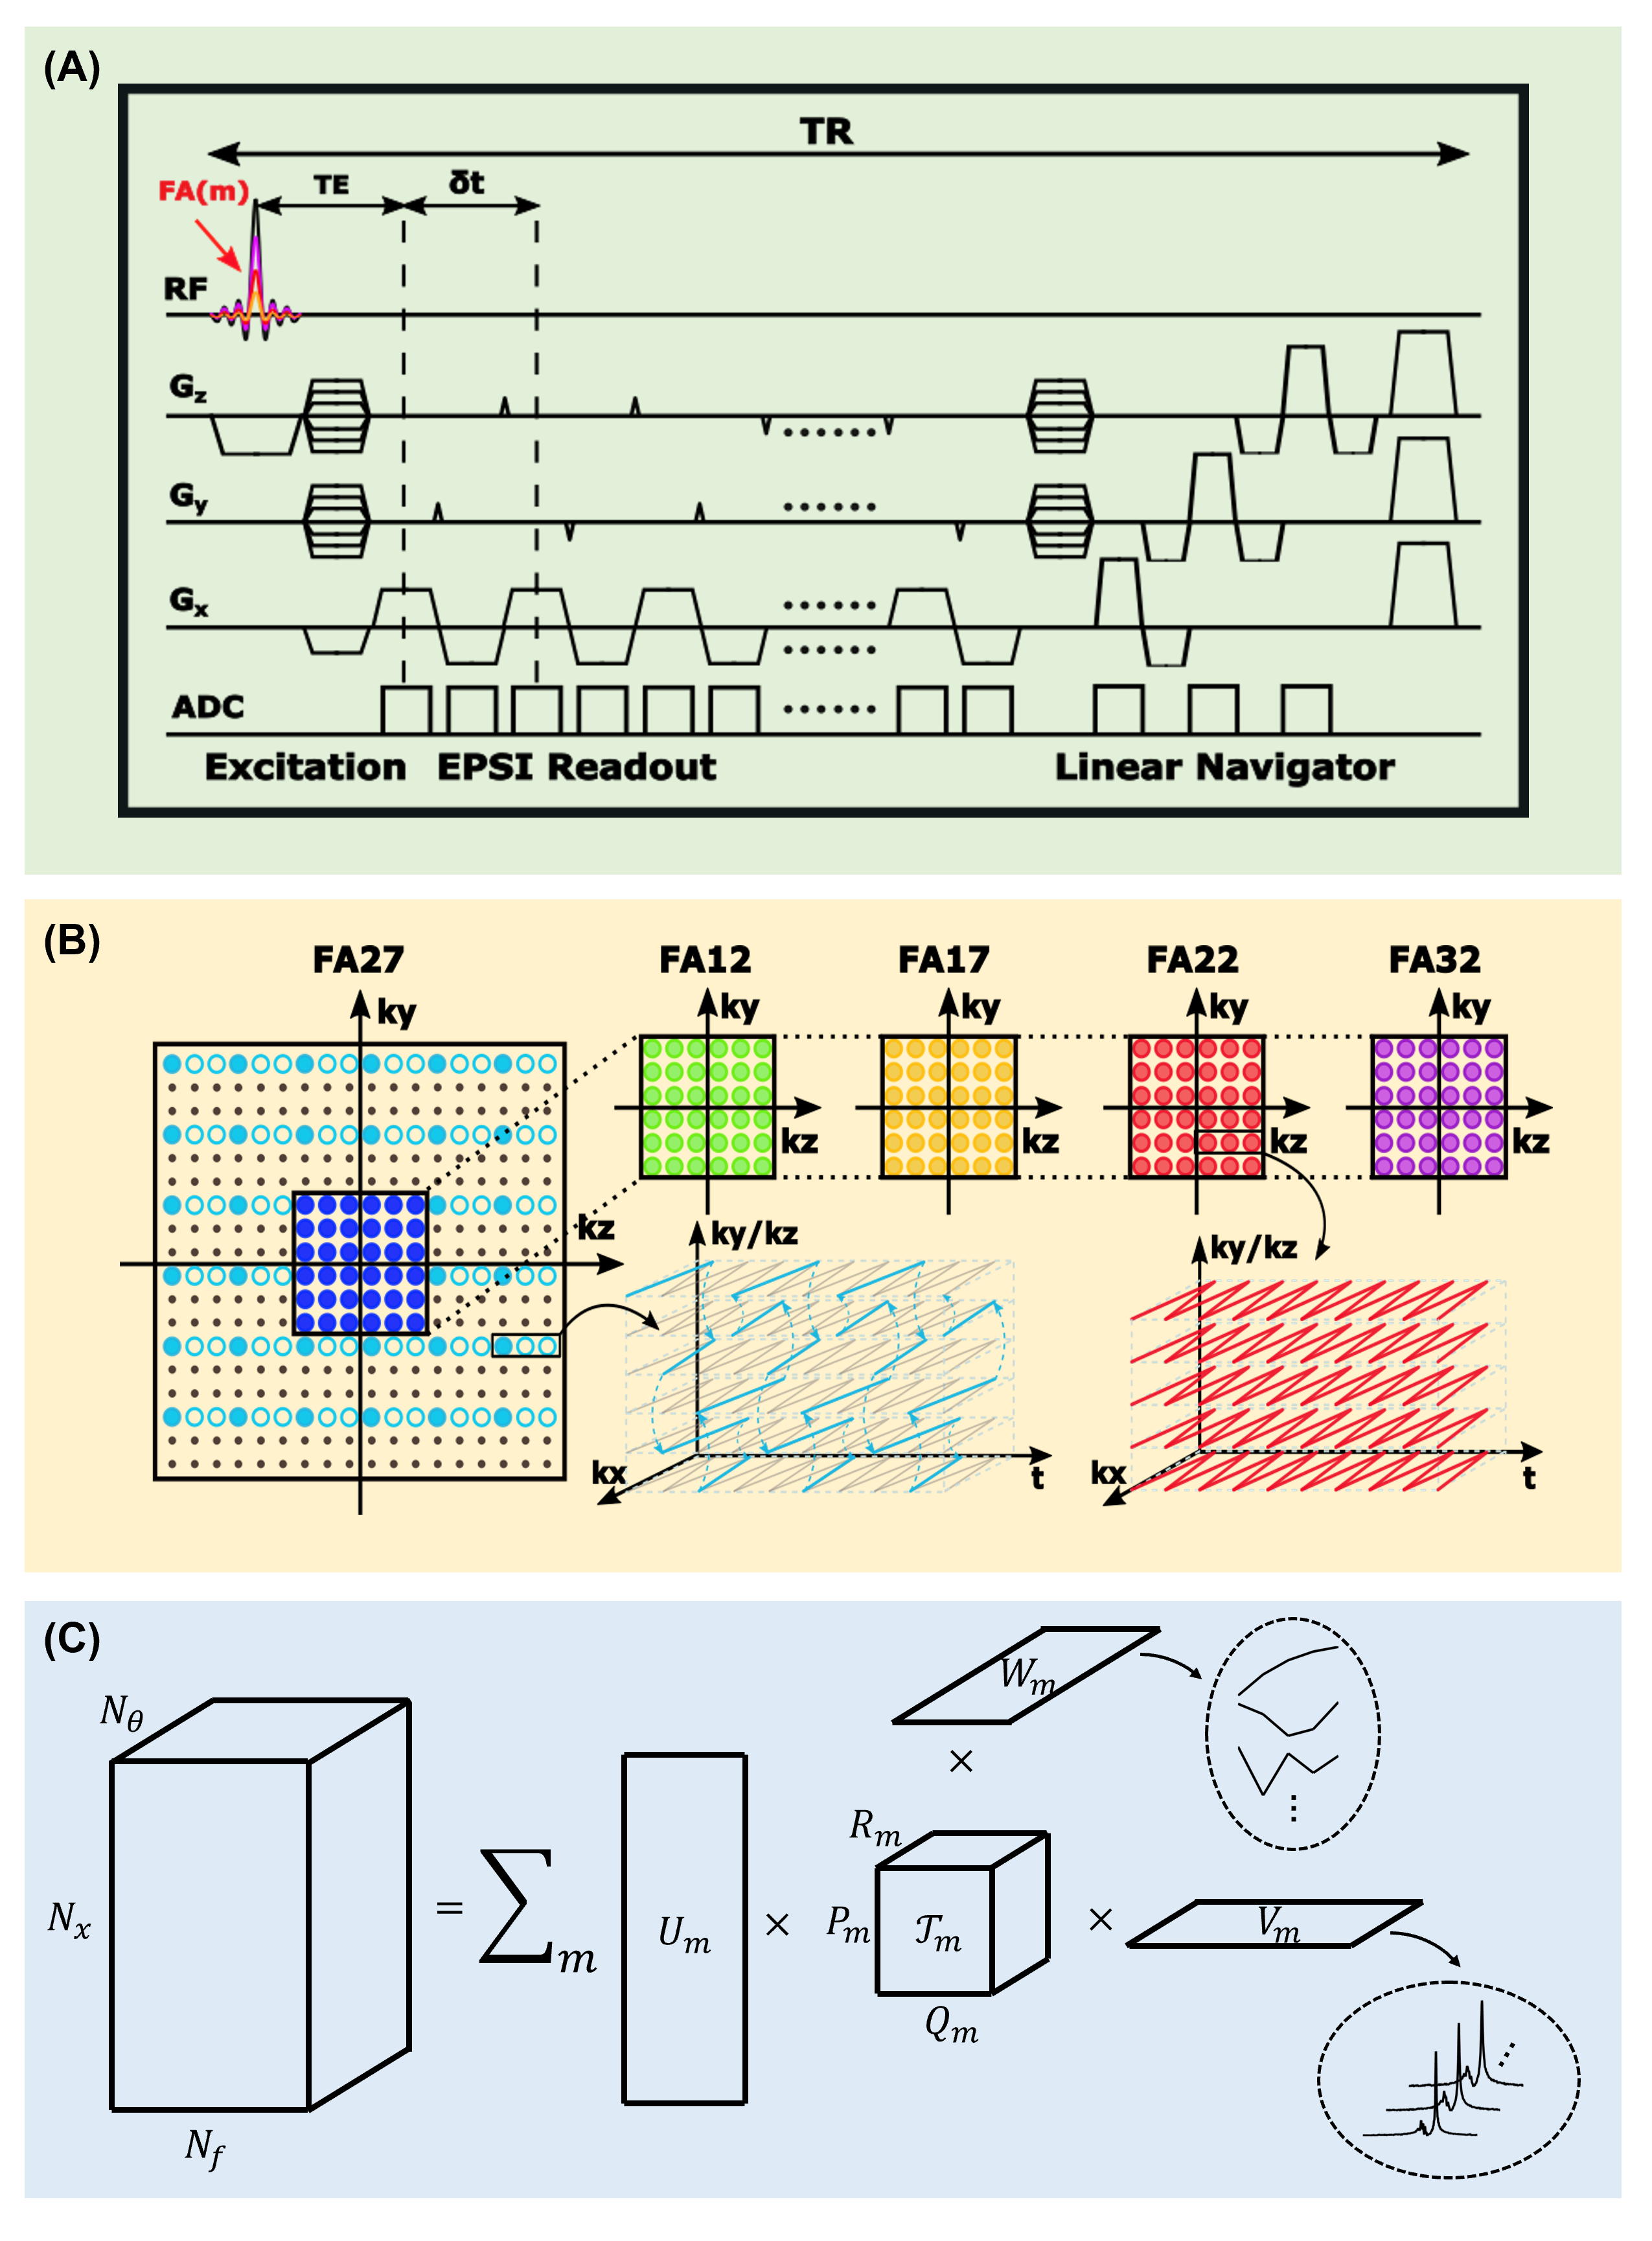
Image modelWe represented the desired variable-flip-angle spectroscopic signal $$$\rho(\boldsymbol{x},f,\theta)$$$ using the following union-of-low-rank-tensors model10-13:
$$\rho(\boldsymbol{x},f,\theta)=\sum_{m=1}^{M}\left[\sum_{p=1}^{P_m}\sum_{q=1}^{Q_m}\sum_{r=1}^{R_m}t_{m,p,q,r}u_{m,p}(\boldsymbol{x})v_{m,q}(f)w_{m,r}(\theta)\right],$$
where $$$t_{m,p,q,r}$$$ is the core tensor, $$$v_{m,q}(f)$$$ the spectral basis function, $$$w_{m,r}(\theta)$$$ the flip-angle basis function, and $$$u_{m,p}(\boldsymbol{x})$$$ the spatial coefficient for the $$$m$$$th metabolite, respectively. In the model, the spatial-spectral-flip-angle distribution of each molecule was represented as a low-rank tensor. This model not only provided a significant reduction in the degrees-of-freedom for the underlying imaging problem, but also facilitated efficient incorporation of physics-based prior information in the form of pre-learned spectral and flip-angle subspaces.
Data acquisition
Leveraging the union-of-low-rank-tensors model, an accelerated 3D MRSI acquisition scheme was proposed. The data acquisition scheme, illustrated in Figure 1, has the following key features: (a) short-TR (160 ms) and ultra-short-TE (1.6 ms) FID-MRSI acquisition without water and lipid suppression, (b) extended EPSI readout with blipped phase encodings for high spatial resolution, and (c) variable flip angles (12/17/22/27/32⁰) to encode T1 information. Elimination of water suppression pulses made it possible to monitor field drift and subject motion during the scan, and provided companion variable-flip-angle water signals for B1 inhomogeneity correction. This scheme offered high efficiency for data acquisition, enabling the acquisition of 3D high-resolution metabolite T1 mapping signals (240×240×72 mm3 FOV, 2.0×3.0×3.0 mm3 resolution) in a 34-min scan. As a comparison, it would take more than six hours for the state-of-the-art methods to achieve the same spatial coverage with even lower spatial resolution.
Image reconstruction
Reconstruction of the spatial-spectral-flip-angle function was accomplished based on the proposed union-of-low-rank-tensors model in two key steps: (a) learning spectral and flip-angle subspaces, (b) estimating core tensor and spatial coefficients.
First, the spectral dictionary for each molecule was generated by integrating quantum mechanical simulation with empirical spectral parameter distributions from training data14,15:
$$s_m(f)=\int_{-\infty}^{\infty}\!\left[c_m\cdot\phi_m(t)\cdot e^{-t/T_{2,m}^*}\cdot h(t)\right]e^{-i2\pi ft}\,\mathrm{d}t,$$
and the flip-angle dictionary was generated according to the Bloch equation given a set of feasible metabolite T1 values $$$T_{1,m}$$$ and B1+ inhomogeneities $$$k$$$16,17:
$$f_m(\theta)=a_m\cdot\frac{1-e^{-\mathrm{TR}/T_{1,m}}}{1-\cos(k\cdot\theta)\cdot e^{-\mathrm{TR}/T_{1,m}}}\cdot\sin(k\cdot\theta).$$
The spectral and flip-angle subspaces, $$$\hat{v}_{m,q}(f)$$$ and $$$\hat{w}_{m,r}(\theta)$$$, were then generated from the corresponding dictionaries through singular value decomposition.
Second, we estimated the core tensor $$$t_{m,p,q,r}$$$ and spatial coefficients $$$u_{m,p}(\boldsymbol{x})$$$ jointly from the acquired variable-flip-angle (k,t)-space data $$$d(\boldsymbol{k},t,\theta)$$$ by solving the following problem:
$$\min_{t_{m,p,q,r},u_{m,p}(\boldsymbol{x})}\left\|d(\boldsymbol{k},t,\theta)-\Omega\mathcal{F}_{(\boldsymbol{x},f)\to(\boldsymbol{k},t)}\left\{\sum_{m=1}^{M}\left[\sum_{p=1}^{P_m}\sum_{q=1}^{Q_m}\sum_{r=1}^{R_m}t_{m,p,q,r}u_{m,p}(\boldsymbol{x})\hat{v}_{m,q}(f)\hat{w}_{m,r}(\theta)\right]\right\}\right\|_2^2+R\left(u_{m,p}(\boldsymbol{x})\right),$$
with data consistency constraint and edge-preserving regularization on the spatial coefficients.18
With all subspaces, core tensor, and spatial coefficients determined, the desired image function was reconstructed according to the union-of-low-rank-tensors model.
Metabolite T1 fitting
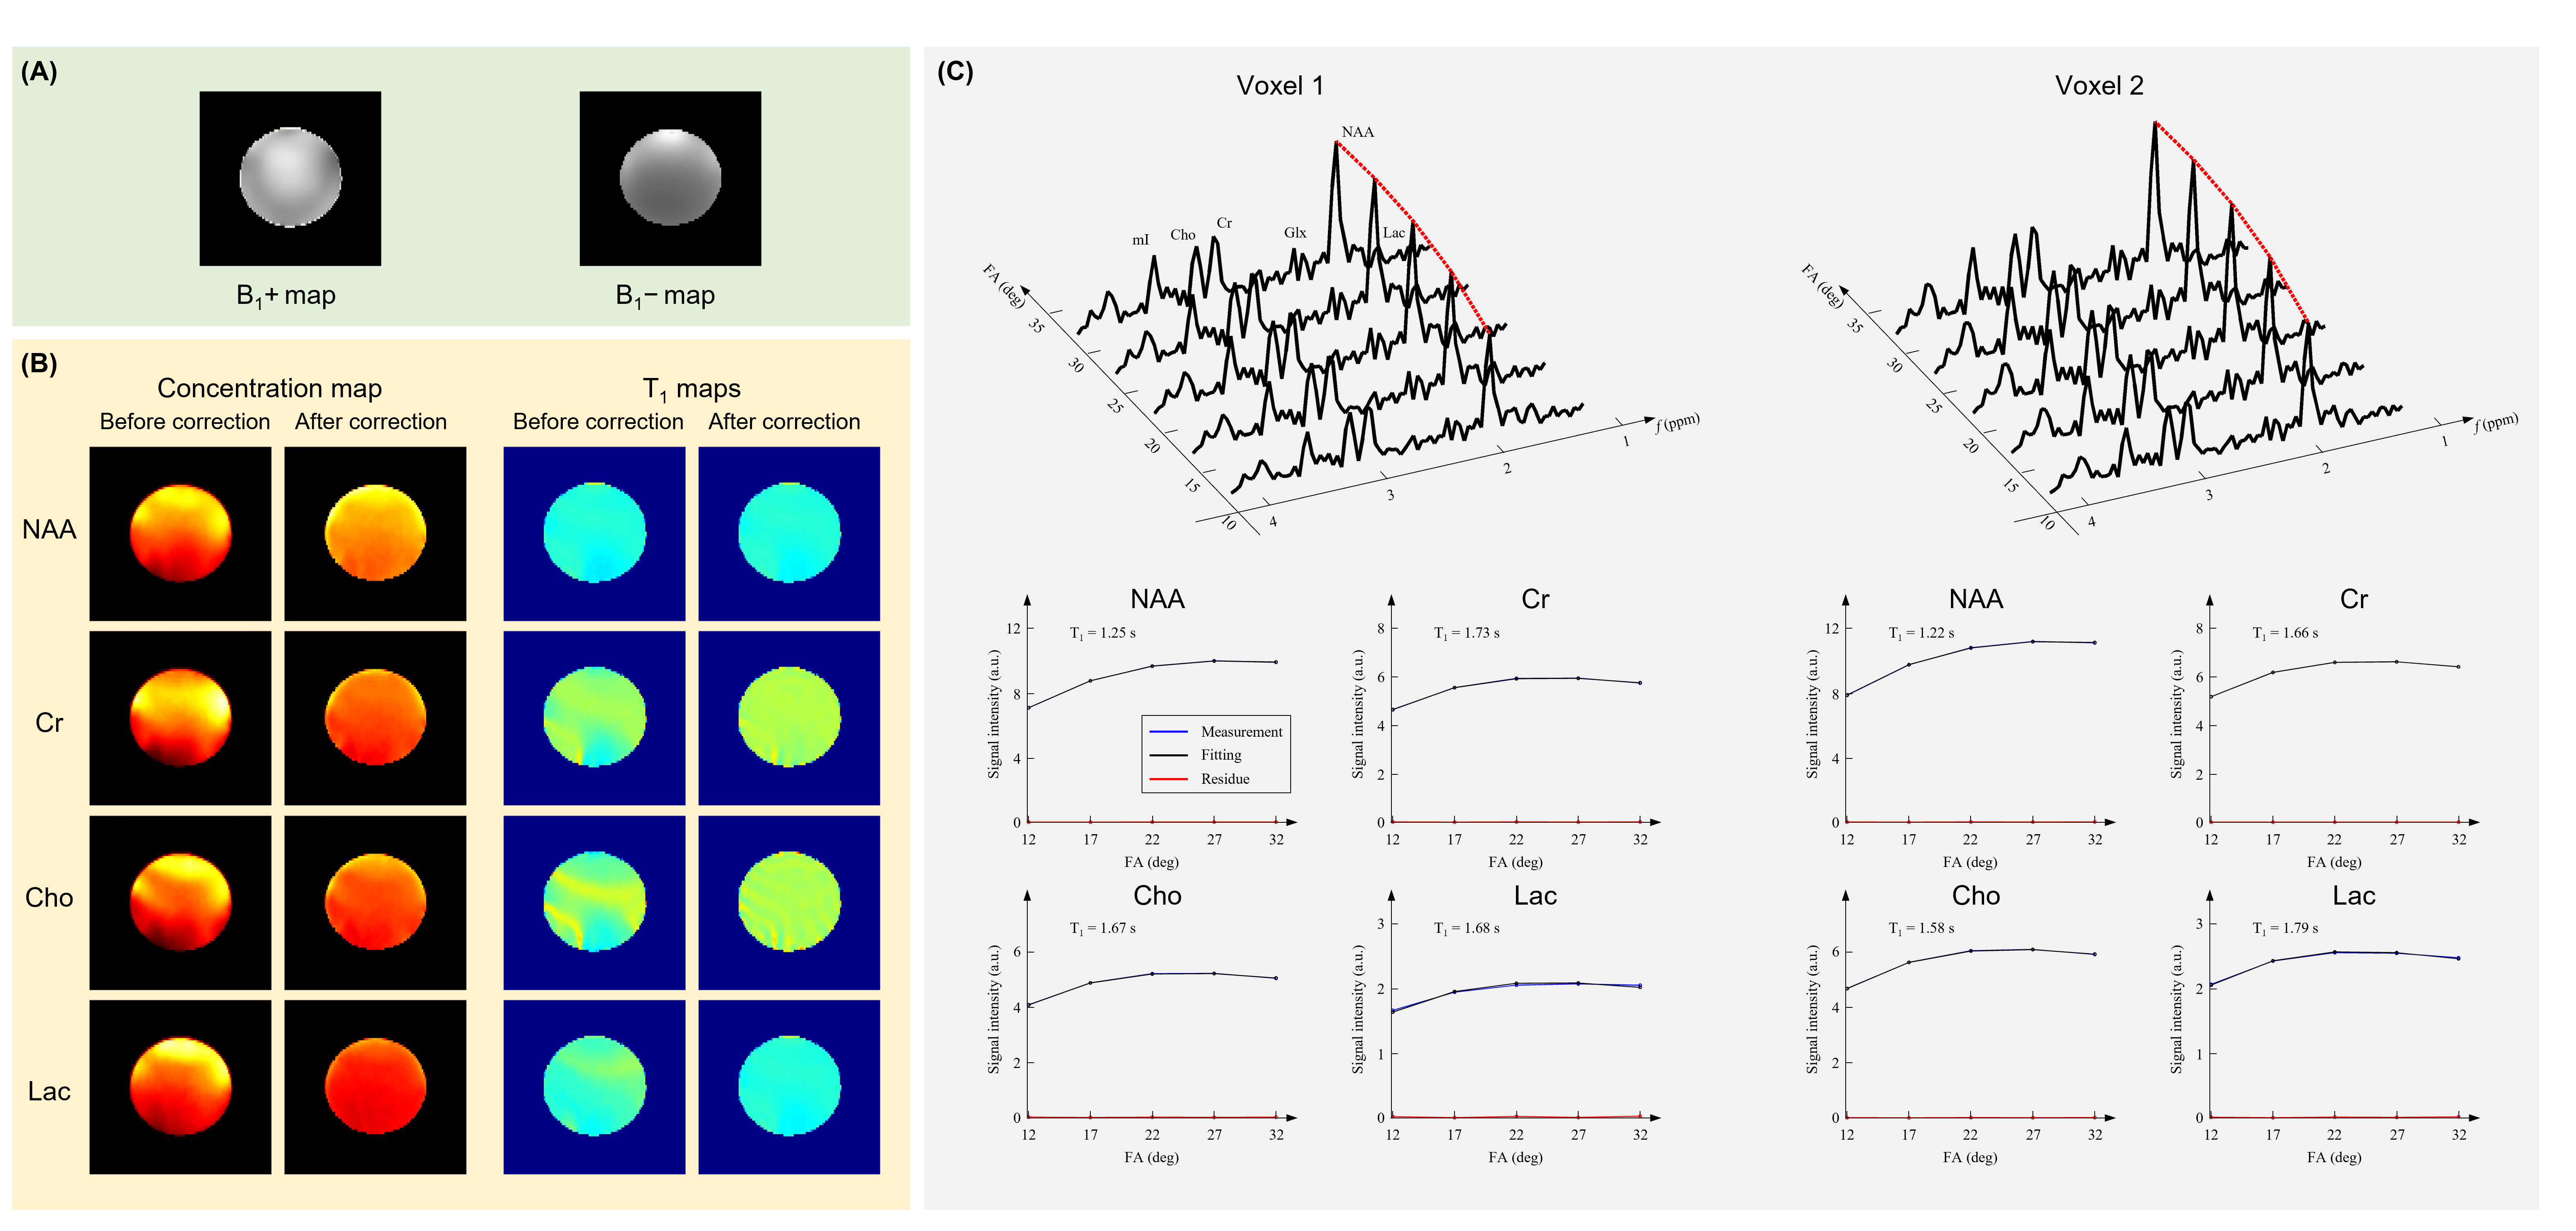
After metabolic image reconstruction, T1 values of each metabolite were fitted using the Bloch equation for each spatial point (CSF voxels excluded). B1+ inhomogeneity map $$$k(\boldsymbol{x})$$$ was estimated from the unsuppressed variable-flip-angle water signals using a polynomial fitting method.17 Metabolite T1 maps were then corrected using the estimated B1+ inhomogeneity map.
Results
Both phantom and IRB-approved in vivo data were acquired using a 3T scanner (MAGNETOM Prisma, Siemens Healthcare, Erlangen, Germany).Figure 2 shows the metabolite concentration and T1 maps acquired from a uniform SPECTRE MRS phantom. As can be seen, the proposed method produced uniform concentration and T1 maps after B1 correction. The reconstructed maps and spectra were of high spatial resolution and SNR, and the T1 fitting produced negligible residue.
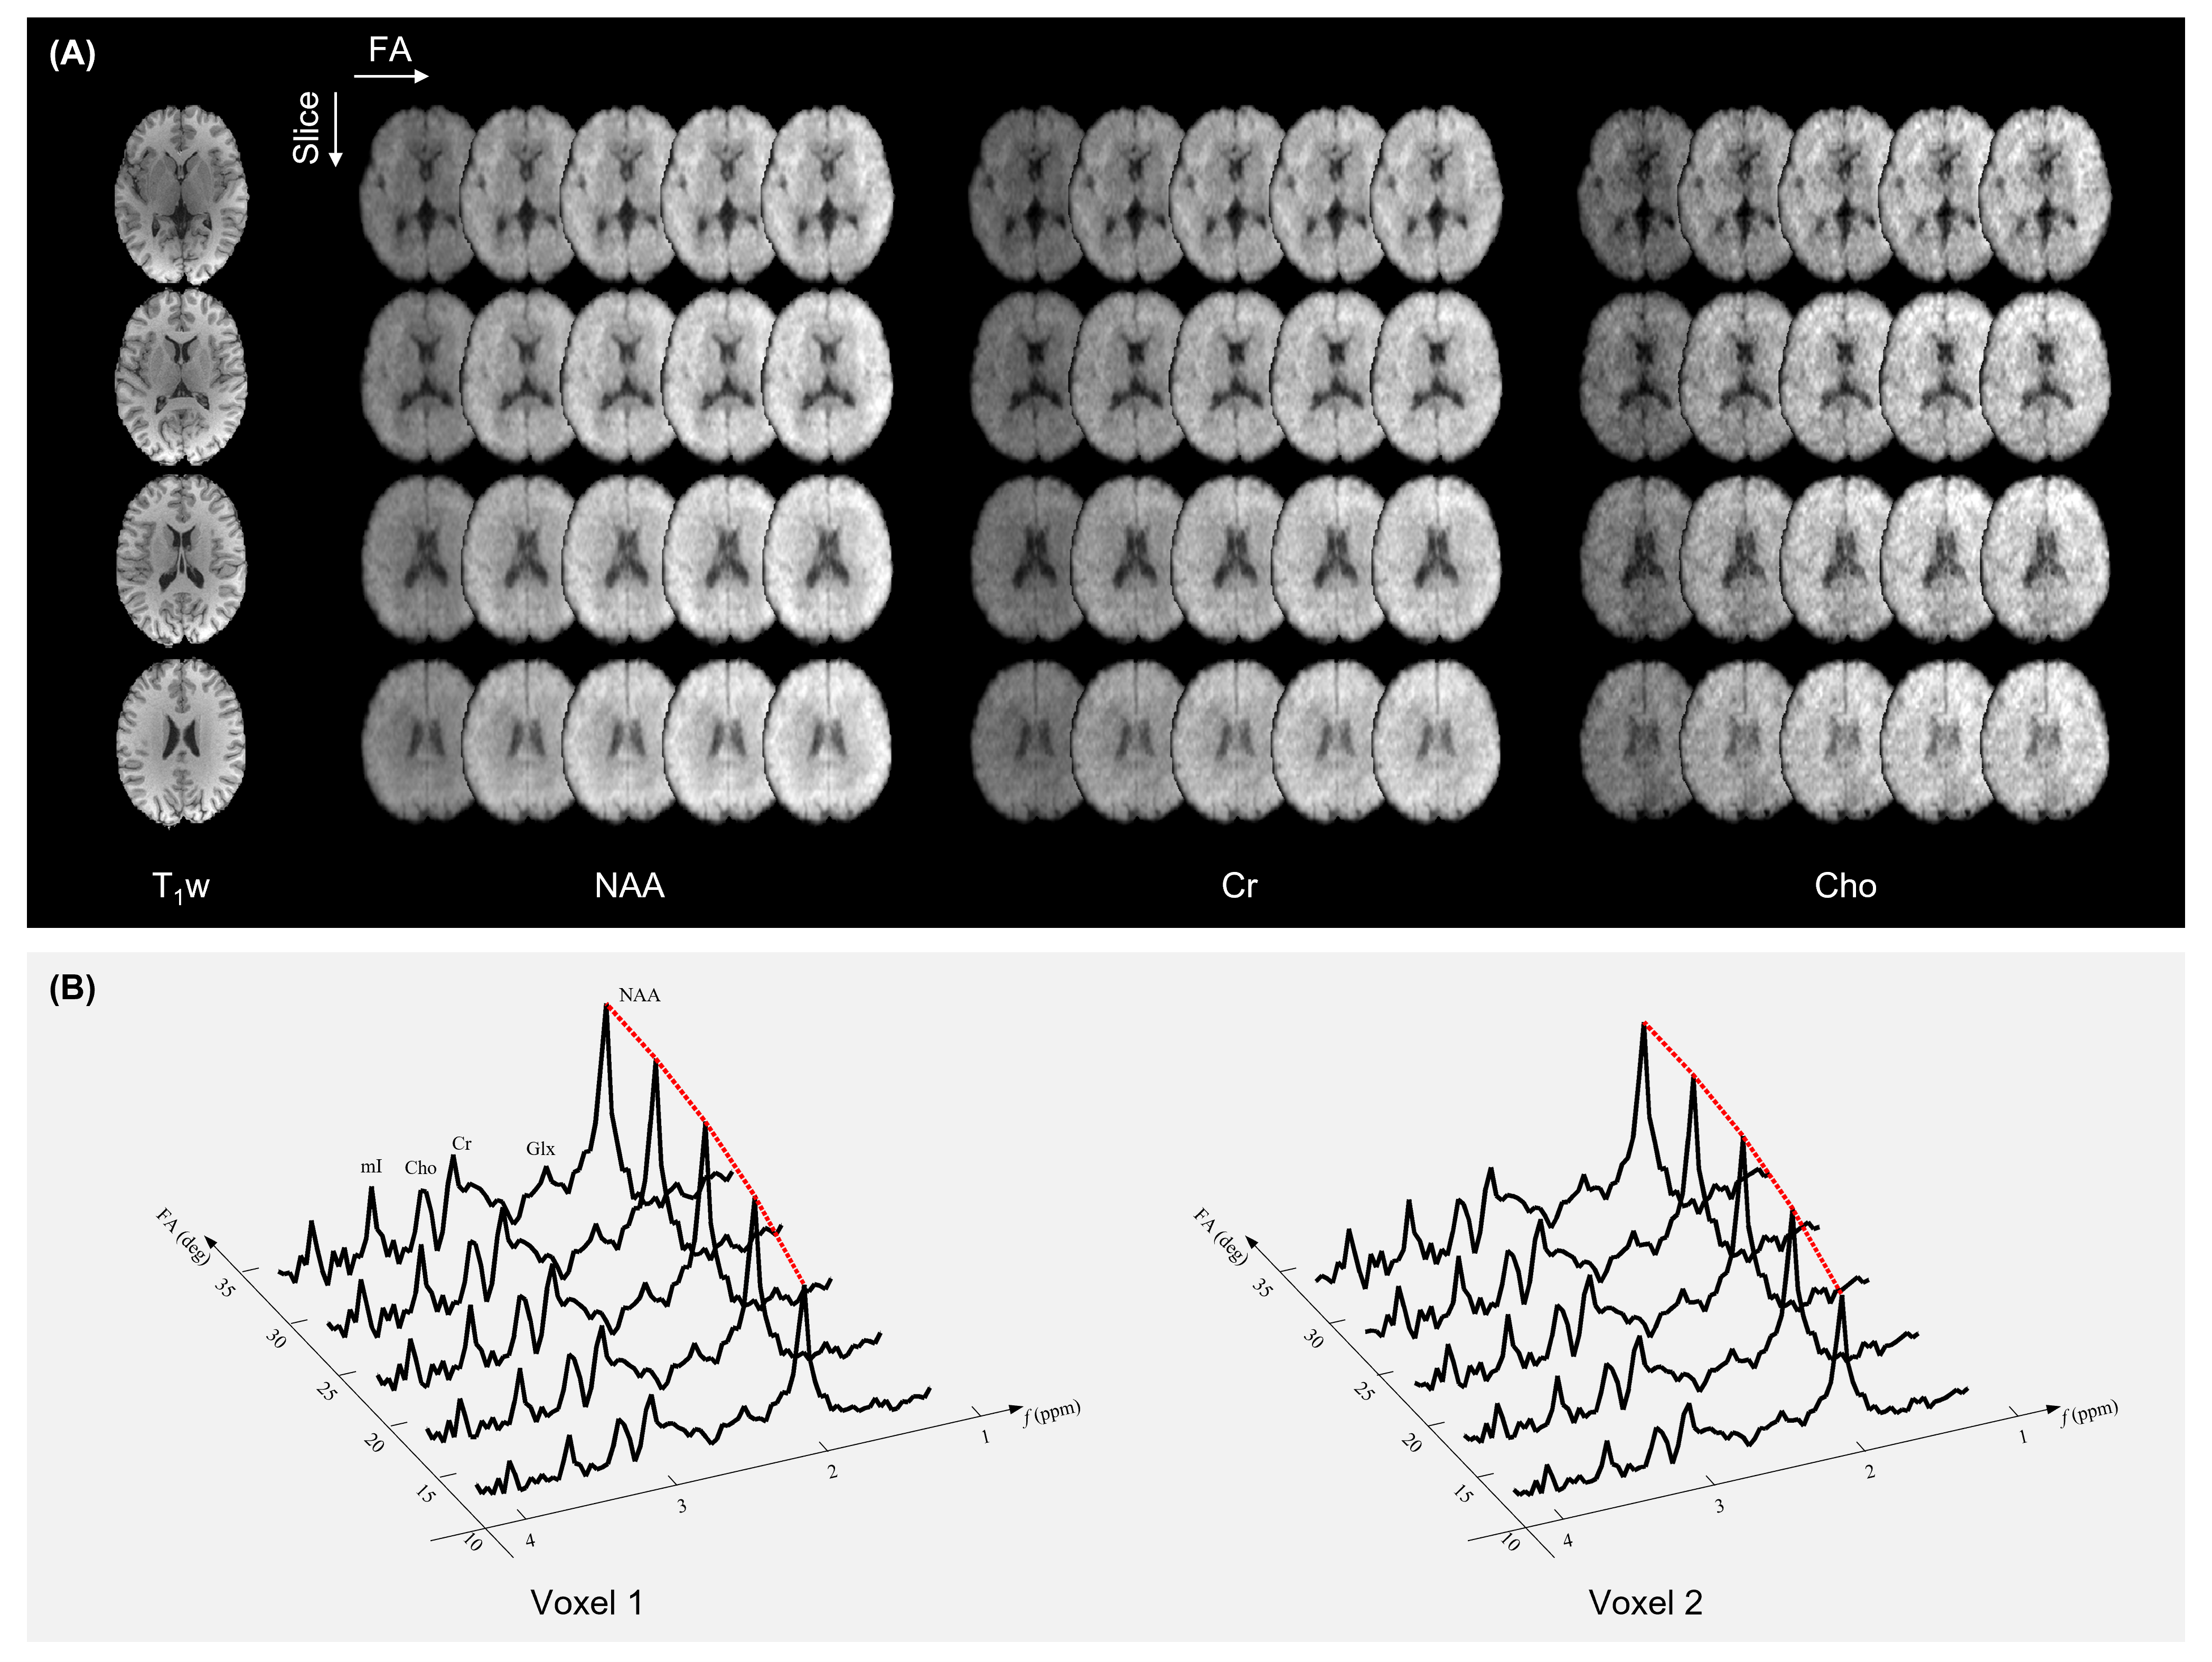
Figure 3 shows the reconstructed variable-flip-angle MRSI images and spectra obtained from a healthy subject. As can be seen, the reconstruction results were of high SNR and showed clear gray matter/white matter contrast.
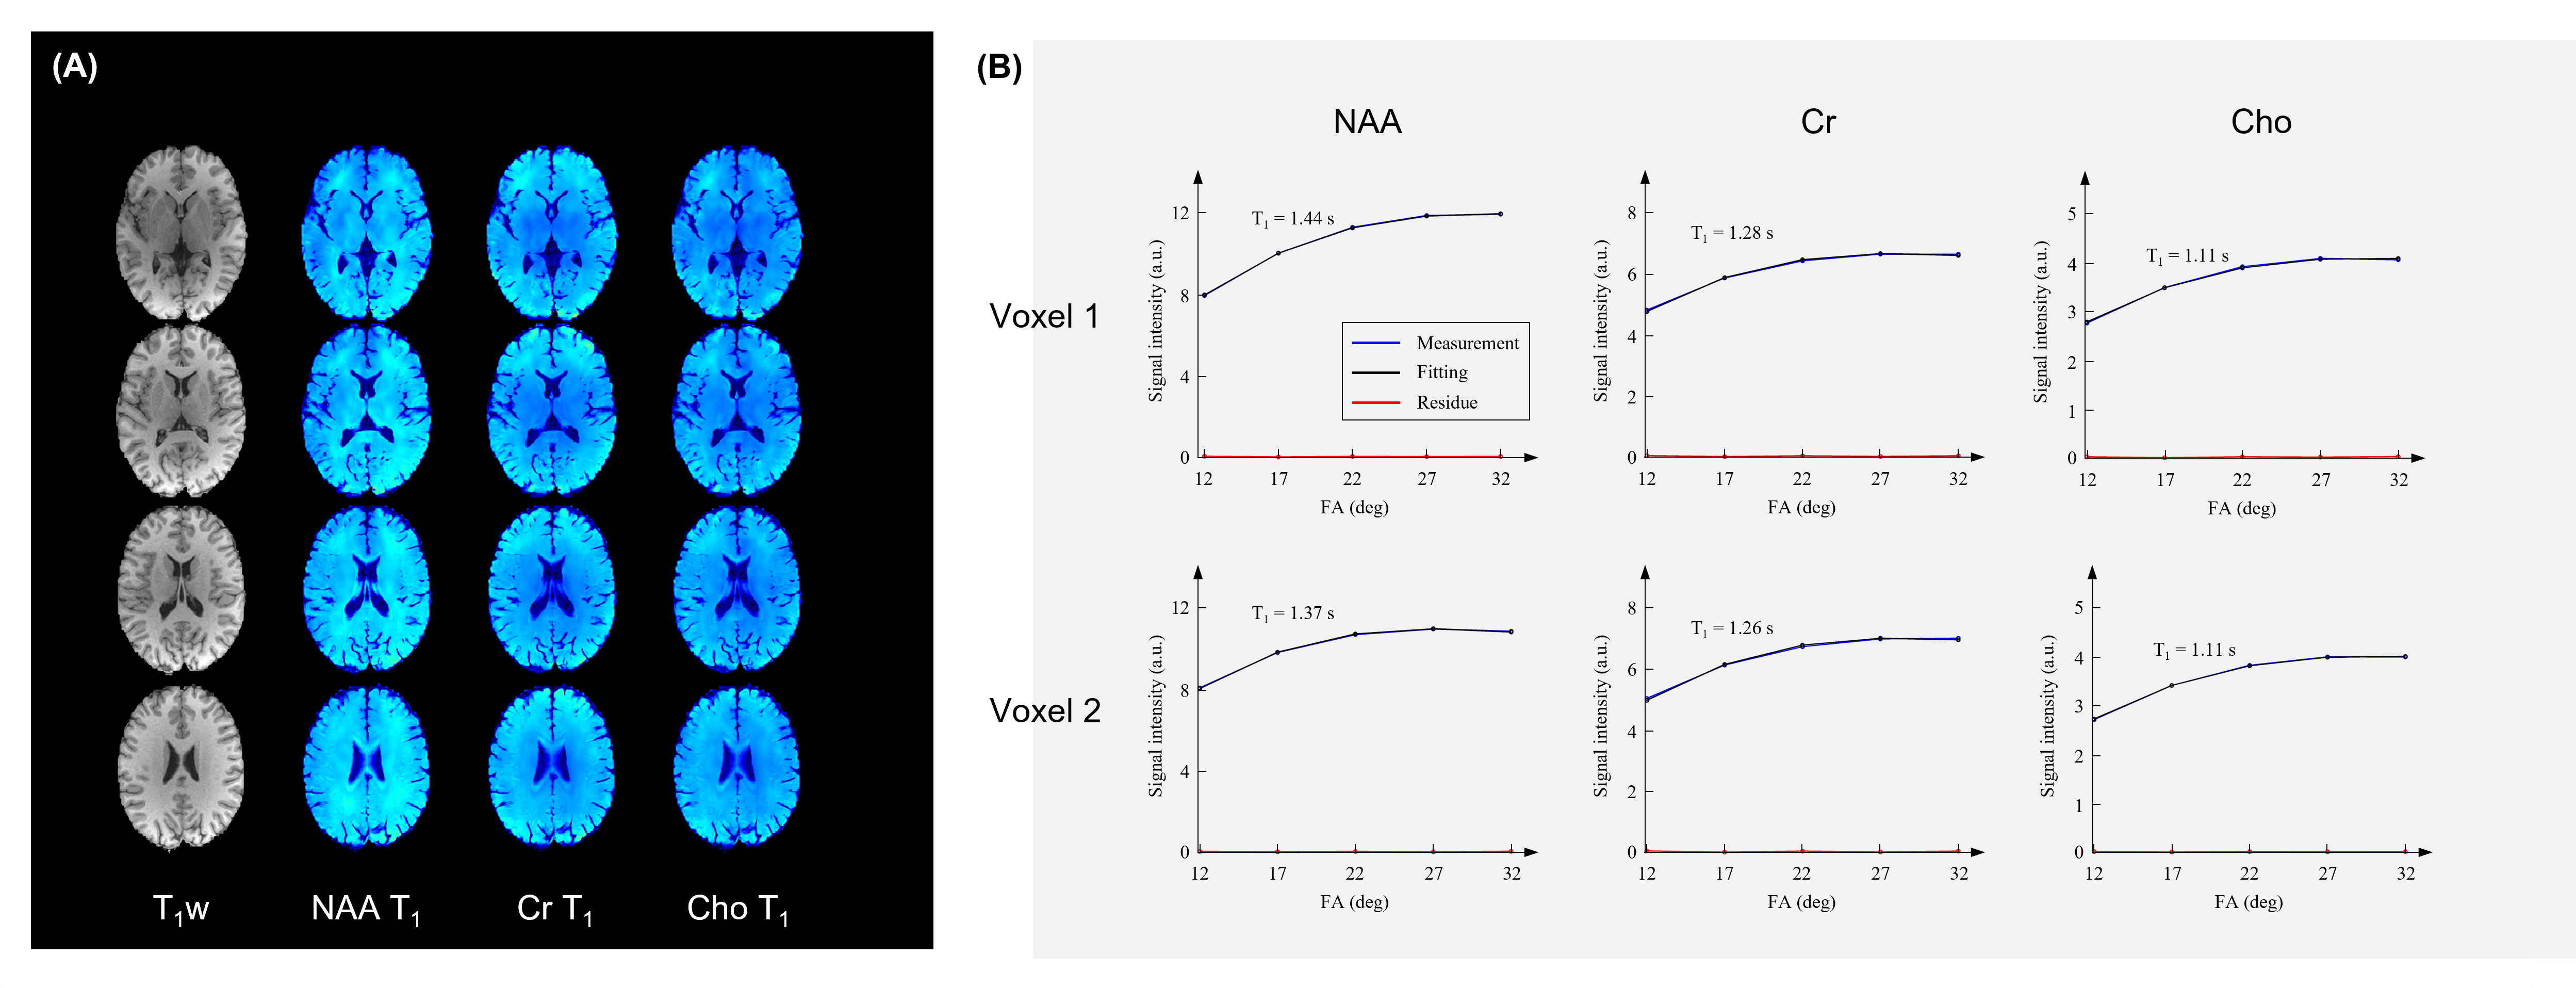
Figure 4 shows the T1 fitting results from the reconstructed images. As can be seen, high-quality 3D metabolite T1 maps were obtained. The T1 curve fitting also produced negligible residue. The fitted T1 values were consistent with previous single-voxel MRS reports.1-4
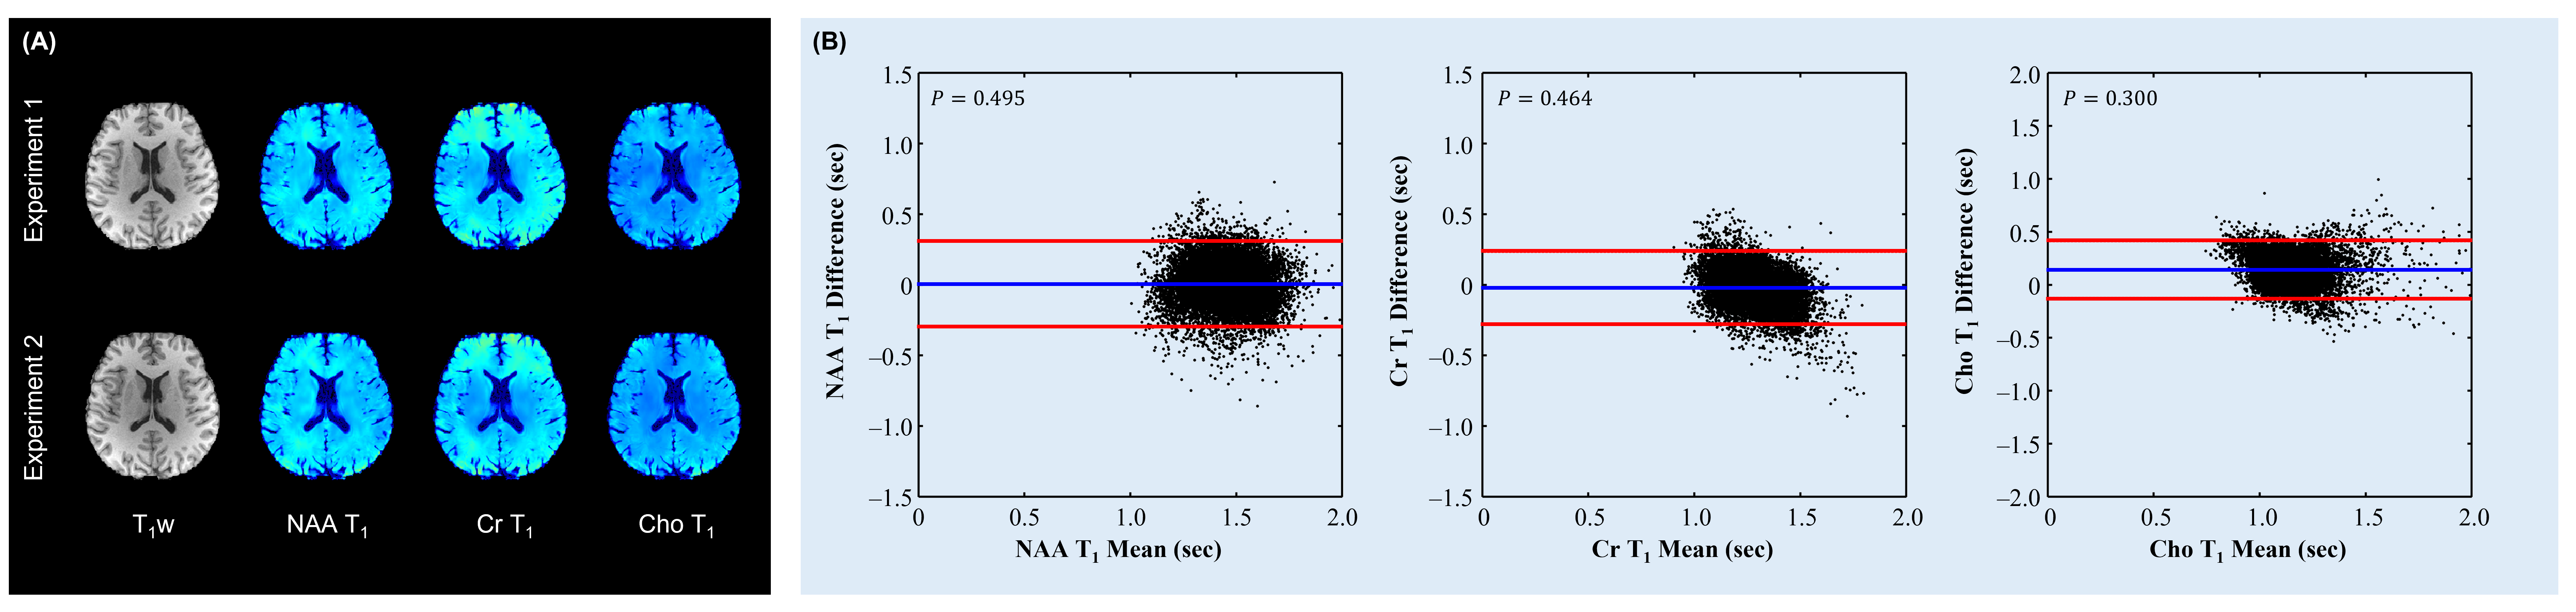
Figure 5 shows Bland-Altman reproducibility analysis of the obtained metabolite T1 maps in a test-retest experiment, in which one healthy subject was scanned twice with the between-session interval of 7 days. The estimated T1 maps were registered by affine transform using the SPM toolbox. All voxels in gray and white matters were used in the Bland-Altman analysis. No significant bias was found between two repetitions (P>0.1 for all metabolites).
Conclusions
We proposed a novel method for 3D high-resolution T1 mapping of brain metabolites. The new method was validated with both phantom and in vivo human data, which produced high-quality and reproducible metabolite concentration and T1 maps at 2.0×3.0×3.0 mm3 resolution.Acknowledgements
No acknowledgement found.References
1. Mlynrik V, Gruber S, Moser E. Proton T1 and T2 relaxation times of human brain metabolites at 3 Tesla. NMR in Biomedicine. 2001;14(5): 325–331.
2. Li Y, Xu D, Ozturk-Isik E, et al. T1 and T2 metabolite relaxation times in normal brain at 3T and 7T. J Mol Imaging Dynam S. 2012;2(2): 1–5.
3. An L, Li S, Shen J. Simultaneous determination of metabolite concentrations, T1 and T2 relaxation times. Magn Reson Med. 2017;78(6): 2072–2081.
4. An L, Araneta MF, Victorino M, Shen J. Determination of brain metabolite T1 without interference from macromolecule relaxation. J Magn Reson. 2020;52(5): 1352–1359.
5. Li Y, Srinivasan R, Ratiney H, Lu Y, Chang SM, Nelson SJ. Comparison of T1 and T2 metabolite relaxation times in glioma and normal brain at 3T. J Magn Reson Imaging. 2008;28(2): 342–350.
6. Brief EE, Vavasour IM, Laule C, Li DKB, Mackay AL. Proton MRS of large multiple sclerosis lesions reveals subtle changes in metabolite T1 and area. NMR in Biomedicine. 2010;23(9): 1033–1037.
7. Ratiney H, Noworolski SM, Sdika M, et al. Estimation of metabolite T1 relaxation times using tissue specific analysis, signal averaging and bootstrapping from magnetic resonance spectroscopic imaging data. MAGMA Magn Reson Mater Phys, Biol Med, 2007;20(3): 143–155.
8. Klauser A, Grouiller F, Courvoisier S, Lazeyras F. High-resolution T1 maps of brain metabolites. Annual Meeting of International Society for Magnetic Resonance in Medicine. 2019: 2488.
9. Ma C, Han PK, Fakhri GE. Simultaneous mapping of metabolite concentration and T1 relaxation time using subspace imaging accelerated inversion recovery MRSI. Annual Meeting of International Society for Magnetic Resonance in Medicine. 2021: 3050.
10. Liang Z-P. Spatiotemporal imaging with partially separable functions. IEEE ISBI. 2007;988–991.
11. He J, Liu Q, Christodoulou AG, Ma C, Lam F, and Liang Z-P. Accelerated high-dimensional MR imaging with sparse sampling using low-rank tensors. IEEE TMI, 2016;35(9): 2119–2129.
12. Ma C, Clifford B, Liu Y, Gu Y, Lam F, Yu X, Liang Z-P. High‐resolution dynamic 31P‐MRSI using a low‐rank tensor model. Magn Reson Med, 2017;78(2): 419–428.
13. Christodoulou AG, Shaw JL, Nguyen C, et al. Magnetic resonance multitasking for motion-resolved quantitative cardiovascular imaging. Nat Biomed Eng. 2018;2(4): 215–226.
14. Li Y, Lam F, Clifford B, Liang Z-P. A subspace approach to spectral quantification for MR spectroscopic imaging. IEEE TBME,2017;64(10): 2486–2489.
15. Lam F, Li Y, Guo R, Clifford B, Liang Z-P. Ultrafast magnetic resonance spectroscopic imaging using SPICE with learned subspaces. Magn Reson Med. 2020;83(2): 377–390.
16. Zhao B, Lu W, Hitchens TK, Lam F, Ho C, Liang Z-P. Accelerated MR parameter mapping with low‐rank and sparsity constraints. Magn Reson Med. 2015;74(2): 489–498.
17. Wang Y, Chen Y, Wu D, et al. STrategically Acquired Gradient Echo (STAGE) imaging, part II: Correcting for RF inhomogeneities in estimating T1 and proton density. Magn Reson Imaging. 2018;46: 140–150.
18. Haldar JP, Hernando D, Song SK, Liang Z-P. Anatomically constrained reconstruction from noisy data. Magn Reson Med. 2008;59(4): 810–818.
Figures