3691
High-Resolution 1H-MRSI of the Brain at 9.4T Integrating Relaxation Enhancement and Subspace Imaging1Department of Bioengineering, University of Illinois at Urbana-Champaign, Urbana, IL, United States, 2Beckman Institute for Advanced Science and Technology, University of Illinois at Urbana-Champaign, Urbana, IL, United States, 3Department of Chemistry, University of Illinois at Urbana-Champaign, Urbana, IL, United States, 4Department of Electrical and Computer Engineering, University of Illinois at Urbana-Champaign, Urbana, IL, United States
Synopsis
Keywords: Spectroscopy, Data Acquisition, MRSI Data Processing
Ultrahigh-field systems offer sensitivity and specificity advantages for metabolite mapping using MRSI. We present here a method that integrates relaxation enhancement acquisition, a unique strategy leveraging higher fields, and subspace imaging, for high-resolution 1H-MRSI at a 9.4 T system. Both in vitro and in vivo experiments have been performed to demonstrate the feasibility of the proposed method. We are able to achieve significantly enhanced SNR compared to no relaxation enhancement and produce high-quality spatially-resolved spectra and high-resolution metabolite images using subspace imaging with 0.6×0.6×2 mm3 nominal resolution in 18 minutes or 1×1×2 mm3 in 10 minutes.Introduction
Ultrahigh-field MRSI present unique opportunities in enhancing the sensitivity and specificity of metabolite and neurotransmitter detection, mapping, and quantification 1,2. Preclinical ultrahigh-field MRSI, in particular, allows for better understanding the biochemical mechanism of diseases, monitoring drug dynamics, and optimizing treatments etc. In the meantime, preclinical MRSI also presents unique challenges. For example, higher resolution is needed due to smaller imaging volumes and the need to resolve tissue specific chemical profiles. Scan time can be long due to the lengthened T1 at higher field strengths 3. In addition, stronger water suppression modules are typically required which further reduces acquisition efficiency with prolonged TRs. Leveraging the larger chemical shift differences between different molecules and the longitudinal recovery mechanism, relaxation enhancement (RE) techniques that use frequency selectively excitation of metabolites to shorten their T1 recovery have been shown to improve the SNR efficiency for preclinical ultrahigh-field spectroscopy 4,5. In this work, we designed and implemented RE-based MRSI acquisitions, and integrated it with SPICE-based subspace processing strategies 6 for the first time. We validated the acquisition using ex vivo brain experiments and demonstrated in vivo high-resolution, nonwater-suppressed MRSI of rat brains at 9.4T, i.e., nominal resolutions of 0.6×0.6×2 mm3 in 18 minutes and 1×1×2 mm3 in 10 minutes.Methods
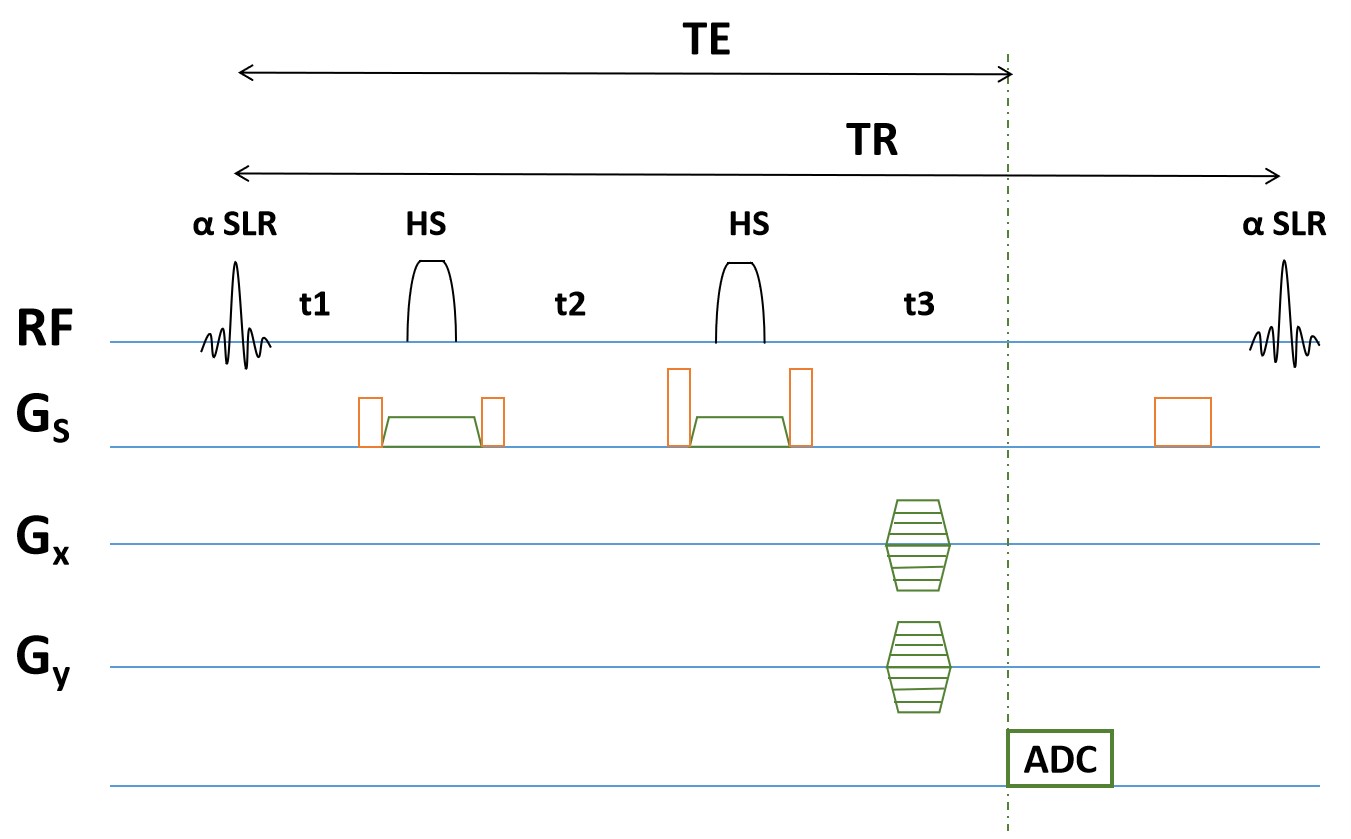
Relaxation-enhanced MRSI acquisitionWe designed and implemented a phase-encoded CSI that is composed of a frequency selective SLR excitation pulse and two spatially-selective adiabatic (hyperbolic secant) refocusing pulses (Fig. 1) to achieve T1-shortening of the metabolite components in the 0.5-3.9 ppm (centered at 2.2 ppm with a bandwidth of 1360 Hz at 9.4T). After excitation, phase encoded CSI readouts were applied. With the frequency selective excitation, no water suppression pulses were used which allowed for more flexible TR choices for maximized acquisition efficiency. For example, based on the literature metabolite T1 values measured with RE spectroscopy, we can flexibly choose TR in the range of 500-1500 ms for trading off speed and SNR. We refer to our sequences as RE-CSI below. The minimum TE achieved was currently 18 ms which can be further optimized in future work.
Data processing
The RE-MRSI data first went through a union-of-subspace-based nuisance water/lipid removal 7. To effectively adapt the SPICE-based subspace reconstruction 8, the key issues are subspace estimation and subspace-constrained reconstruction. In this first feasibility study, we acquired RE-CSI datasets at a lower resolution and longer TR (e.g., 1000 ms) as well as at a higher resolution and shorter TR (e.g., 500/700 ms), and adopted a multiresolution processing strategy. Specifically, we first applied a B0-correction reconstruction to the lower-resolution CSI data (1×1×2 mm3). After B0 correction, the data was k-space truncated (for SNR consideration) to extract the metabolite basis (using SVD). The subspace was then used to reconstruct all the other datasets. In the future, we expect to develop a similar physics-driven subspace learning strategy for 9.4T that has been demonstrated in human imaging 6.
Experimental Studies
Both ex vivo and in vivo rat brain imaging were carried out at a Bruker 9.4 T system with a 4-channel surface coil. Two-month-old Sprague Dawley male rats were imaged. For ex vivo experiments, a rat brain was extracted and imaged immediately after transferring to a 20 mm glass tube. For in vivo experiments, rats were anesthetized using 4% isoflurane initially and 2% isoflurane during the experiment. Temperature and breathing rate were monitored using PC-SAM software. Anatomical images (i.e., T2-RARE) and field maps were acquired for each rat. The animal experiments were approved by the local IACUC.
Results
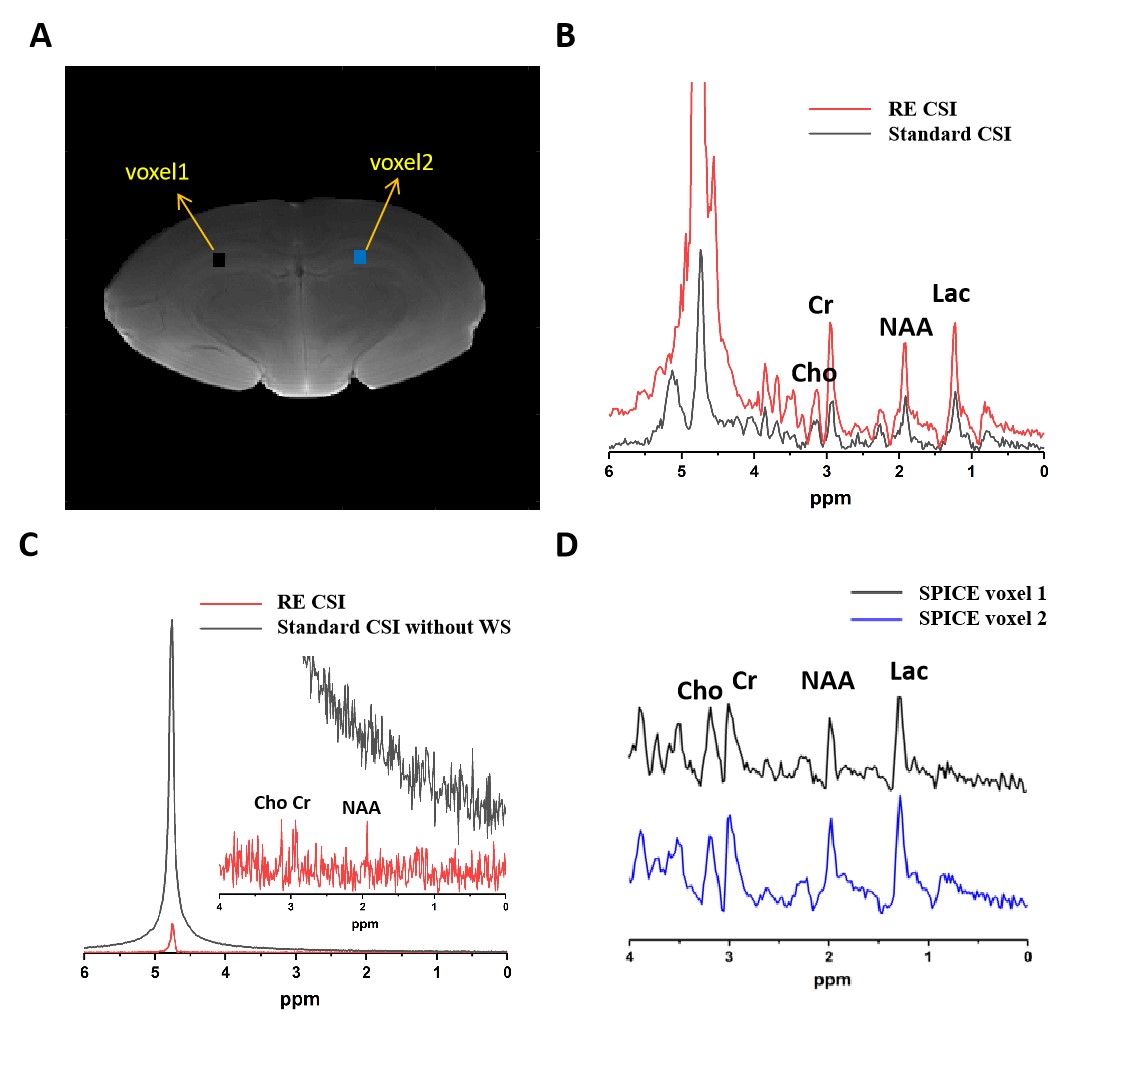
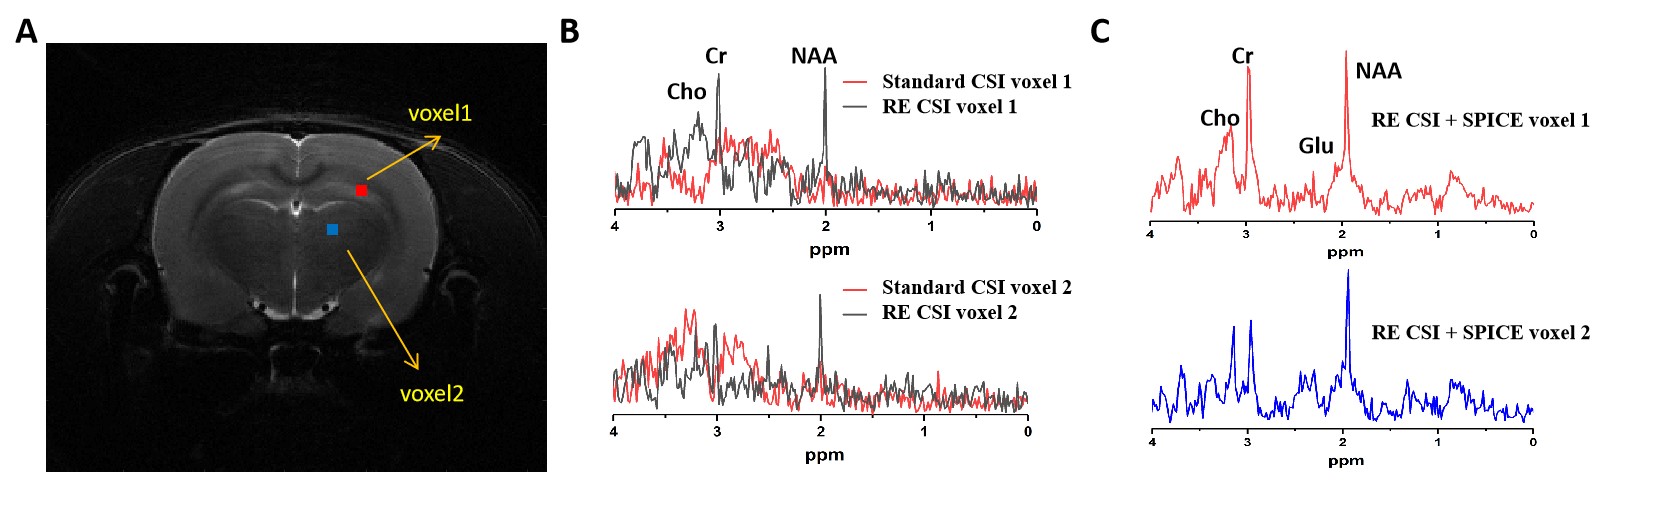
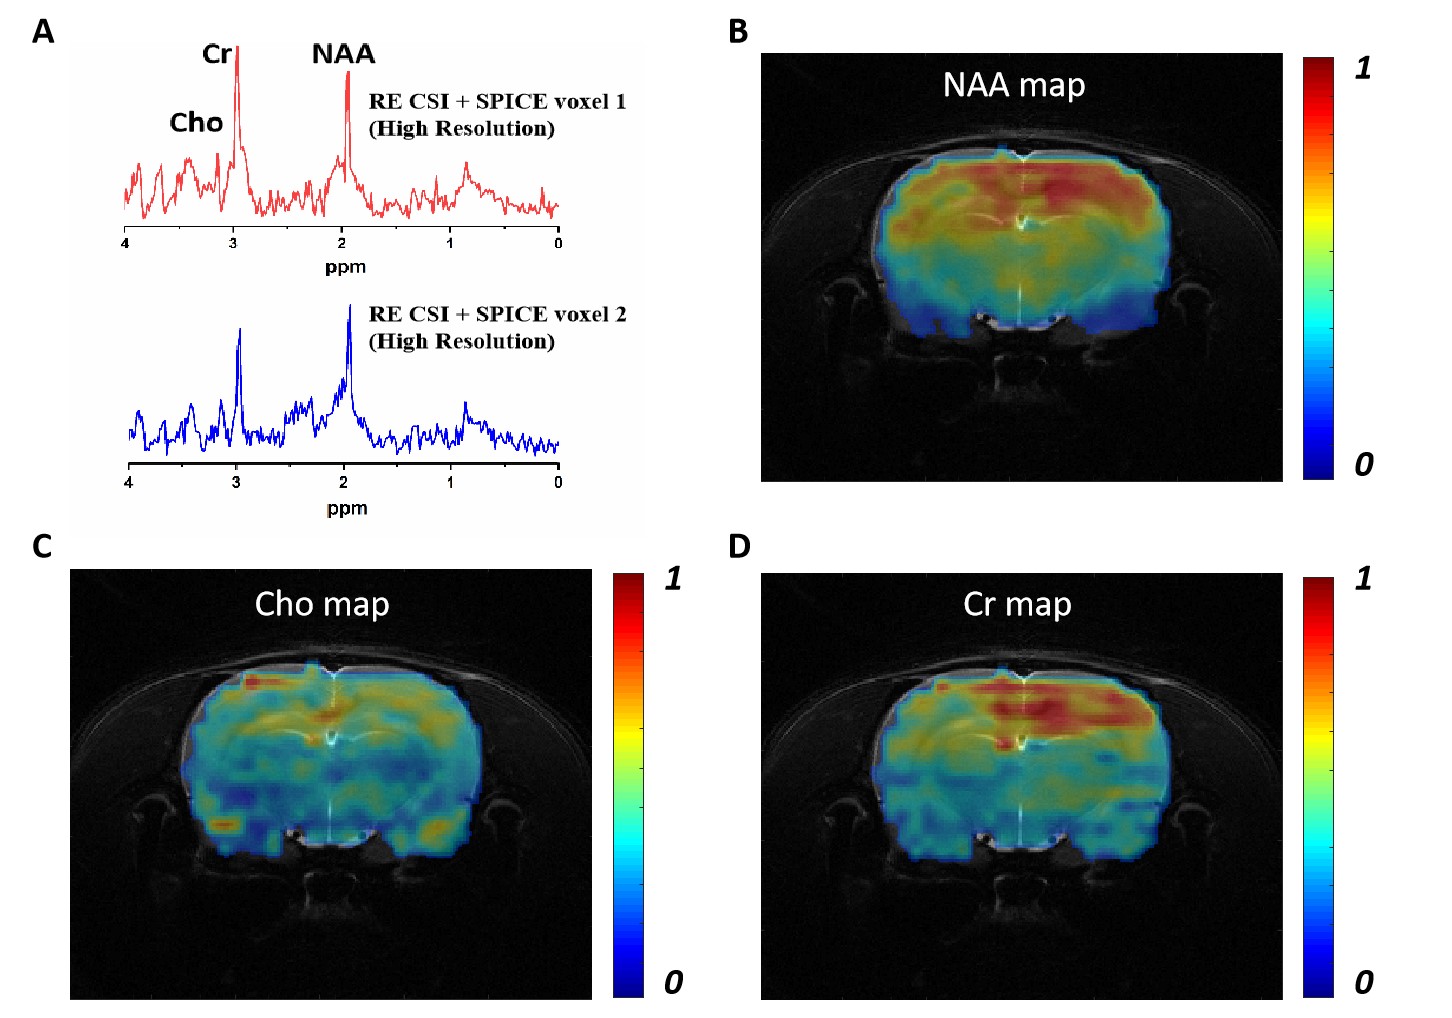
Comparisons between the proposed RE-CSI and a standard spin-echo (SE)-CSI with and without water suppression (VAPOR) on an ex vivo brain was shown in Fig. 2. Our RE-CSI showed effective water suppression (Fig. 2B&C) without any water suppression pulses, to a level that it can be effectively removed using post-processing (e.g., HSVD) without noticeable sidebands. Apparent metabolite signal enhancement of about 1.5 to 2-fold was observed (Fig. 2B). A SPICE-based reconstruction further enhanced SNR and produced high-quality spectra from a high-resolution scan (40×40 matrix, 2 mm inplane resolution, Fig. 2C&D). The signal enhancement by RE-CSI is consistently observed in live rat brains (Fig. 3). Figure 3C shows again that the subspace reconstruction of RE-CSI data achieved a higher SNR and better lineshape for metabolite peaks than the Fourier reconstruction. It is worth noting that since the water signals reside in the stopband of our excitation pulse (RE-CSI), there is no dephasing compared with conventional water suppression. Thus, the “residual” water could be better quantified and used for phase correction. Finally, by combining RE-CSI and SPICE, high-resolution, high-SNR metabolite spatiospectral reconstructions were obtained in vivo (Fig. 4) with a nominal resolution of 0.6×0.6×2 mm3 in just about 17 minutes. Meanwhile, we expect the performance to be improved with better subspace estimation and acquisition optimizations.Conclusion
We combined relaxation-enhancement-based excitation, SNR-efficient acquisition and SPICE-based processing strategies for the first time at an ultrahigh-field system. We demonstrated promising high-resolution 1H-MRSI of rat brain in vivo. We expect the proposed method to be useful for a range of preclinical animal studies and further translated to human ultrahigh-field systems with rapid spatiospectral encoding integrated.Acknowledgements
This work was supported in part by NIH-NIGMS-1R35GM142969References
1. Trattnig, S., Bogner, W., Gruber, S., Szomolanyi, P., Juras, V., Robinson, S., ... & Haneder, S. (2016). Clinical applications at ultrahigh field (7 T). Where does it make the difference? NMR in Biomedicine, 29, 1316-1334.
2. Henning, A. (2018). Proton and multinuclear magnetic resonance spectroscopy in the human brain at ultra-high field strength: a review. Neuroimage, 168, 181-198.
3. Ladd, M. E., Bachert, P., Meyerspeer, M., Moser, E., Nagel, A. M., Norris, D. G., ... & Zaiss, M. (2018). Pros and cons of ultra-high-field MRI/MRS for human application. Progress in nuclear magnetic resonance spectroscopy, 109, 1-50.
4. Shemesh, N., Dumez, J. N., & Frydman, L. (2013). Longitudinal relaxation enhancement in 1H NMR spectroscopy of tissue metabolites via spectrally selective excitation. Chemistry–A European Journal, 19, 13002-13008.
5. Zhang, Z., Shemesh, N., & Frydman, L. (2017). Efficient spectroscopic imaging by an optimized encoding of pretargeted resonances. MRM, 77, 511-519.
6. Guo, R., Zhao, Y., Li, Y., Bhattacharyya, P., Lowe, M., Wiesner, H. M., ... & Liang, Z. P. (2021). Fast high-resolution 1H-MRSI of the human brain at 7T. In Proc. Intl. Soc. Mag. Reson. Med.
7. Ma, C., Lam, F., Johnson, C. L., & Liang, Z. P. (2016). Removal of nuisance signals from limited and sparse 1H MRSI data using a union‐of‐subspaces model. MRM, 75, 488-497.
8. Lam, F., Ma, C., Clifford, B., Johnson, C. L., & Liang, Z. P. (2016). High‐resolution 1H‐MRSI of the brain using SPICE: data acquisition and image reconstruction. MRM, 76, 1059-1070.
Figures