3690
Removal of lipid signals and other short T2 components in GRE-MRI and FID-MRSI using quadratic radio frequency phase increments1Department of Biomedical Imaging and Image-guided Therapy, Radiology and Nuclear Medicine, Medical University of Vienna, HFMR Centre, Vienna, Austria, 2Department of Neurosurgery, Medical University of Vienna, Vienna, Austria, 3Institute for Clinical Molecular MRI in Musculoskeletal System, Karl Landsteiner Society, Vienna, Austria
Synopsis
Keywords: Spectroscopy, Spectroscopy, Lipid Fat Suppression Removal
We present an elegant and easy to implement method for MRI and CSI steady-state sequences to remove or suppress lipids or other components with short transverse relaxation times by neither introducing additional pulses nor hardware and by just altering the excitation pulse phase.Introduction
Lipids are one of the largest sources for corrupt data in Magnetic Resonance Spectroscopic Imaging (MRSI) since they contaminate the signal and decrease the quality of findings1. Lipids also resonate spectrally on a similar chemical shift as the important tumor biomarker and metabolite lactate and hamper therefore lactate imaging in the diseased tissue since their signal magnitude can excel the lactate signal by several factors. Spatially, as well as spectrally, lipid signals can leak on completely wrong positions or resonances, impeding therefor the proper quantification of other metabolites. Also, in the field of MRI off-resonances make the separation of water and fat difficult since the individual signals mix up2. Different methods to prevent, suppress or remove lipid signals exist like Fat-Sat; the Dixon method, mathematical algorithms (L1/L2-regularization); lipid-inversion pulses (STIR); or subtraction-based spectral-selective methods (MEGA-editing) or hardware-based lipid-crushing via external coils.The purpose of this work is to present a novel method to remove/suppress lipids for steady-state sequences by neither introducing additional pulses nor hardware.
Methods
Radio-frequency (RF) spoiling3 used in GRE-MRI is a widely used tool to suppress the transverse signal of components with long T2 by quadratically incrementing the excitation pulse phase from TR to TR (e.g. phase increment $$$\theta$$$=117° - see Figure 1,top). ‘RF-phase-based’ or ‘Partial RF spoiling’ methods4,5 for T2-mapping exploited the strong T2-dependence – which forms the basis for the proposed method here – as well as the resilience concerning different T1s. An interesting signal behavior at 3T (Figure 1,bottom) can be observed in Bloch simulations as well as via the analytic solution6 if TRs ~<300ms but >~100ms: Lipids (short T2s) remain invariant for all incremented phases but long T2 components not. By complex subtraction of two scans with different phase increments lipids and fat can be nulled. The optimal values for $$$\theta_1$$$ and $$$\theta_2$$$=-$$$\theta_1$$$ was selected by the simulated signal maximum of the compound of interest.We measured three sequences on a Siemens 3T Prisma: A spoiled, unbalanced GRE with 196x196 matrix, FOV 200x200 mm2, slice thickness 10 mm, TR=160ms, FA=65°, 2 averages with $$$\theta$$$=+24°, $$$\theta$$$=-24° and $$$\theta$$$=0° (instead of traditional RF spoiling) and both, a spoiled, unbalanced un-localized FID and a FID-MRSI sequence (TE=1ms, TRs=230ms, FA=80°, $$$\theta$$$=+40°, $$$\theta$$$=-40°, $$$\theta$$$=0° and 500 averages for FID and 20 for FID-MRSI). Both featured a 3-pulse water suppression module and a short signal readout of 128 spectral points with 1000Hz spectral bandwidth. The matrix size of the FID-MRSI sequence was 8x8, across a FOV=200x200mm2, slice thickness 10mm. The GRE sequence was used for imaging of the T2-array of a NIST7 phantom together with a turbo-spin-echo sequence for determining the T2 values and the FID/FID-MRSI sequences where used on a home-built spectroscopy phantom (water, N-acetylaspartat, creatine, choline-compounds, glutamate, glutamine, myo-inositol, lactate) with corn oil-soaked textiles wrapped around to mimic lipid layers.
Results
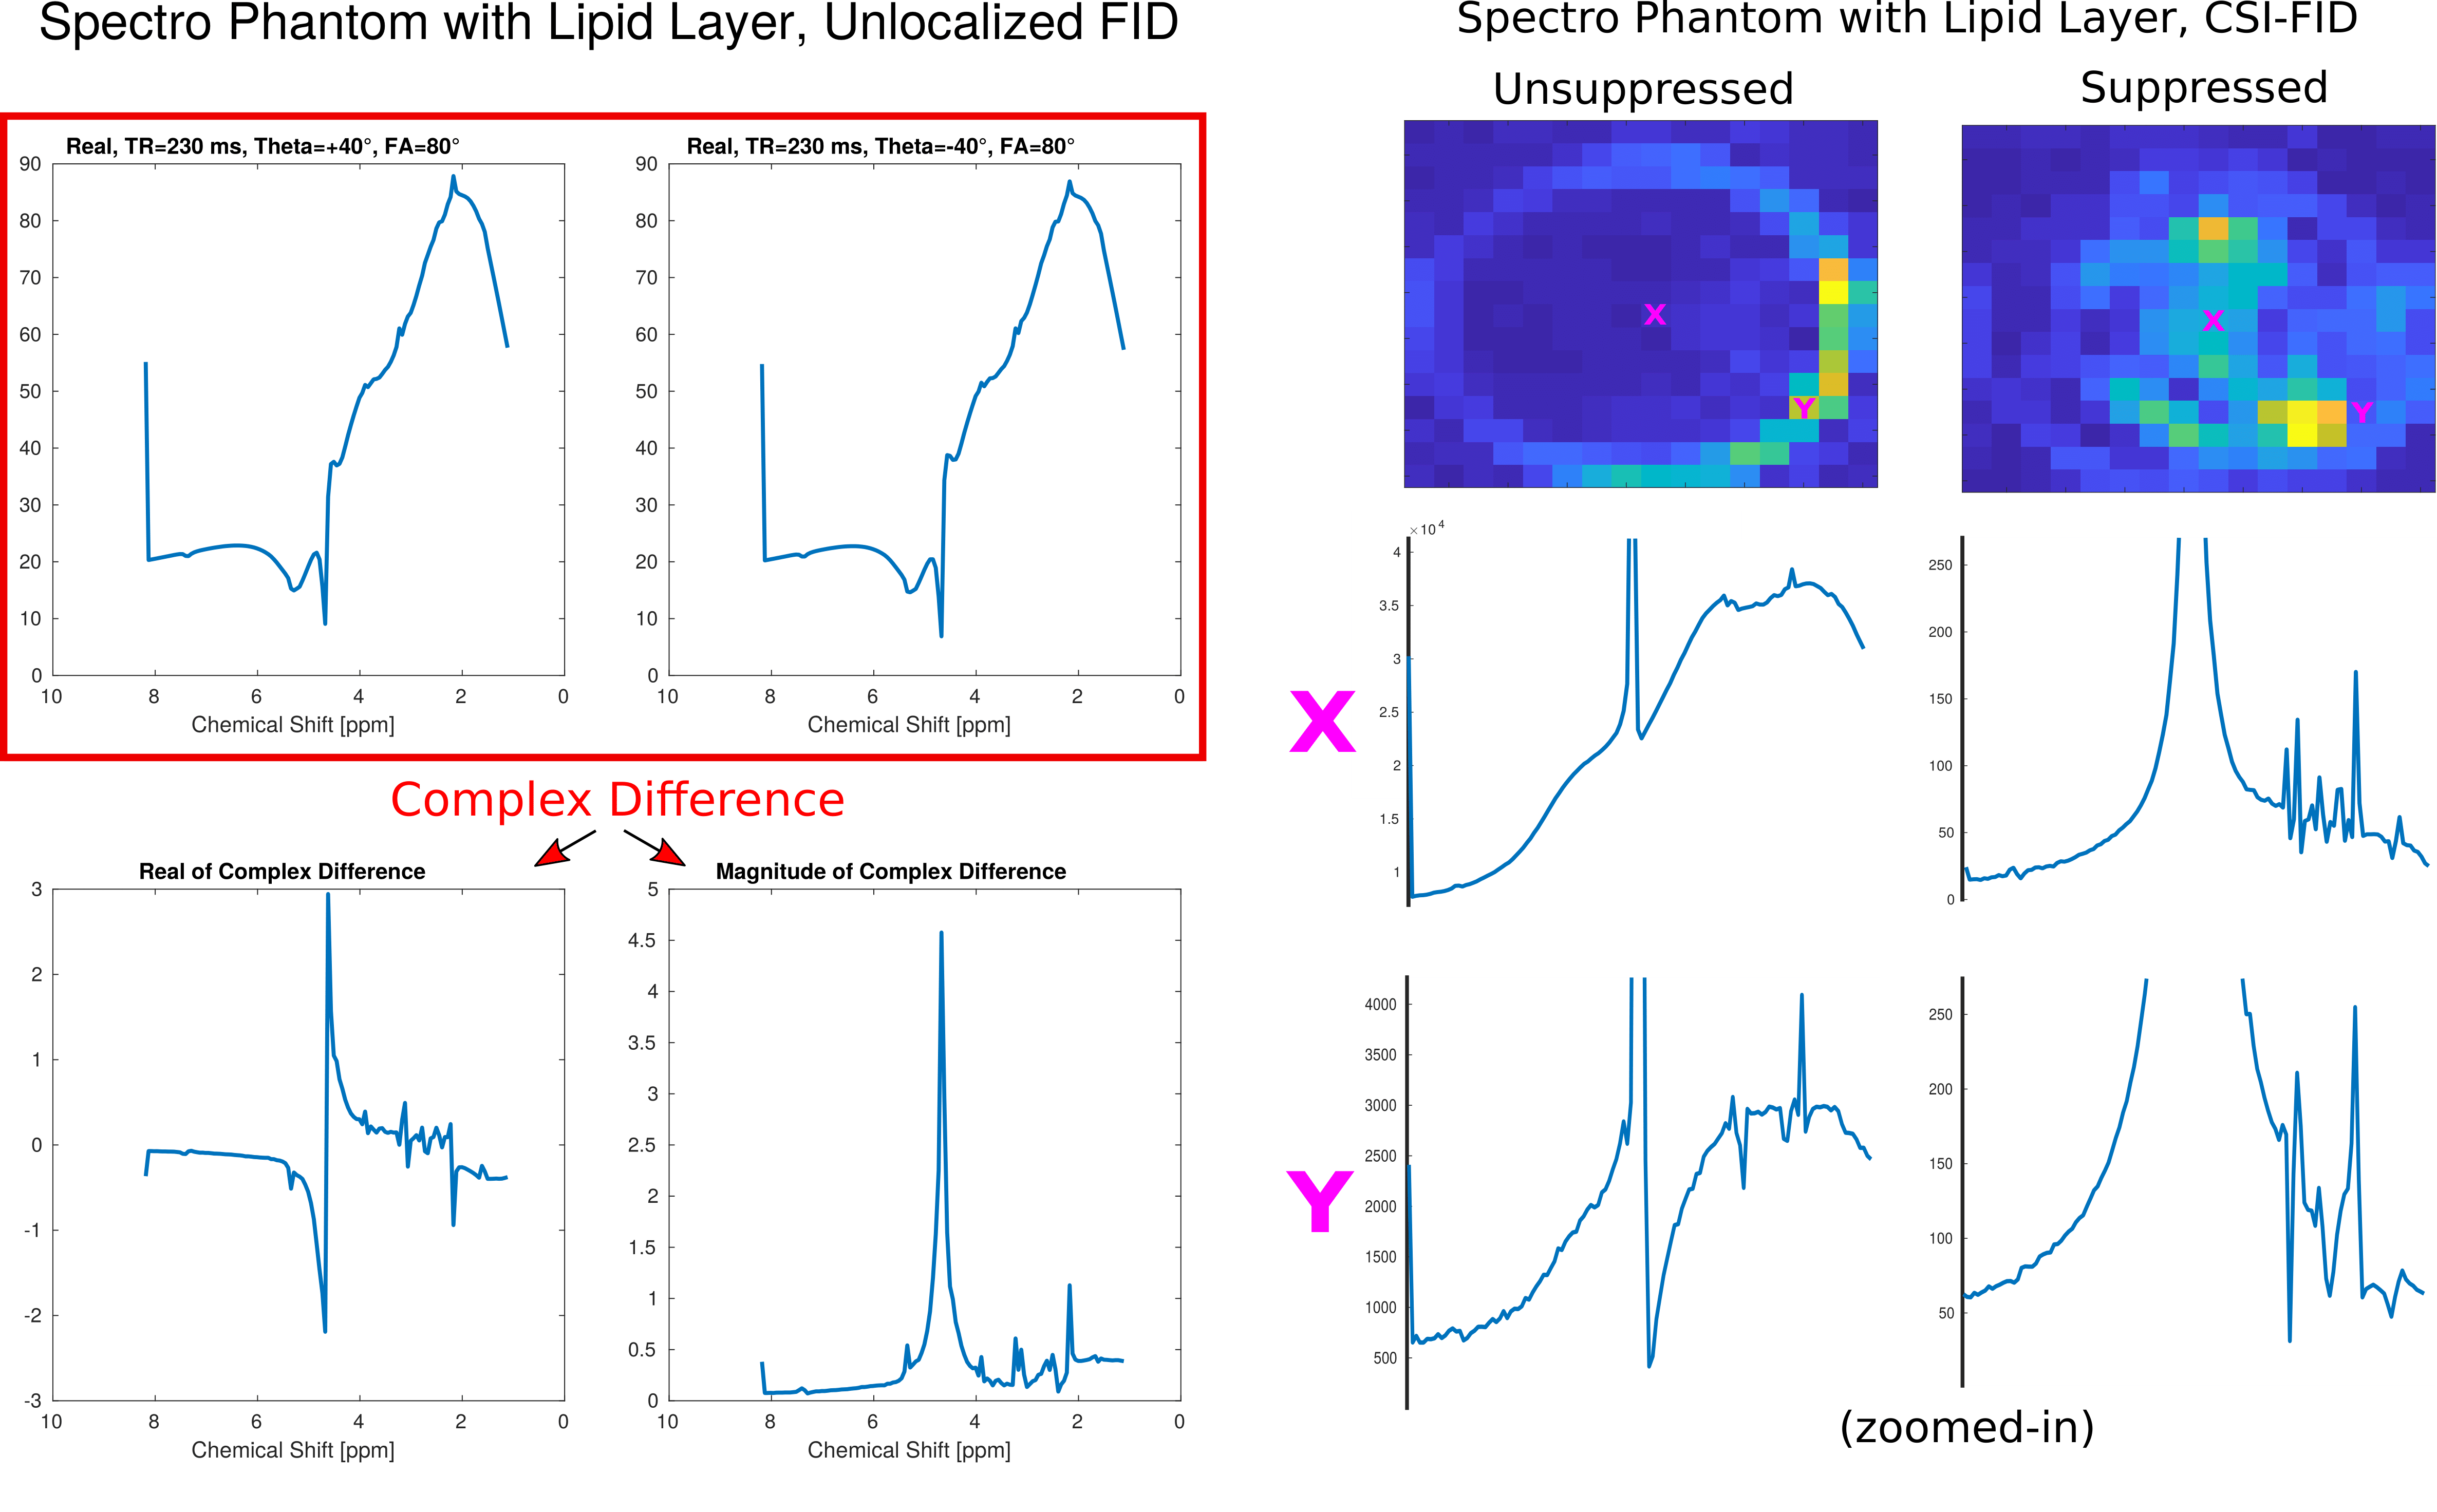
Figure 1, top shows pulse-acquire Bloch-simulation results of the first time point of long- and short-T2 components for traditional RF spoiling with short TRs and rather large FAs. By increasing the TR and the FA, it can be observed that at certain pulse phase increments short-T2 components can be cancelled by subtraction,Figure 1, bottom. Figure 2 shows simulated spectra before and after suppression, noised as well as noiseless. GRE imaging results and T2-maps of the T2-array of a NIST phantom are displayed in Figure 3 which demonstrates the excellent suppression (factor ~100 for shortest T2s) results of the method. The dashed line indicates the position of the line profile in Figure 4,left. Figure 4, right, shows how the signal changes for different T2s. Figure 5 shows MR spectroscopy results of the un-localized and the localized scan and the excellent recovery of lipid free spectra (~90% suppression efficiency) with good baselines, however at the cost of significantly reduced SNR since only ~5-10% of the original signal remains (given realistic T2 values).Discussion & Conclusion
Although the method has yet not been successfully tested in vivo, its advantages are numerous: 1) No additional radio frequency pulses are needed, i.e. no increased energy disposition and no pulse imperfections; 2) the phase of the excitation pulse is more accurate to set than the flip angle of any other potentially needed pulses; 3) the suppression is spectrally and spatially global, i.e., not dependent on the resonance band; 4) no 'co-suppressed' signals as in MEGA-editing, Fat-Sat or regularization algorithms since T2s of lipids are distinctively small; 5) the method is related to RF spoiling and easy to adapt and the post processing is straightforward. The main drawback of the method is the inefficiency of the obtained SNR. The second drawback is the motion sensitivity of the method since phase changes in the observed signal are of the same order of magnitude as the desired phase modulations.We presented an elegant and easy to implement method to remove/suppress short T2 components such as lipids by merely altering the excitation pulse phase of a steady-state sequence, without the need of additional pulses or hardware. Additional ways to improve the SNR inefficiency are however required to capitalize from the numerous advantages of this potential tool for in vivo applications. For non-localized whole-brain MRS the method could be already relevant8.
Acknowledgements
Austrian Science Fund (FWF): Projekt number TAI-676References
1. Tkáč I, Deelchand D, Dreher W, et al. Water and lipid suppression techniques for advanced 1 H MRS and MRSI of the human brain: Experts' consensus recommendations. NMR Biomed. 2021;34(5):e4459. doi:10.1002/nbm.4459
2. Bley TA, Wieben O, François CJ, Brittain JH, Reeder SB. Fat and water magnetic resonance imaging. J Magn Reson Imaging. 2010;31(1):4-18. doi:10.1002/jmri.21895
3. Zur, Y., Wood, M.L. and Neuringer, L.J., Spoiling of transverse magnetization in steady-state sequences. Magn. Reson. Med. 1991, 21: 251-263. https://doi.org/10.1002/mrm.1910210210
4. Wang X, Hernando D, Reeder SB. Phase-based T2 mapping with gradient echo imaging [published correction appears in Magn Reson Med. 2022 Aug;88(2):1015]. Magn Reson Med. 2020;84(2):609-619. doi:10.1002/mrm.28138
5. Bieri O, Scheffler K, Welsch GH, Trattnig S, Mamisch TC, Ganter C. Quantitative mapping of T2 using partial spoiling. Magn Reson Med. 2011;66(2):410-418. doi:10.1002/mrm.22807
6. Tamada D, Field AS, Reeder SB. Simultaneous T1 -weighted and T2 -weighted 3D MRI using RF phase-modulated gradient echo imaging. Magn Reson Med. 2022;87(4):1758-1770. doi:10.1002/mrm.29077
7. https://www.nist.gov/publications/magnetic-resonance-imaging-biomarker-calibration-service-proton-spin-relaxation-times
Figures
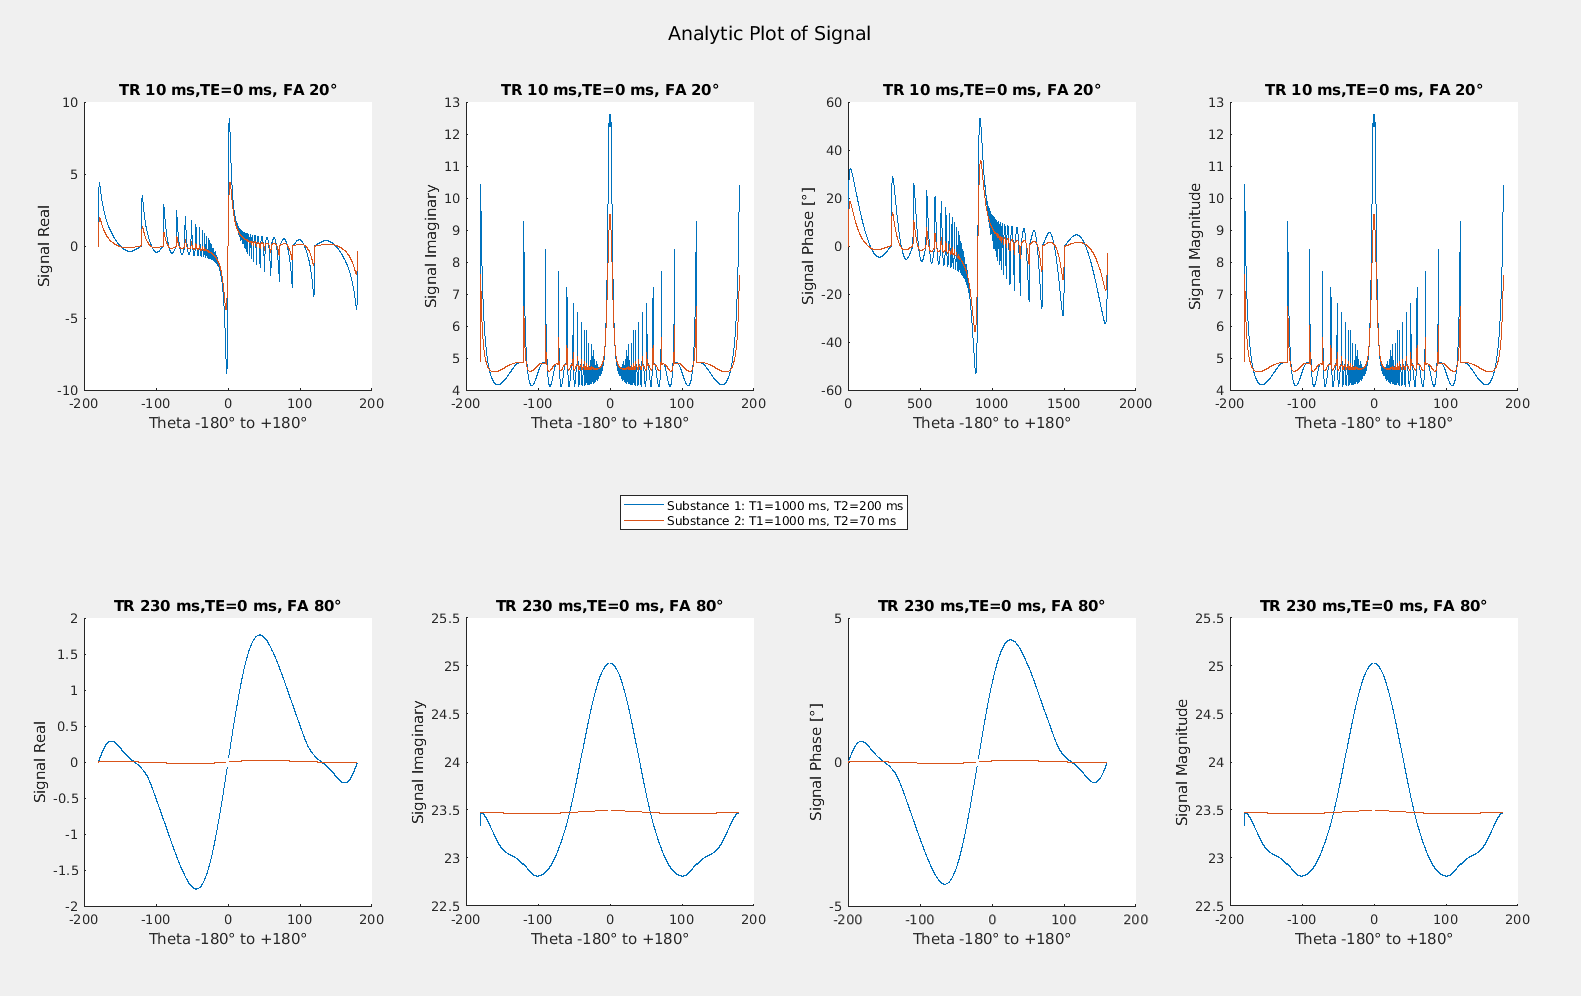
Figure 1, Top: Bloch simulation results for traditional RF spoiling
Bottom: For longer TRs, complex subtraction of two data points can null the signal of short-T2 components. The reason why an invariance of the signal across all values for $$$\theta$$$ from -180° to +180° is required and not, e.g. for just two selected ones $$$\theta$$$ and $$$\theta$$$ where the lipid signal would have two null points, is, that at later time (echo) points the lipid signal would not cancel via subtraction because the signal curve shifts vertically as well as horizontally.
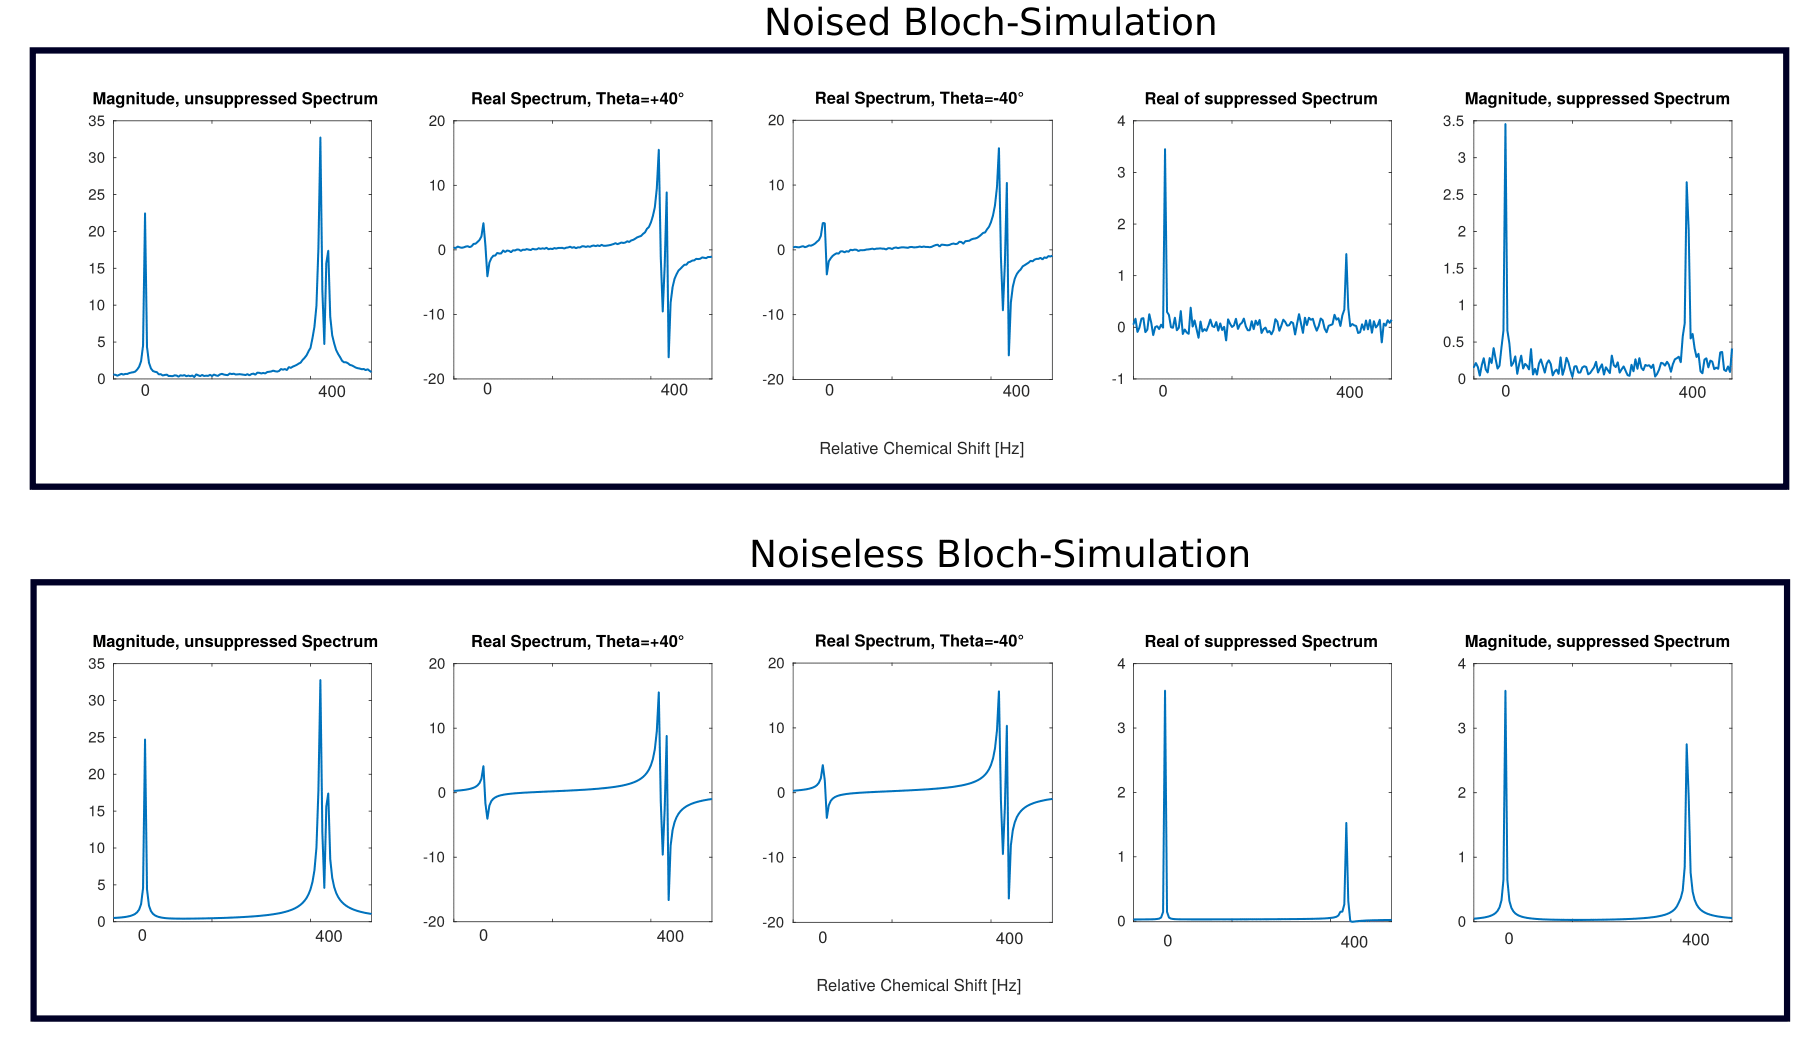
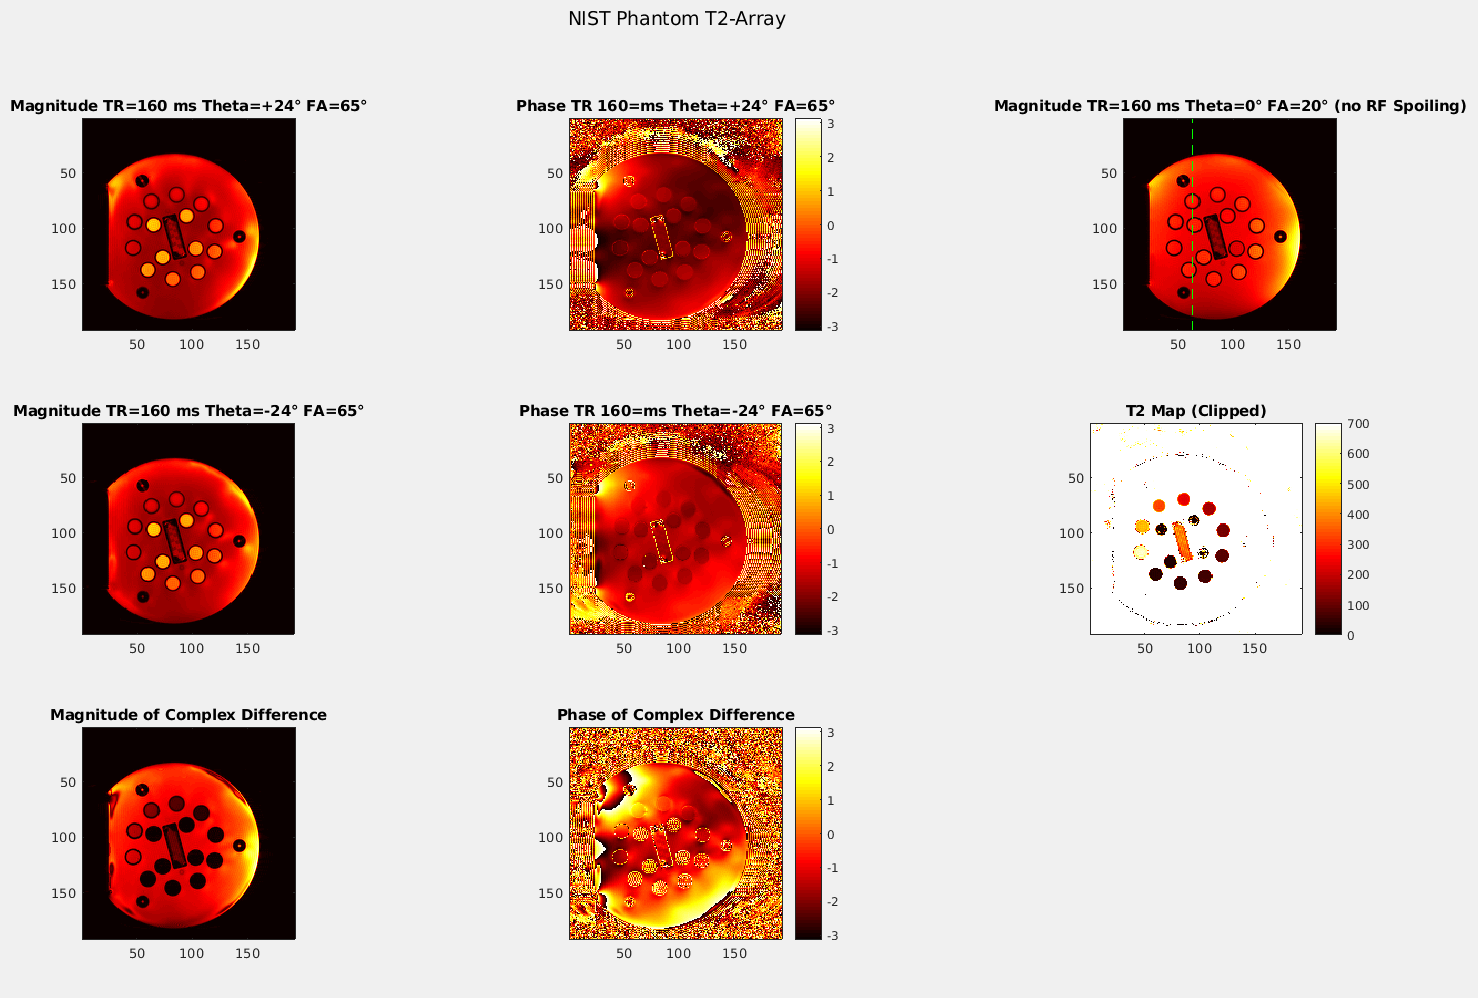
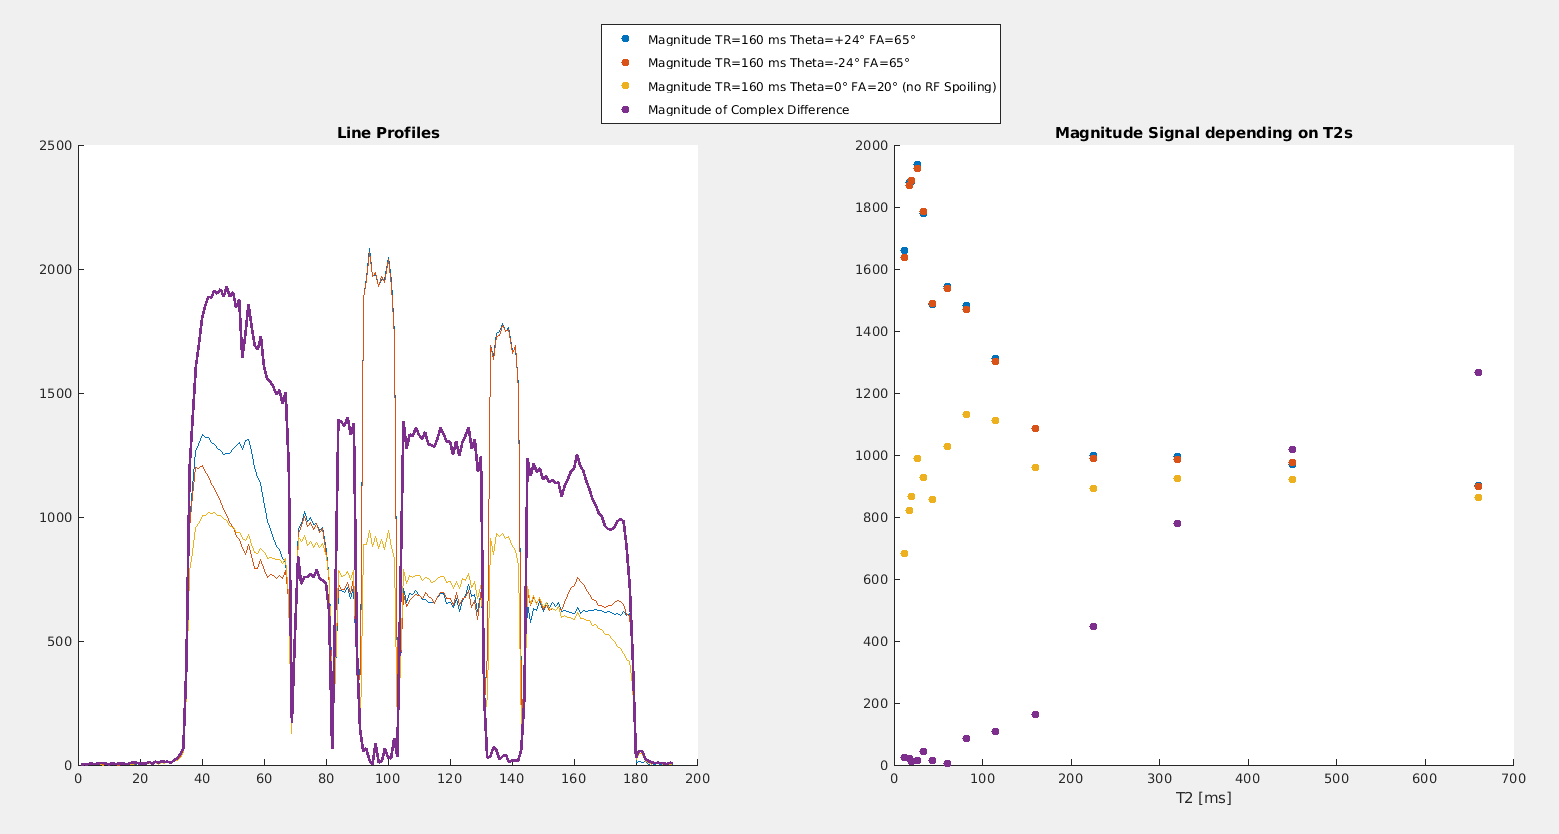
Figure 4, left: The left vial is only partly suppressed due to the longer T2 but the other two are perfectly suppressed according to their T2 values. Outside of the vials: The signal is nearly doubled which is related to the very long T2 >700 ms inflicting strong phase changes. Since the signal phases in RF spoiling are a function of T2s, the complex subtraction is an actual averaging!
Right: Signal versus T2s, the blue and red dots are similar to the effect of traditional RF spoiling compared to the unspoiled case and their difference shows the suppression of very short T2s.