3689
Feasibility of a multi-site and cross-platform liver 31P MRSI processing pipeline for three 7T clinical MRI vendors1University of Cambridge, Cambridge, United Kingdom, 2Center for Image Sciences, University Medical Center Utrecht, Utrecht, Netherlands, 3Department of Radiology and Nuclear Medicine, Amsterdam UMC, Amsterdam, Netherlands, 4IMAGO7 Research Foundation, Pisa, Italy, 5Laboratory of Medical Physics and Magnetic Resonance, IRCCS Stella Maris, Pisa, Italy
Synopsis
Keywords: Spectroscopy, Non-Proton
We present preliminary baseline results from three-vendor 7 T MRSI for applications on liver 31P MRS. Liver scans were performed on 21 healthy volunteers, at 4 sites and 3 different 7T MR scanner platforms. Data were analysed using a new Matlab pipeline combining the best methods from our labs. This pipeline is operator independent and we report here the liver metabolites as ratios of PME/PDE and Pi/ATP concentrations. The cross-site average PME/PDE was 0.63 ± 0.12, and the cross-site average Pi/ATP was 0.76 ± 0.11. This compares favourably with literature reports [Purvis et. al., 2017].
Introduction
31P MRS is a non-invasive technique that provides a unique view into energy metabolism and membrane turnover in human tissues. It has been used to study the metabolism of the liver over a wide range of pathologies, including liver metastases [D.A. Kooby, et. al., 2000, G. Brinkmann, et. al., 1995]. Abnormalities in 31P MR spectra of liver metastases include an increase of phosphomonoesters (PMEs) [W. Negendank, et. al., 1992]. As part of the European H2020 Non-Invasive Chemistry Imaging (NICI) project, we have developed a processing pipeline to quantify 31P metabolite concentrations in healthy volunteers and patients with liver metastases from primary colorectal, pancreatic or gastrointestinal cancers, from 3D 31P MRSI data from all sites participating in the NICI project in a standardized manner.In this study, we outline the methods for post-processing of 31P MRSI data from three 7T MRSI clinical vendor’s platforms. We show preliminary results from 21 healthy volunteers scanned across different sites and assess preliminary baseline values of PME/PDE and Pi/ATP ratios, which will be used to evaluate abnormalities in patients with liver metastases in the near future.
Methods
Three different 7T MRI scanners and four different combinations of transmit and receive 1H/31P coils have been used to gather phantom and volunteer data for this study. In Cambridge, United Kingdom, a Siemens 7T MR scanner has been used(Siemens Healthineers, Erlangen, Germany), with a surface dipole array coil with 8 1H/31P Tx/Rx dipoles and 16 additional 31P Rx loops (Tesla DC, Netherlands). In Pisa, Italy, a GE 7T MR scanner has been used(General Electrics, USA), with a whole-body birdcage 31P Tx coil and a 24-channel 31P Rx array(Tesla DC, Netherlands), combined with 8 1H Tx/Rx dipoles. In Utrecht and Amsterdam, the Netherlands, a Philips 7T MR scanner (Philips, Best, Netherlands) was used. In Utrecht, a whole-body birdcage 31P Tx coil and a 16-channel 31P Rx array, combined with 8 1H Tx/Rx dipoles has been used [Q. van Houtum, et. al., 2019] and in Amsterdam a whole-body birdcage 31P Tx coil and a 4-channel 31P Rx array, combined with 8 1H Tx/Rx dipoles been used (Tesla DC, Netherlands).The MRSI acquisition parameters for each site are detailed in Table 1. All 3D MRSI sequences were performed with a rectangular excitation pulse with the carrier frequency set to PCr. All B1 calibrations were done at liver depth on the same phantom in Cambridge, Amsterdam and Pisa (Figure 4) with a method described [Q. van Houtum, et. al., 2019] in Utrecht. The excitation bandwidth was 1.86 kHz in Amsterdam, 3 kHz in Utrecht, 1 kHz in Cambridge and 2 kHz in Pisa.
Participants: A total of 21 healthy volunteers were recruited to the NICI project technical validation study. They were scanned at the following sites: Utrecht (4 females, 7 males, 25-62 years), Amsterdam (4 females, 1 male, 24-44 years), Pisa (2 female, 2 males, 25-46 years), and Cambridge (1 male, 47 years).
Reproducibility: All the subjects in Utrecht were scanned twice on the same day. (An analysis of these scans using different software was reported previously [Lieke et. al.,2022].) In Amsterdam and Pisa, 1 volunteer was scanned twice.
Data were analysed using our new cross-vendor automated processing pipeline, outlined in Figure 1. The 31P MRSI data are first read into memory using a vendor-specific function. Subsequent processing uses the same analysis including Hamming weighting correction, Principal Component Analysis (PCA)-based denoising [M. Froeling, et. al., 2021], Whitened Singular Value Decomposition (WSVD) channel combination and AMARES quantification with OXSA[Purvis et. al., 2017].
Concentrations maps of PCr and γ-ATP are reported.
For later quantitative analysis, we compute metabolite concentration ratios: PME/PDE, i.e. (PE+PC)/(GPE+GPC), and Pi/ATP, i.e. Pi/((α-ATP + γ-ATP)/2) (averaged for several liver voxels with high SNR).
We are currently in the process of calibrating the systems at each site using a standardized phantom(figure 4). We expect this to enable absolute quantification of all metabolite concentrations as previously reported[Purvis et al, 2019].
Results
Figure 2 shows PCr and γ-ATP metabolite maps and liver 31P MR spectra from the 4 different sites acquired on four different volunteers.Figure 3 summarizes the PME/PDE and Pi/ATP ratio values for each site. The mean PME/PDE and Pi/ATP values are shown as bars with assiocated mean standard deviations. The different markers represent data from different sites. Results on reproducibility are also reported in this figure with an additional marker.
Figure 4 shows the standardized phantom used in the study, the dipole array coil used in Cambridge and a B1 map.
Discussion & Conclusion
This study presents the results of a standardized analysis of 7T 31P MRSI data from 21 healthy volunteers scanned at four sites with scanners from three vendors.As seen in Figure 2 the SNR differs between sites because of the different coil designs.
The cross-site average PME/PDE was 0.63 ± 0.12, and the cross-site average Pi/ATP was 0.76 ± 0.11.PME/PDE, which agrees with literature values. Data reproducibility efficiency has been evaluated with the mean standard deviation across all PME/PDE and Pi/ATP values of all sites where a test-retest analysis has been performed. Mean standard deviation for PME/PDE is 0.08 and 0.04 for Pi/ATP.
Acknowledgements
This project has received funding from the European Union’s Horizon 2020 research and innovation programme under grant agreement No801075. CTR was funded by a Sir Henry Dale Fellowship from the Wellcome Trust and the Royal Society [098436/Z/12/B]. This study was supported by the NIHR Cambridge Biomedical Research Centre and an MRC Clinical Research Infrastructure Award for 7T. This work was supported by Innovate UK [10032205] under the Guarantee Scheme relating to the EU Horizon Europe project MITI [101058229].
References
van den Wildenberg L, Gursan A, Seelen LWF, et al. Test-retest reliability of in-vivo 31P MRSI of the whole human liver at 7 tesla using a 31P whole-body transmit coil and 16-channel receive array. In: Proceedings of the 2022 Joint Annual Meeting ISMRM-ESMRMB & ISMRT 31st Annual Meeting. ; 2022:2291.
Veraart J, Novikov DS, Christiaens D, Ades-aron B, Sijbers J, Fieremans E. Denoising of diffusion MRI using random matrix theory. Neuroimage. 2016;142:394-406. doi:10.1016/j.neuroimage.2016.08.016
M. Froeling, J. J. Prompers, D. W. J. Klomp, and T. A. van der Velden, PCA denoising and Wiener deconvolution of 31P 3D CSI data to enhance effective SNR and improve point spread function. Magn. Reson. Med. vol. 85. pp. 2992–3009. 2021.
Ria Forner, Jabrane Karkouri et. al., B1 efficiency of a dipole array coil for body application. In: Proceedings of the 2022 Joint Annual Meeting ISMRM-ESMRMB & ISMRT 31st Annual Meeting. ; 2022:2291.
Purvis LAB, Valkovič L, Robson MD, Rodgers CT. Feasibility of absolute quantification for 31 P MRS at 7 T. Magn Reson Med. 2019 Jul;82(1):49-61. doi: 10.1002/mrm.27729. Epub 2019 Mar 20. PMID: 30892732; PMCID: PMC6492160.
Rodgers CT, Robson MD. Receive array magnetic resonance spectroscopy: Whitened singular value decomposition (WSVD) gives optimal Bayesian solution. Magn Reson Med. 2010 Apr;63(4):881-91. doi: 10.1002/mrm.22230. PMID: 20373389.
D.A. Kooby, K.L. Zakian, S.N. Challa, C. Matei, H. Petrowsky, H.H. Yoo, J.A. Koutcher, Y. Fong Use of phosphorous-31 nuclear magnetic resonance spectroscopy to determine safe timing of chemotherapy after hepatic resection Cancer Res., 60 (2000), pp. 3800-3806
G. Brinkmann, U.H. Melchert, W. Dreher, J. Brossmann, H. Tressing, C. Muhle, M. Reuter, M. Heller
Application of the maximum entropy method for evaluating phosphorus-31-magnetic resonance spectra in patients with liver metastases Invest Radiol., 30 (1995), pp. 150-155
W. Negendank, Studies of human tumors by MRS: a review, NMR Biomed., 5 (1992), pp. 303-324
Q. van Houtum, D. Welting, M. W. J. Gosselink, D. W. J. Klomp, C. S. Arteaga de Castro, and W. J. M. van der Kemp, Low SAR 31P (multi-echo) spectroscopic imaging using an integrated whole-body transmit coil at 7T. NMR Biomed. vol. 32, no. 12. p. e4178. 2019.
Purvis LAB, Clarke WT, Biasiolli L, Valkovič L, Robson MD, Rodgers CT. OXSA: An open-source magnetic resonance spectroscopy analysis toolbox in MATLAB. PLoS One. 2017 Sep 22;12(9):e0185356. doi: 10.1371/journal.pone.0185356. PMID: 28938003; PMCID: PMC5609763.
Figures
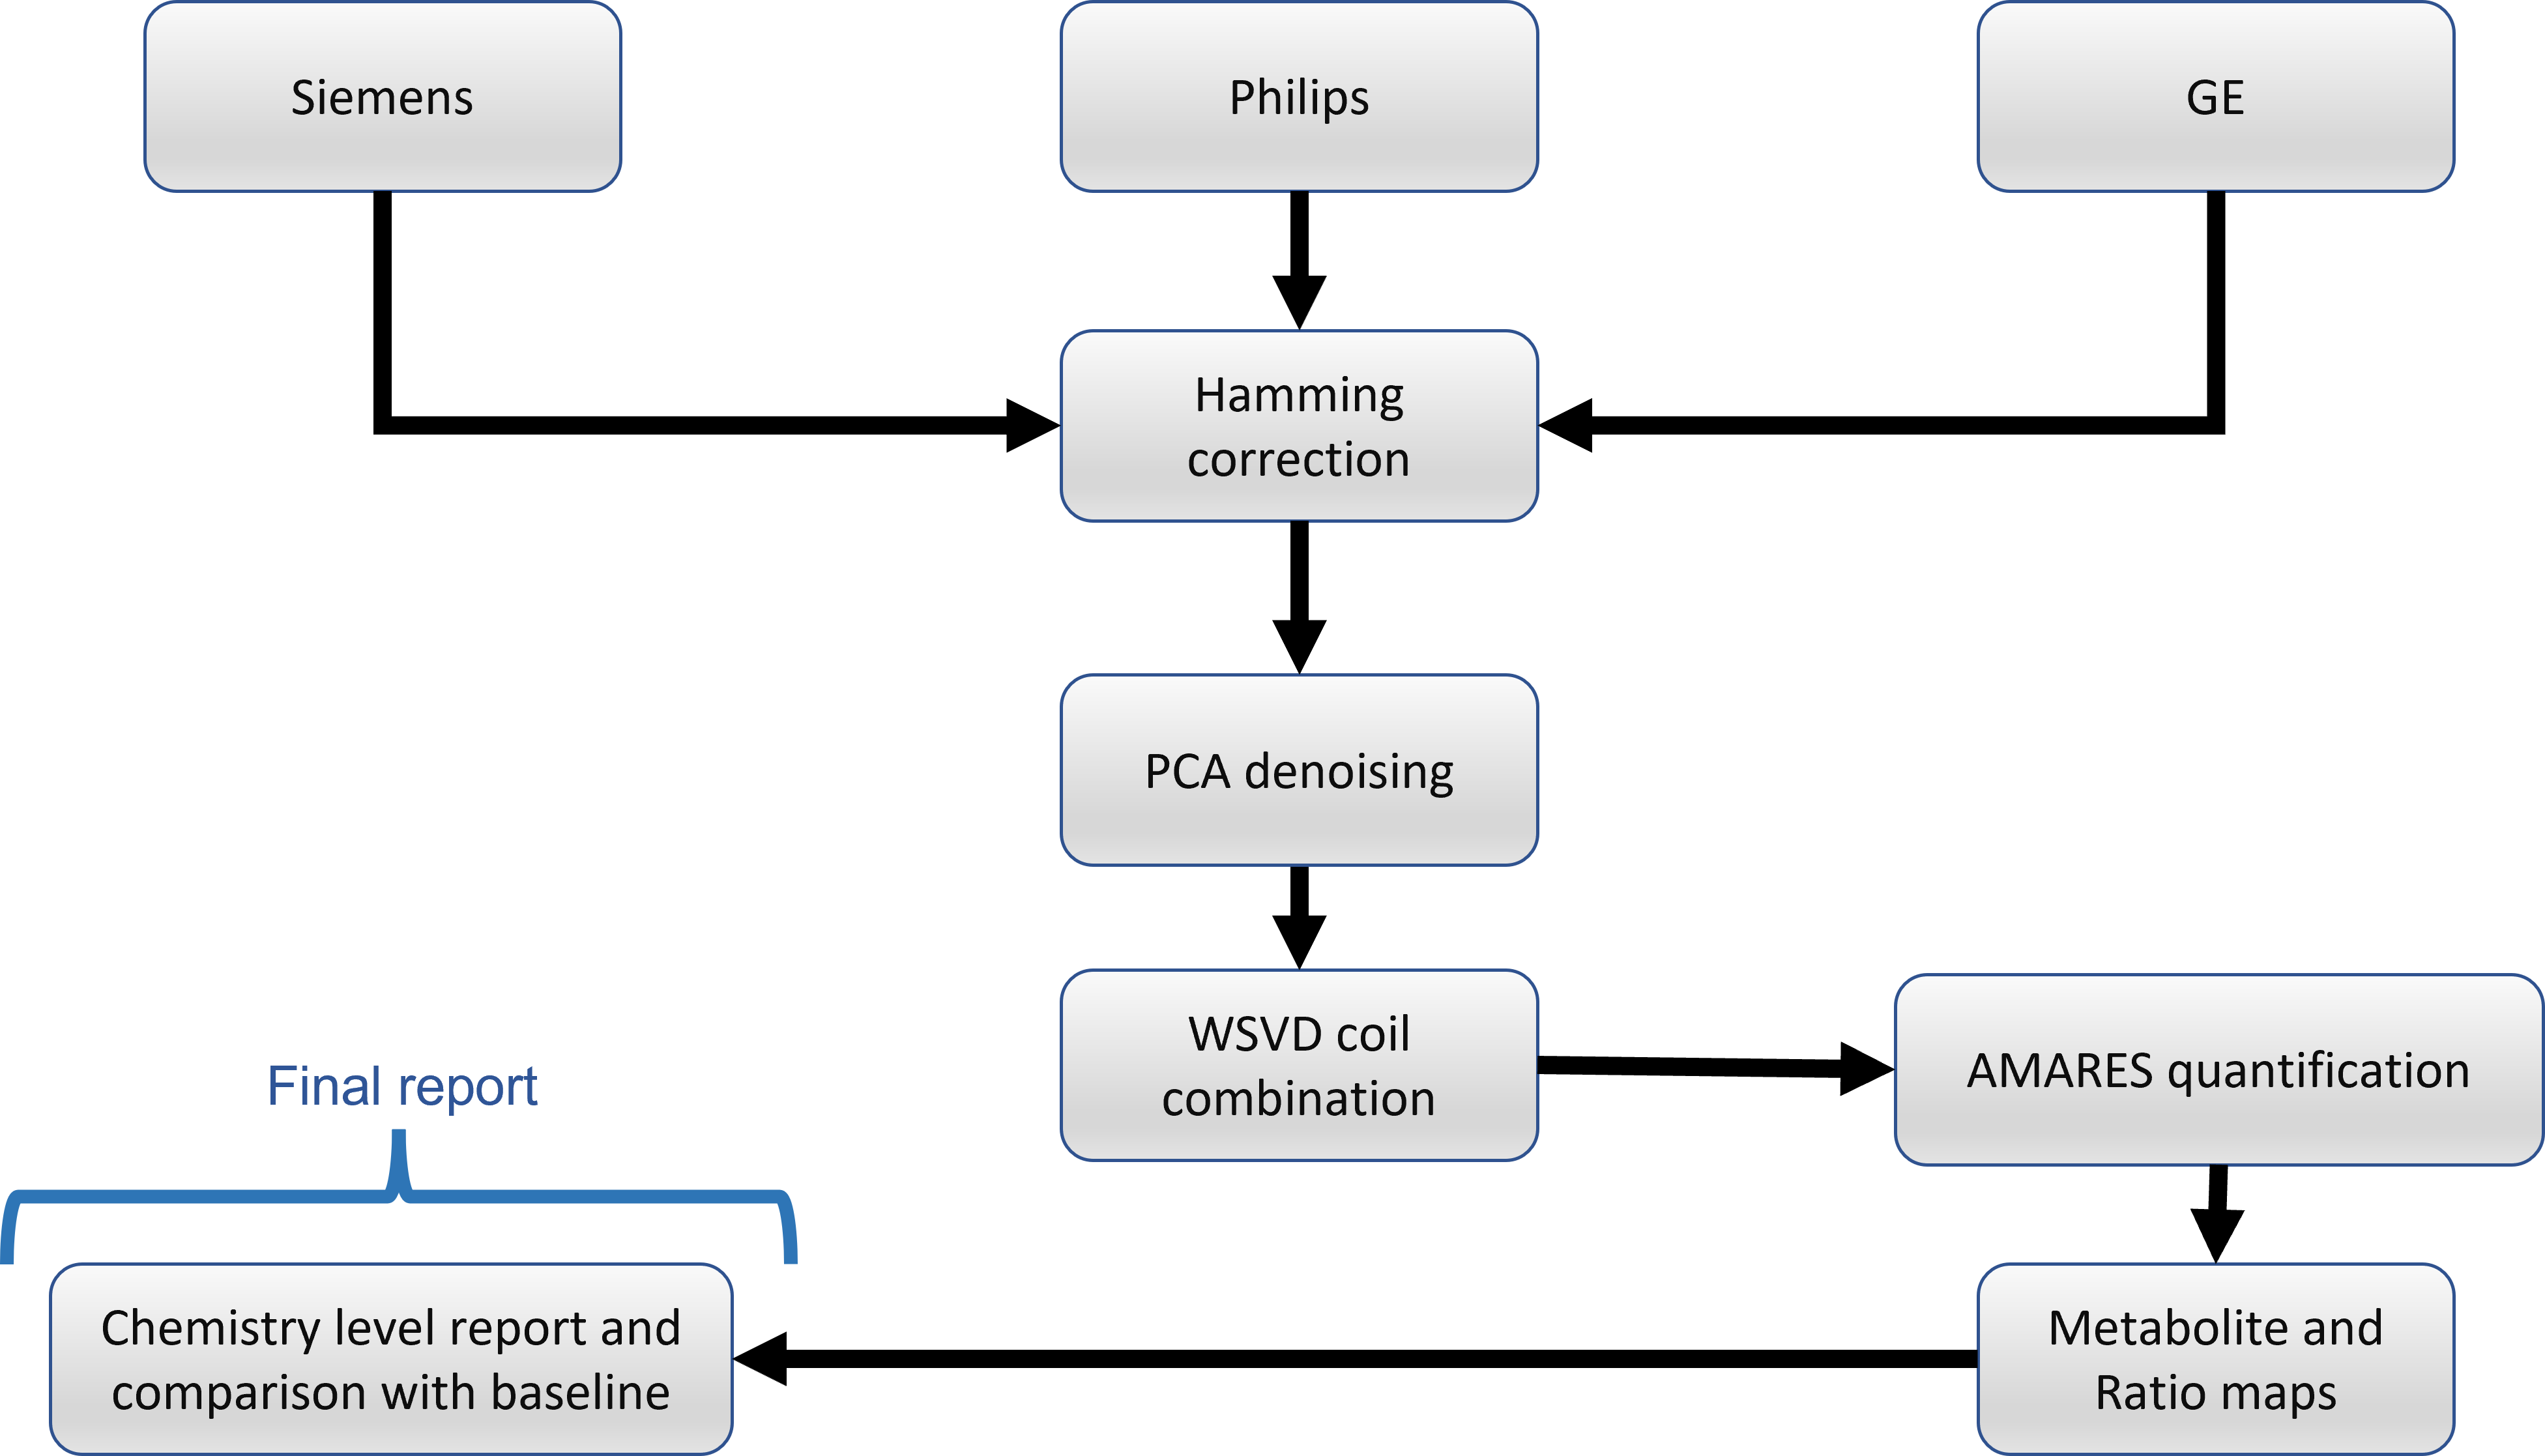
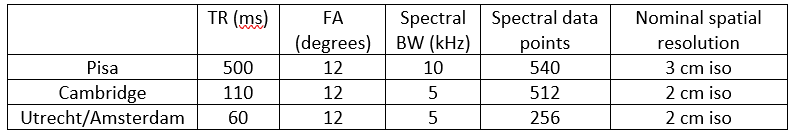
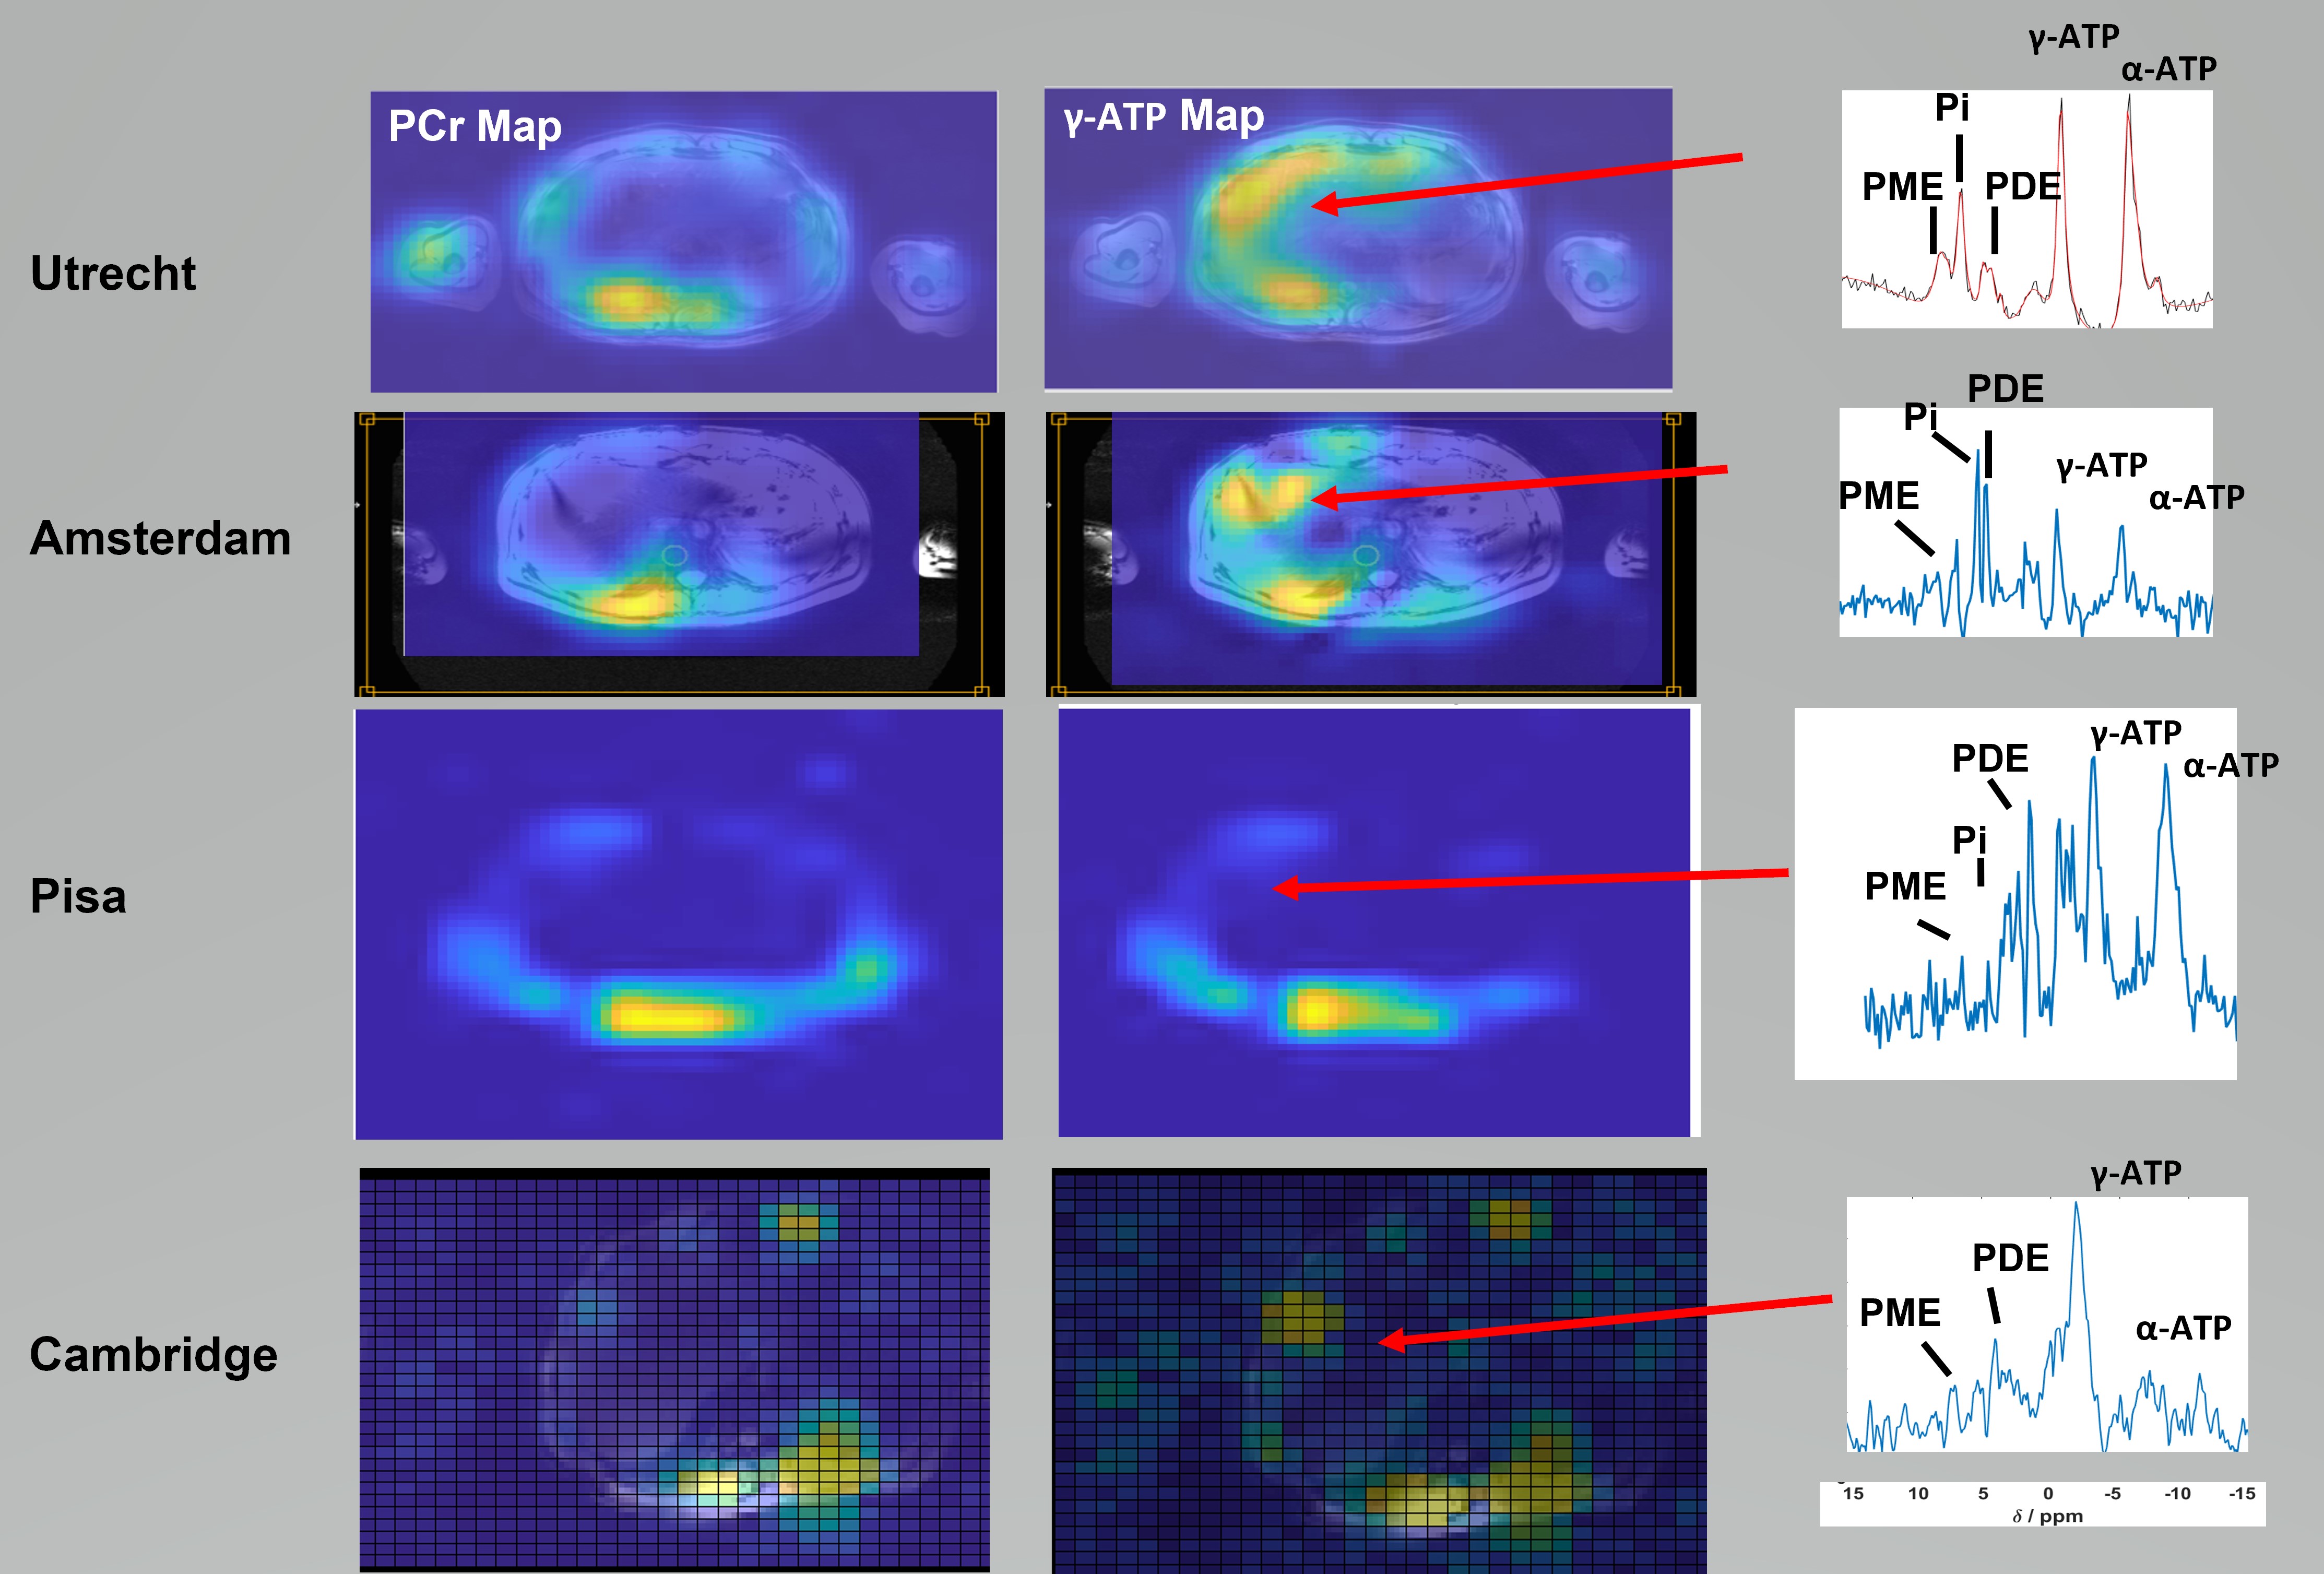
Figure 2: PCr and γ-ATP metabolite maps overlaid on a
localizer image for 4 different sites part
of the study in Utrecht, Amsterdam, Cambridge and Pisa and 3 different MR
scanners (Philips, GE, Siemens). A spectrum in the liver is shown on right for
each site too.
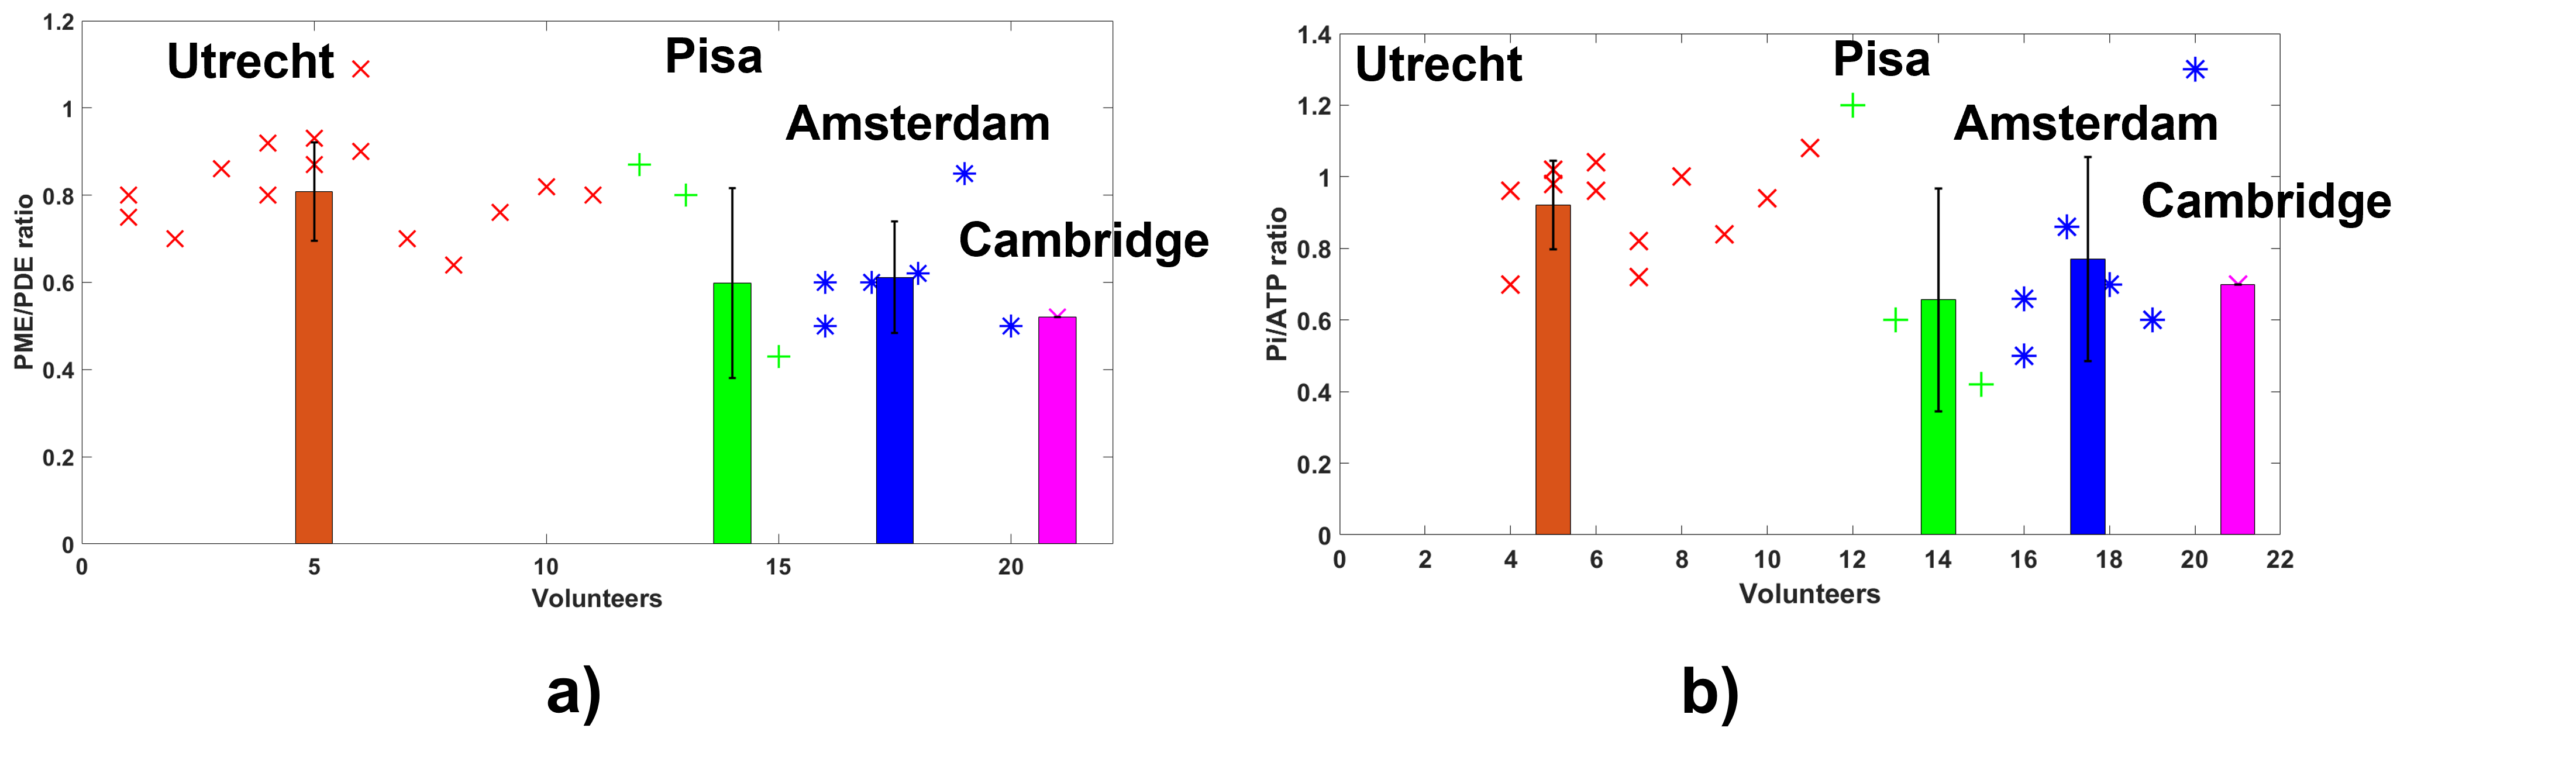
Figure 3: Comparison of the PME/PDE in a), Pi/ATP in b) ratio of the data between all sites in the liver. For each subject, the ratios were averaged across several voxels in the liver. Each marker corresponds to subjects scanned in one site. Each colours represents a different site. The markers are individual PME/PDE or Pi/ATP ratios per subject. The bars represent the mean PME/PDE ratio per site for all its subjects, and with its standard deviation. If a volunteer has been scanned twice, 2 markers will be present for 1 volunteers.
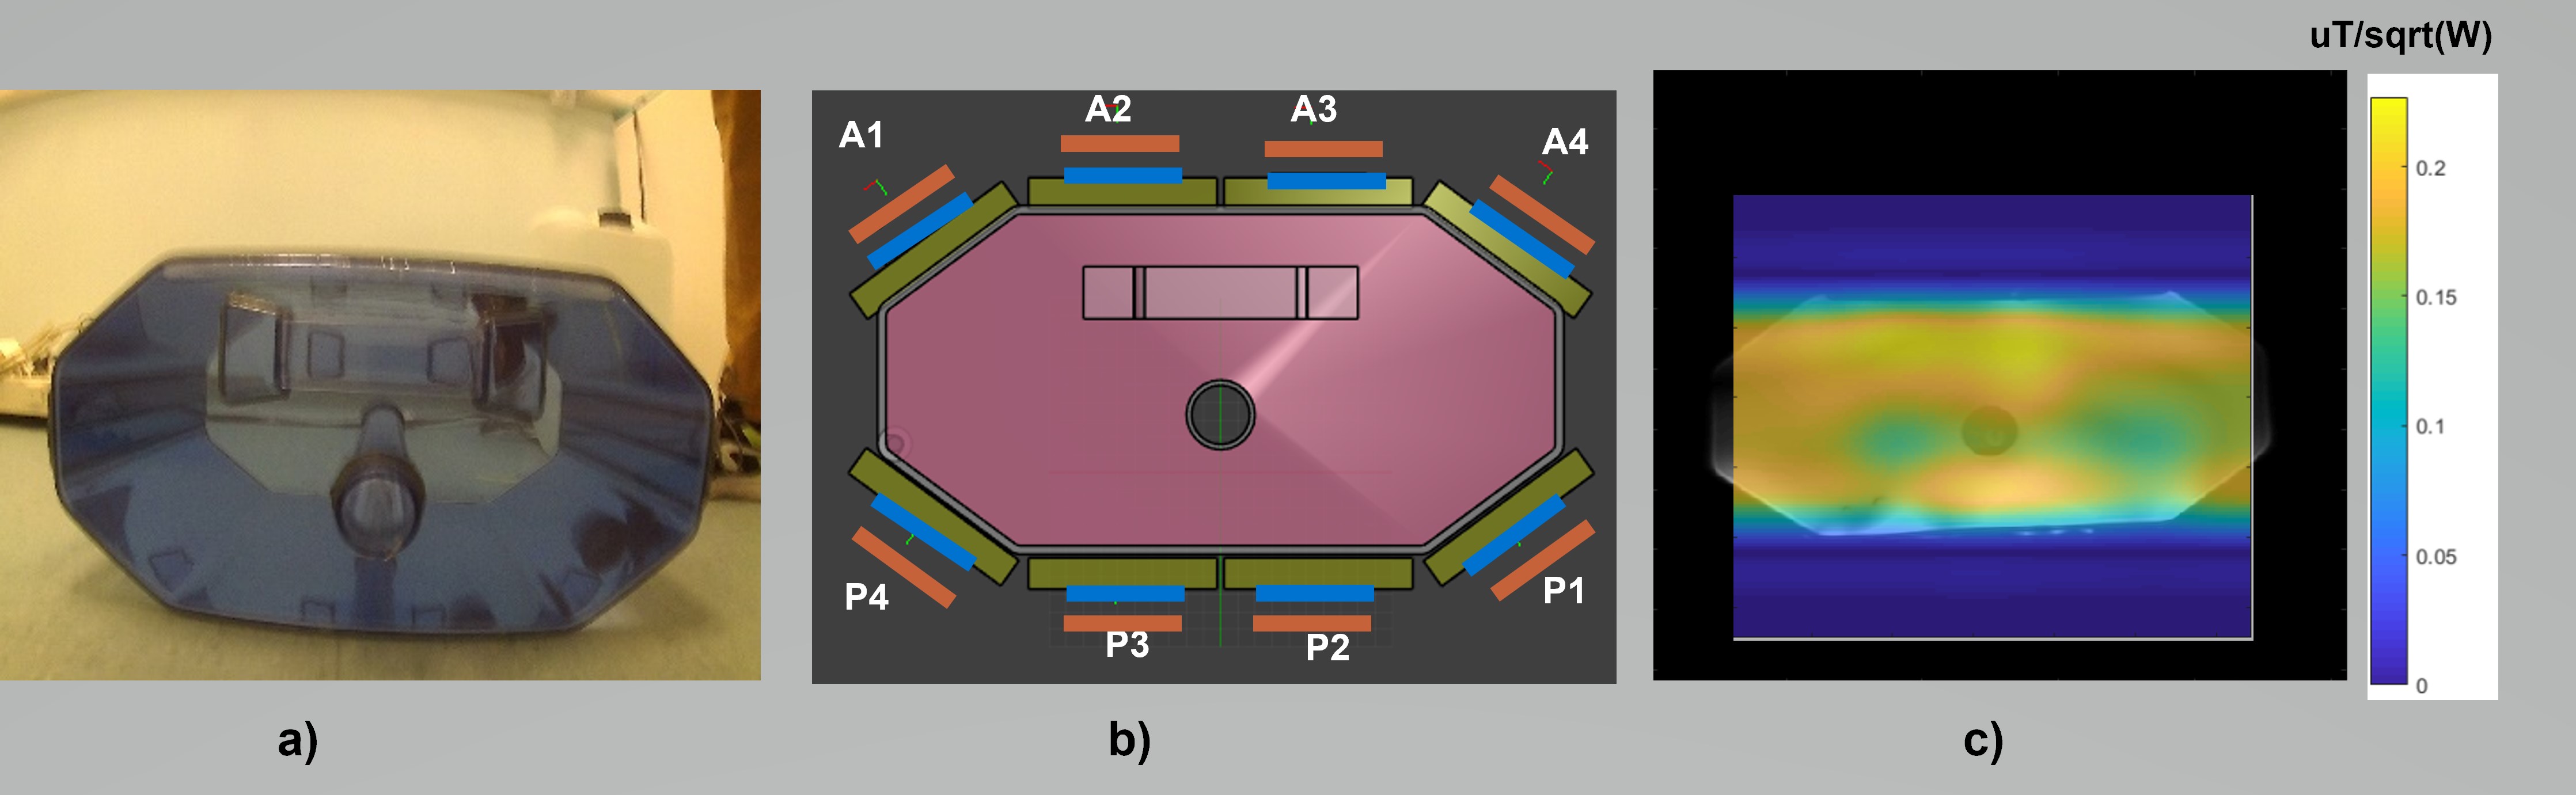
Figure 4: Standard phantom used in all sites with a hole in the middle at approximately liver depth in a), cartoon of the same phantom and placement of the coil in Cambridge shown in b). The coil contains an anterior part with 4 elements and a posterior part with 4 elements. In blue, these are the 31P dipoles and in orange the 1H ones. In c), a B1+ field map is shown overlayed with the image of phantom, with values reported in uT/sqrt(W).