3685
Short-TE semi-LASER 1H MRS of the primary motor cortex in ALS and controls at 7 Tesla1Centre for Advanced Imaging, The University of Queensland, Brisbane, Australia, 2ARC Training Centre for Innovation in Biomedical Imaging Technology, The University of Queensland, Brisbane, Australia, 3Queensland Brain Institute, The University of Queensland, Brisbane, Australia, 4School of Information Technology and Electrical Engineering, The University of Queensland, Brisbane, Australia, 5Neurology Department, Royal Brisbane and Women’s Hospital, Brisbane, Australia, 6Siemens Healthcare Pty Ltd, Brisbane, Australia, 7Centre for Magnetic Resonance Research, Department of Radiology, University of Minnesota, Minneapolis, MN, United States, 8School of Medicine, The University of Queensland, Brisbane, Australia, 9Brain and Mind Centre, The University of Sydney, Sydney, Australia, 10High-field MR Centre, Department of Biomedical Imaging and Image-guided Therapy, Medical University of Vienna, Vienna, Austria
Synopsis
Keywords: Spectroscopy, Spectroscopy, High-Field MRI, Magnetic Resonance Spectroscopy
Magnetic Resonance Spectroscopy (MRS) can offer a unique, non-invasive tool for measuring the neurochemicals in the brain in vivo. This technique may be useful for studying the ratio of metabolites in both health and disease, including in Amyotrophic Lateral Sclerosis (ALS), where differing neuronal populations of the motor cortex are impacted. This study aimed to develop a 7T MRS protocol for ALS patients and measured metabolite ratios in the upper and lower limb regions of the motor cortex at 7T in controls and in ALS. This has the potential to improve progression monitoring and diagnostic certainty in early-stage disease.Introduction:
Motor Neuron Disease (MND) is a group of syndromes characterised by the loss of motor neurons in the motor cortex and/or brain stem and spinal cord. Death of these motor neurones result in progressively worsening disability, leading to death. There are several MND subtypes with ALS (Amyotrophic Lateral Sclerosis) as the most common. Magnetic Resonance Spectroscopy (MRS) can offer a unique, non-invasive tool for measuring the neurochemical signatures of motor neurone loss in vivo. Preliminary evidence show that concentrations of certain metabolites may be affected in patients with MND, and that this could contribute to disease progression and/or disease heterogeneity [1]. However, few studies have considered 7T for estimating the metabolite changes in MND and none of these have considered the use of MRS to assess metabolite from brain regions that control movements of both upper and lower limbs [2]. This study aimed to develop a 7T MRS protocol for MND patients. We quantified metabolite ratios in the upper and lower limb regions of the motor cortex by using 7 Tesla(T) MRI, which provides increased spectral resolution in non-neurodegenerative controls (NCs) and ALS to explore if there is any relationship between the predominantly limb involvement and Glu/NAA and GABA/Glu ratios.Method:
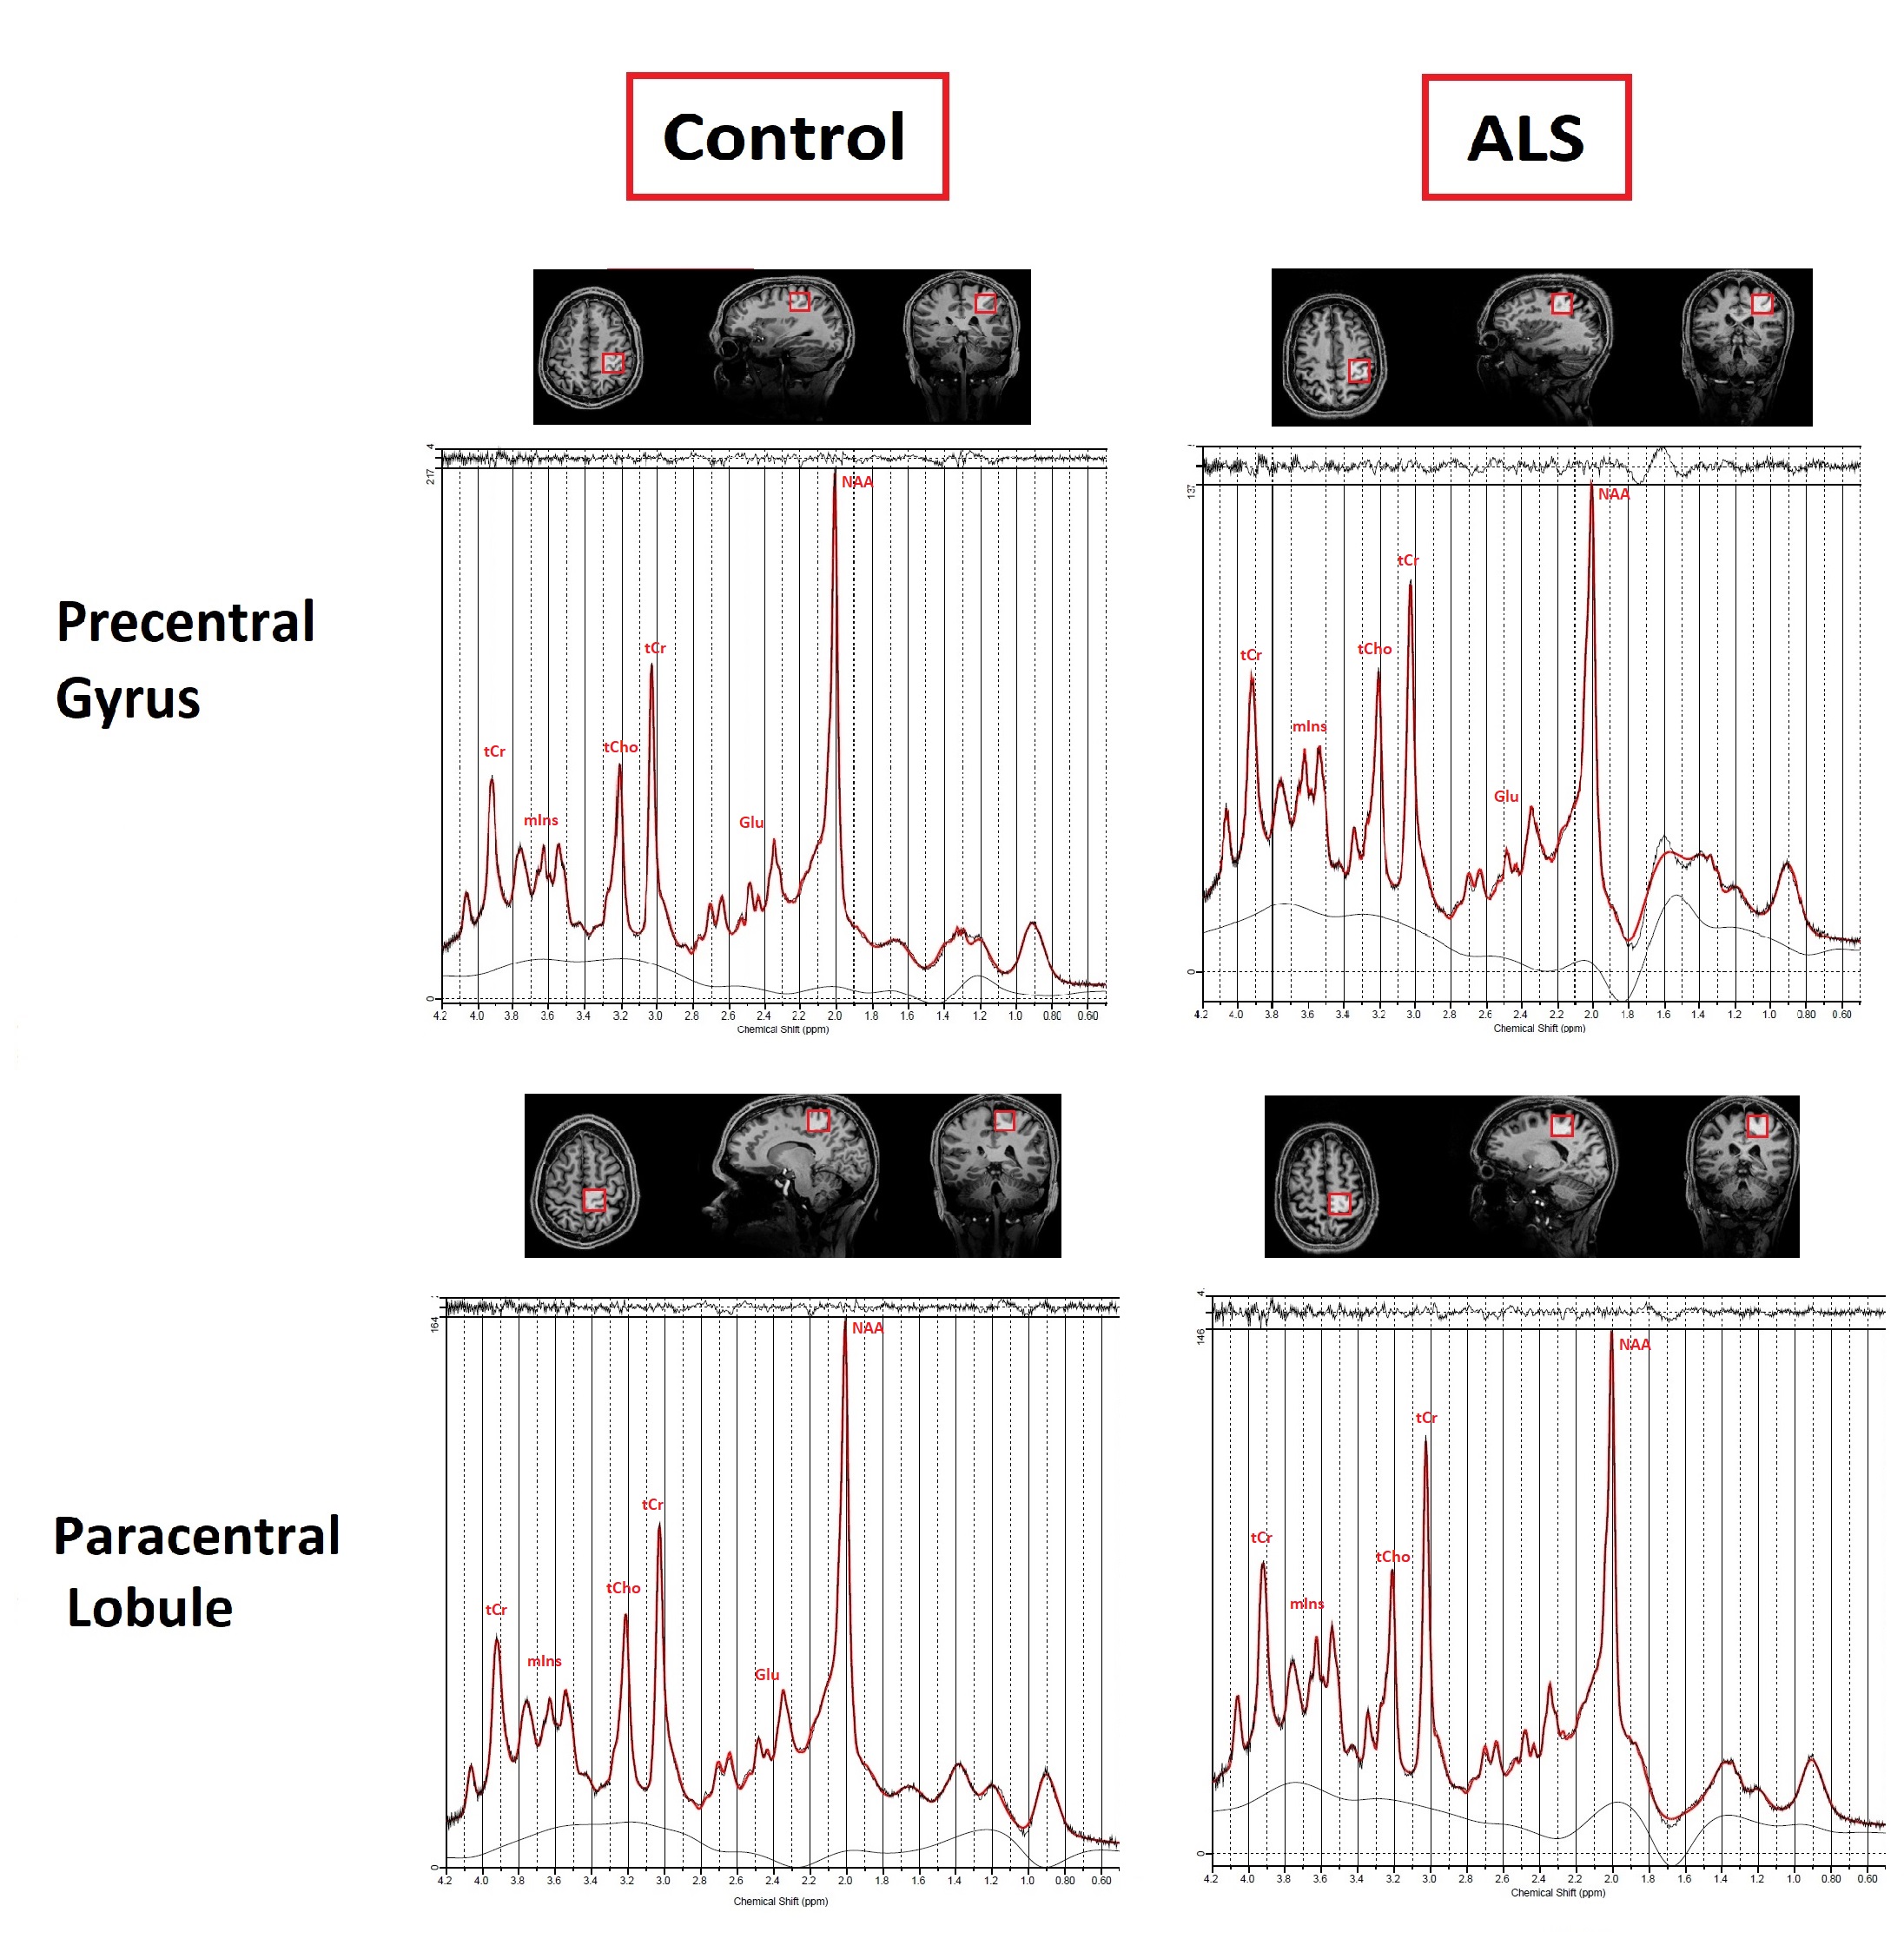
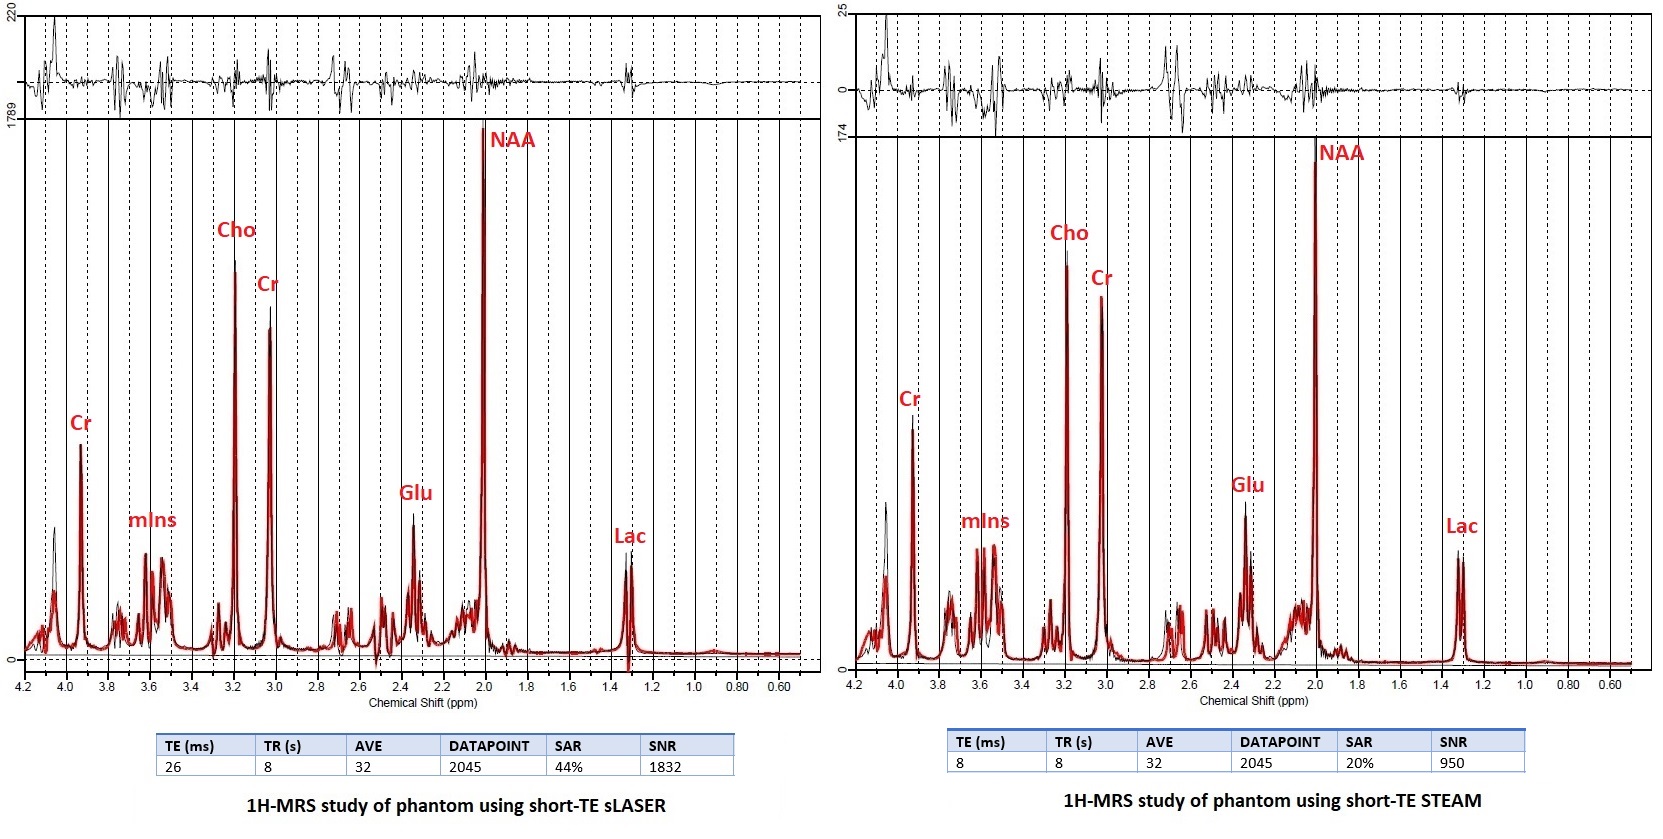
To select the sequence with the highest Signal-to-noise (SNR) we quantified brain metabolites in a brain-mimicking phantom (SPECTRE, Gold Standard Phantoms, UK). The phantom contains seven brain metabolites (Glutamine (Glu), N-acetylaspartate (NAA), γ-Aminobutyric acid (GABA), Creatin (Cr), Lactate (Lac), Choline (Cho), myoinositol (mIns)) at physiological concentrations and pH. Short-TE STEAM[3] and semi-LASER[4, 5]protocols were run using the following parameters: TR=8s, TE=8 ms, mixing time (TM)=32 ms, 32 averages, TA=3 min for STEAM and TR=8s, TE=26 ms, 32 averages, TA=5 min for sLASER. Acquired spectra were compared in terms of SNR, detecting J-coupled peaks separately and higher peak intensity. Four subjects (3 NCs, [3 male, aged 30,31,50]), 1 patient with ALS [F, 49]) were scanned using a 7T whole-body Siemens MAGNETOM research scanner (Siemens Healthcare, Erlangen, Germany) and 1-Transmit 32-receive head coil (Nova Medical, Wilmington, MA, USA). The patient presented with unilateral lower limb weakness and no upper limb involvement; symptom onset was 27 months prior to assessment. Participants underwent a 3D T1-weighted MP2RAGE to position the voxels and for tissue segmentation (0.75mm isotropic voxel size, TR=4300 ms, TI1/TI2 =840/2370 ms, TA=6 mins, FA=5°). Single voxel MR spectra were acquired from four voxels (25×25×25 mm3) in the precentral gyrus (region related to upper limb) and paracentral lobule (region related to lower limb) on both hemispheres in NCs and from 2 voxels (right precentral gyrus and paracentral lobule) in ALS: the contralateral side of the affected limb (Figure-1).FASTMAP[6] was used for B0 shimming. Metabolite and non-water suppression spectra were collected using the optimised semi-LASER sequence identified in the phantom experiments. The summed spectra were processed and analysed in MATLAB (v.R2022a) using Osprey(v.2.2.0) MRS analysis toolbox[7]. Metabolites signals were quantified with LCModel (v6.3)[8]. The basis set used contained 19 simulated metabolites and a measured macromolecule spectrum[9]. The metabolite ratios with total creatine (tCr; creatine+phosphocreatine), Glu/NAA, and GABA/Glu were reported for all comparisons. We estimated the correlation of left versus right hemisphere metabolite ratios as an estimate of the robustness of the protocol.Results:
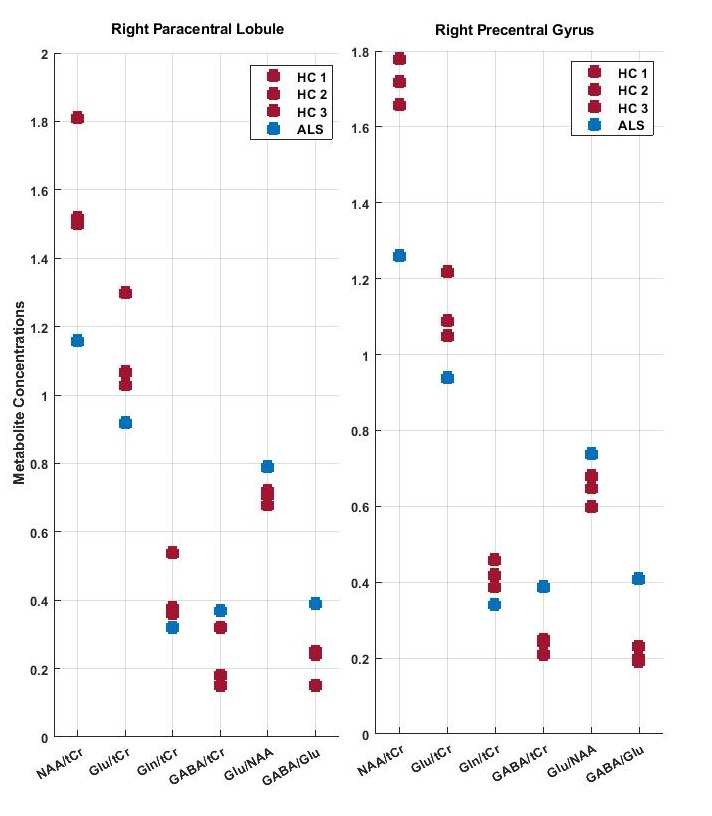
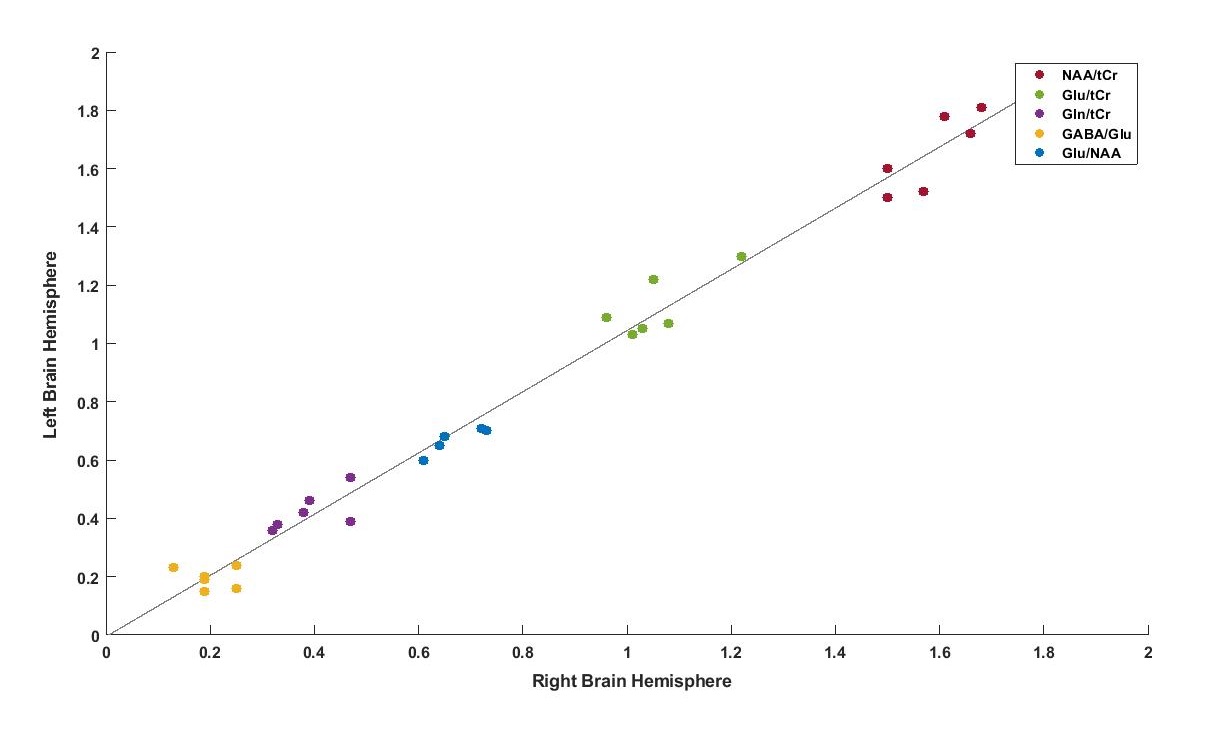
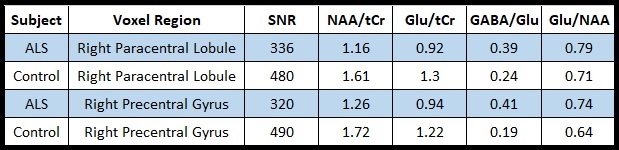
The SNR was calculated by dividing the highest metabolite peaks (tNAA) by the standard deviation of noise. As expected, SNR for the short-TE semi-LASER was highest(Figure-2) and chosen as our MRS protocol for NCs and ALS. High-SNR metabolite spectra with short-TE (26 ms) were obtained and SNR for each voxel location is provided in Table 1, which indicates lower SNR in the ALS dataset. Figure 3 shows the metabolite ratios of the ALS patient compared to NCs with the highest differences in NAA/tCr(~25% lower in ALS), GABA/Glu (~70% higher in ALS) and Glu/NAA (~20% higher in ALS) and was consistent between the upper and lower limb regions. In a patient with predominantly lower limb involvement, it was found that NAA/tCr was 1.26 and 1.16 in the upper and lower limb associated voxel, respectively. The plot of metabolites ratios of right versus left brain hemispheres in NCs and linear fit shows excellent correlation (R=1) indicating the robustness of the applied protocol(Figure-4).Discussion:
This study used an optimised semi-LASER with short-TE, which provides high SNR spectra and prevents reduction of signal amplitude due to J-evolution of the signal . A useful strategy for preventing the impact of neuronal loss in VOIs in ALS,is to divide the concentration of Glutamate to NAA[10]. Our results suggest that there may be a trend of lower NAA/tCr, higher Glu/NAA and GABA/Glu ratio in the patient with ALS with predominant lower limb involvement. This suggests that NAA/tCr,Glu/NAA and GABA/Glu ratios may be useful as in vivo diagnostic and prognostic markers in ALS. This ongoing study is currently limited by a small sample size, and observations require thorough validation in a larger patient cohort.Conclusion:
This study shows that it is possible to robustly acquire single voxel MRS in upper and lower limb regions of the motor cortex at 7T in a reasonable timeframe for patient groups.Findings indicate a difference of NAA/tCr, Glu/NAA and GABA/Glu metabolite ratios in ALS compared to NCs.Acknowledgements
This research was Conducted by the Australian Research Council Training Centre for Innovation in Biomedical Imaging Technology (project number IC170100035) and funded by the Australian Government. TS acknowledges Motor Neurone Disease Research Australia. The authors acknowledge the facilities of the National Imaging Facility at the Centre for Advanced Imaging. We thank our research radiographers, Nicole Atcheson and Aiman Al-Najjar for assisting in the data collection. We thank Dr. Małgorzata Marjańska and Dr. Georg Oeltzschner for helping to set up the protocols and pipeline for postprocessing. We are grateful to our participants for volunteering for this study.References
[1] G. Öz, Magnetic resonance spectroscopy of degenerative brain diseases. Springer, 2016.
[2] F. Christidi et al., "Neurometabolic Alterations in Motor Neuron Disease: Insights from Magnetic Resonance Spectroscopy," Journal of Integrative Neuroscience, vol. 21, no. 3, p. 87, 2022.
[3] M. Marjanska et al., "Region-specific aging of the human brain as evidenced by neurochemical profiles measured noninvasively in the posterior cingulate cortex and the occipital lobe using (1)H magnetic resonance spectroscopy at 7 T," Neuroscience, vol. 354, pp. 168-177, Jun 23 2017, doi: 10.1016/j.neuroscience.2017.04.035.
[4] D. K. Deelchand et al., "Across-vendor standardization of semi-LASER for single-voxel MRS at 3T," NMR Biomed, vol. 34, no. 5, p. e4218, May 2021, doi: 10.1002/nbm.4218.
[5] G. Öz and I. Tkáč, "Short‐echo, single‐shot, full‐intensity proton magnetic resonance spectroscopy for neurochemical profiling at 4 T: validation in the cerebellum and brainstem," Magnetic resonance in medicine, vol. 65, no. 4, pp. 901-910, 2011.
[6] R. Gruetter and I. Tkáč, "Field mapping without reference scan using asymmetric echo‐planar techniques," Magnetic Resonance in Medicine: An Official Journal of the International Society for Magnetic Resonance in Medicine, vol. 43, no. 2, pp. 319-323, 2000.
[7] G. Oeltzschner et al., "Osprey: Open-source processing, reconstruction & estimation of magnetic resonance spectroscopy data," Journal of neuroscience methods, vol. 343, p. 108827, 2020.
[8] S. W. Provencher, "Estimation of metabolite concentrations from localized in vivo proton NMR spectra," Magnetic resonance in medicine, vol. 30, no. 6, pp. 672-679, 1993.
[9] D. K. Deelchand, P. G. Henry, K. Uǧurbil, and M. Marjańska, "Measurement of transverse relaxation times of J‐coupled metabolites in the human visual cortex at 4 T," Magnetic resonance in medicine, vol. 67, no. 4, pp. 891-897, 2012.
[10] S. Caldwell and D. L. Rothman, "1H magnetic resonance spectroscopy to understand the biological basis of als, diagnose patients earlier, and monitor disease progression," Frontiers in Neurology, vol. 12, p. 701170, 2021.
Figures