3682
Whole-Brain Multi-Parametric Molecular Imaging Using Accelerated J-Resolved Subspace 1H-MRSI1Bioengineering, University of Illinois at Urbana-Champaign, Champaign, IL, United States, 2Beckman Institute for Advanced Science and Technology, Urbana, IL, United States
Synopsis
Keywords: Spectroscopy, Quantitative Imaging
J-resolved MRSI is a powerful molecular imaging tool for measuring brain metabolites, neurotransmitters and other important biophysical parameters. The inherent SNR challenge of MRSI and prolonged scan time for multi-TE data limit the imaging resolution. This work presents a brand-new capability of whole-brain multiparametric, quantitative MRSI, by integrating a fast-scanning J-resolved MRSI sequence with SNR-efficient multi-band excitation, task-specific experiment designs, subspace imaging and optimized parameter estimation. Experimental studies and initial validation were performed to demonstrate this capability for high-resolution metabolite, neurotransmitter and metabolite T2 mapping from a single scan.Introduction
J-resolved MRSI is a potentially powerful molecular imaging tool for improved detection and mapping of brain metabolites, neurotransmitters and other important biophysical parameters (e.g., T2), offering a rich set of potential biomarkers for disease research1-3. However, existing J-resolved MRSI techniques are limited by low resolutions, limited SNR, small brain coverage and/or sub-optimal experimental design. Model-based imaging4-6, e.g., sparse and low-rank models, have shown great potential in addressing these challenges. Moreover, optimized experimental designs, e.g., nonuniform TE sampling, have demonstrated improved metabolite quantification and parameter estimation7-9. In this work, we present a brand-new capability of whole-brain multiparametric, quantitative MRSI, by integrating a fast-scanning J-resolved MRSI sequence with SNR-efficient multi-band excitation, task-specific experiment designs, subspace imaging and optimized parameter estimation. Experimental studies were performed to demonstrate this capability for high-resolution metabolite, neurotransmitter and metabolite T2 mapping from a single scan. T2 estimates from the proposed method were validated against standard single-voxel spectroscopy, which shows excellent consistency.Theory and Methods
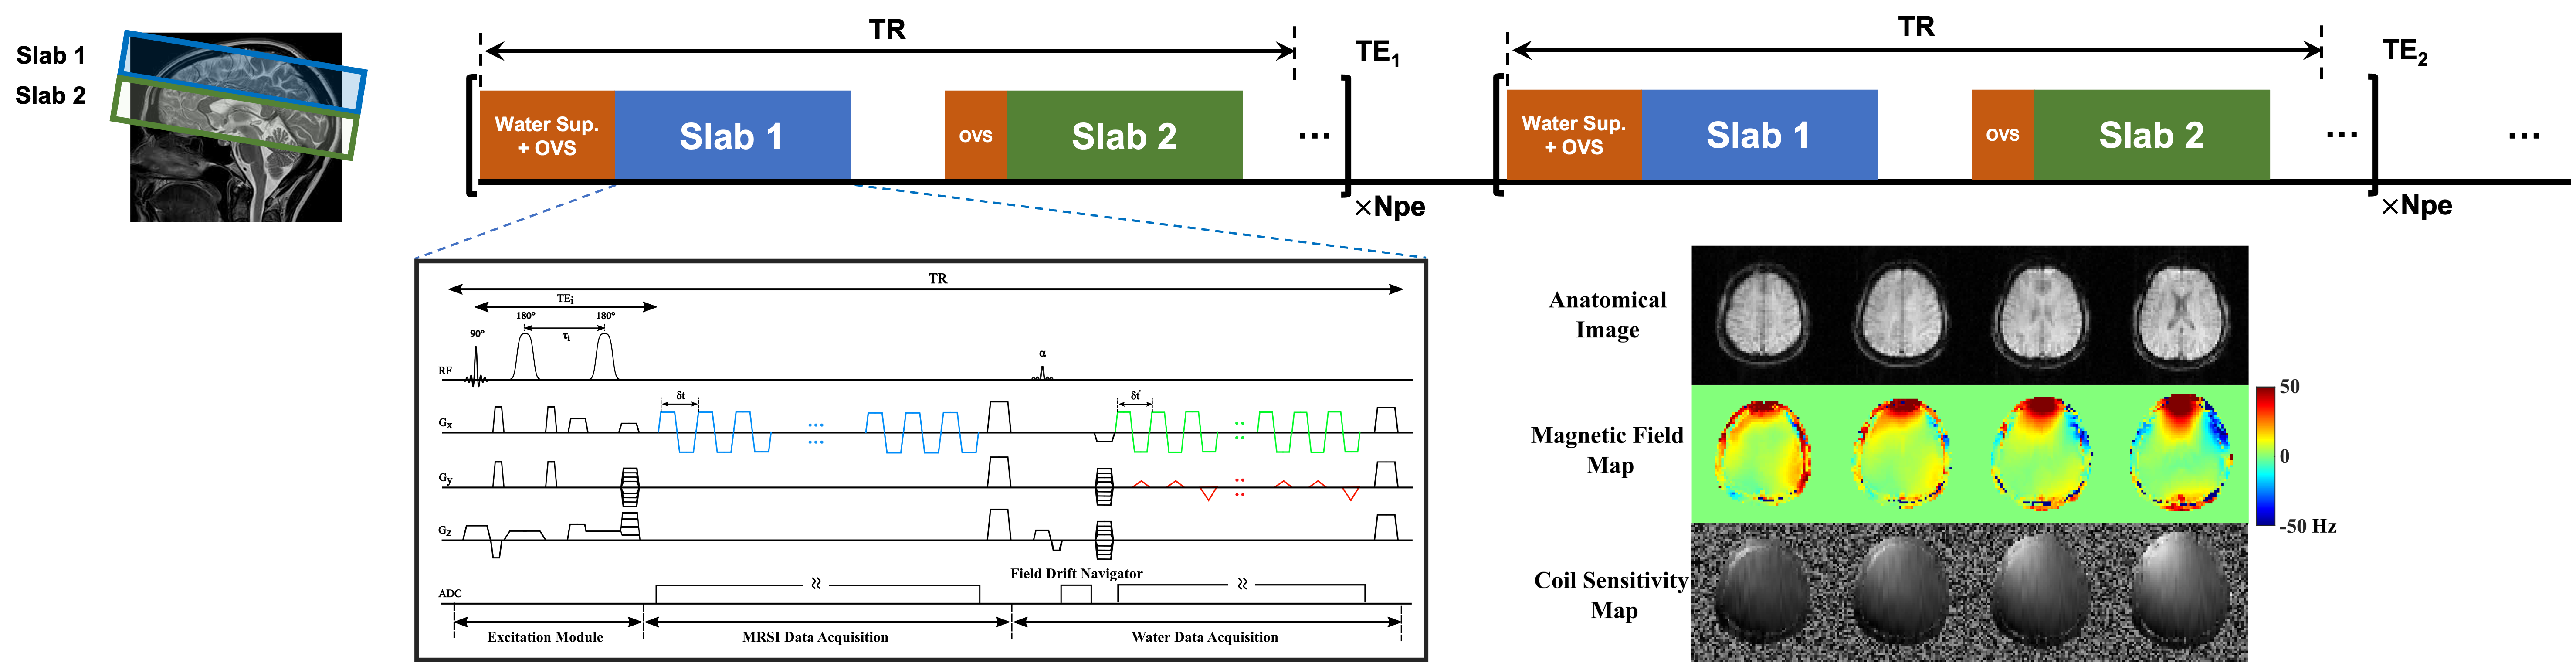
Proposed accelerated J-resolved MRSI acquisitionRecently, SPICE-based rapid acquisition strategies have demonstrated the capability of fast, high-resolution J-resolved MRSI8-10. Multi-band excitation has also been implemented for single-TE, spectral editing MRSI11 to achieve larger brain coverage. Inspired by these technical advancements, we proposed a fast sequence integrating multi-slab excitation, rapid spatiospectral encoding with (k,t,TE)-space sparse sampling and a new multi-slab interleaved water imaging acquisition. More specifically, two 3D slabs were sequentially excited and encoded in one TR. A pair of slab-selective adiabatic refocusing pulses were used for each slab to minimize CSDEs. This excitation was repeated for different TEs with TE-dependent (ky,kz)-undersampling for further acceleration at high resolutions. After MRSI encoding for each slab, field-drift navigators and water spectroscopic imaging data were interleaved following a small flip-angle (e.g., 10o) water excitation. A blipped phase encoding strategy was used for the water imaging data which resulted in a more extended k-space coverage than the MRSI data. These water data can be used for tracking and correcting field drift, B0 mapping and coil sensitivity estimation for interpolating the sparse MRSI data. The proposed sequence is illustrated in Fig. 1.
Building our own and other’s investigations on optimizing experimental design for J-resolved MRSI7,8,12, different optimal combinations of TEs can be chosen for specific tasks, e.g., 2-TE combination with [65,80]ms for separating GABA and Glx signals12 and 4-TE combination with [35,200,245,275]ms for estimating T2s of NAA, creatine (Cr) and choline (Cho)13. Balancing both tasks, a 4-TE combination of [35,65,80,245] ms can be chosen for simultaneous metabolite, neurotransmitter and T2 mapping.
Spatiospectral reconstruction using learned subspace with data-driven adaptation
Two important data processing challenges emerge, one on reconstructing high-SNR multi-TE spatiospectral functions from the rapidly collected noisy data and the other on accurately and reliably extracting quantitative parameters from the reconstruction. For reconstruction, we model the MRSI signals ($$$\mathbf{\rho}\left(\mathbf{r},t_{2},t_{1}\right)$$$) using a multi-TE union-of-subspaces (UoSS) model9,14:
$$ \begin{aligned}\mathbf{\rho}\left(\mathbf{r},t_{2},t_{1}\right)=\sum_{l_{wat}=1}^{L_{wat}}c_{l_{wat}}(\mathbf{r})v_{l_{wat}}\left(t_{2},t_{1}\right)+\sum_{l_{lip}=1}^{L_{lip}}c_{l_{lip}}(\mathbf{r})v_{l_{lip}}\left(t_{2},t_{1}\right)+\sum_{l_{\text {met}}=1}^{L_{\text {met}}}c_{l_{\text {met}}}(\mathbf{r}) v_{l_{\text {met}}}\left(t_{2}, t_{1}\right)+\sum_{l_{\text {mm}}=1}^{L_{\text {mm}}}c_{l_{\text {mm}}}(\mathbf{r})v_{l_{\text {mm}}}\left(t_{2},t_{1}\right),\end{aligned}$$
where $$$t_1$$$ and $$$t_2$$$ denote the TE and FID dimensions, respectively. $$$\{v_{l_{x}}(t_2,t_1)\}$$$ denote basis (incorporating data-driven lineshape-adaption) spanning the subspaces for different components (water, lipid, metabolite and macromolecules), with component-specific orders $$$l_x$$$. Slab-specific nuisance signal removal was performed using the strategy described in Ref.[14]. For spatiospectral reconstruction, a subspace-constrained reconstruction was performed. More specifically, the multi-TE metabolite and macromolecule subspaces were combined in this step. A combined subspace was first learned using training data generated by a physics-driven strategy incorporating empirical distributions of spectral parameters15. The learned subspace was then adapted to experimental lineshape variations using spatial-dependent FIR filters (applied to low-resolution, the high-SNR counterpart of the data) and used in the reconstruction.
Multi-TE spectral quantification
After reconstruction, parameter estimation was performed in a task-specific fashion. Specifically, data from [65,80]ms were used for quantifying the metabolite and neurotransmitter (GABA and Glx) components using strategies developed in Ref.[12]. Data from [35,80,245]ms were used for estimating metabolite T2s using a multi-TE UoSS-based signal separation followed by T2 fitting strategy13. The macromolecule component was removed using a ProFit-based strategy17 to improve T2 estimation. More details on quantification are omitted due to the space limit.
Results
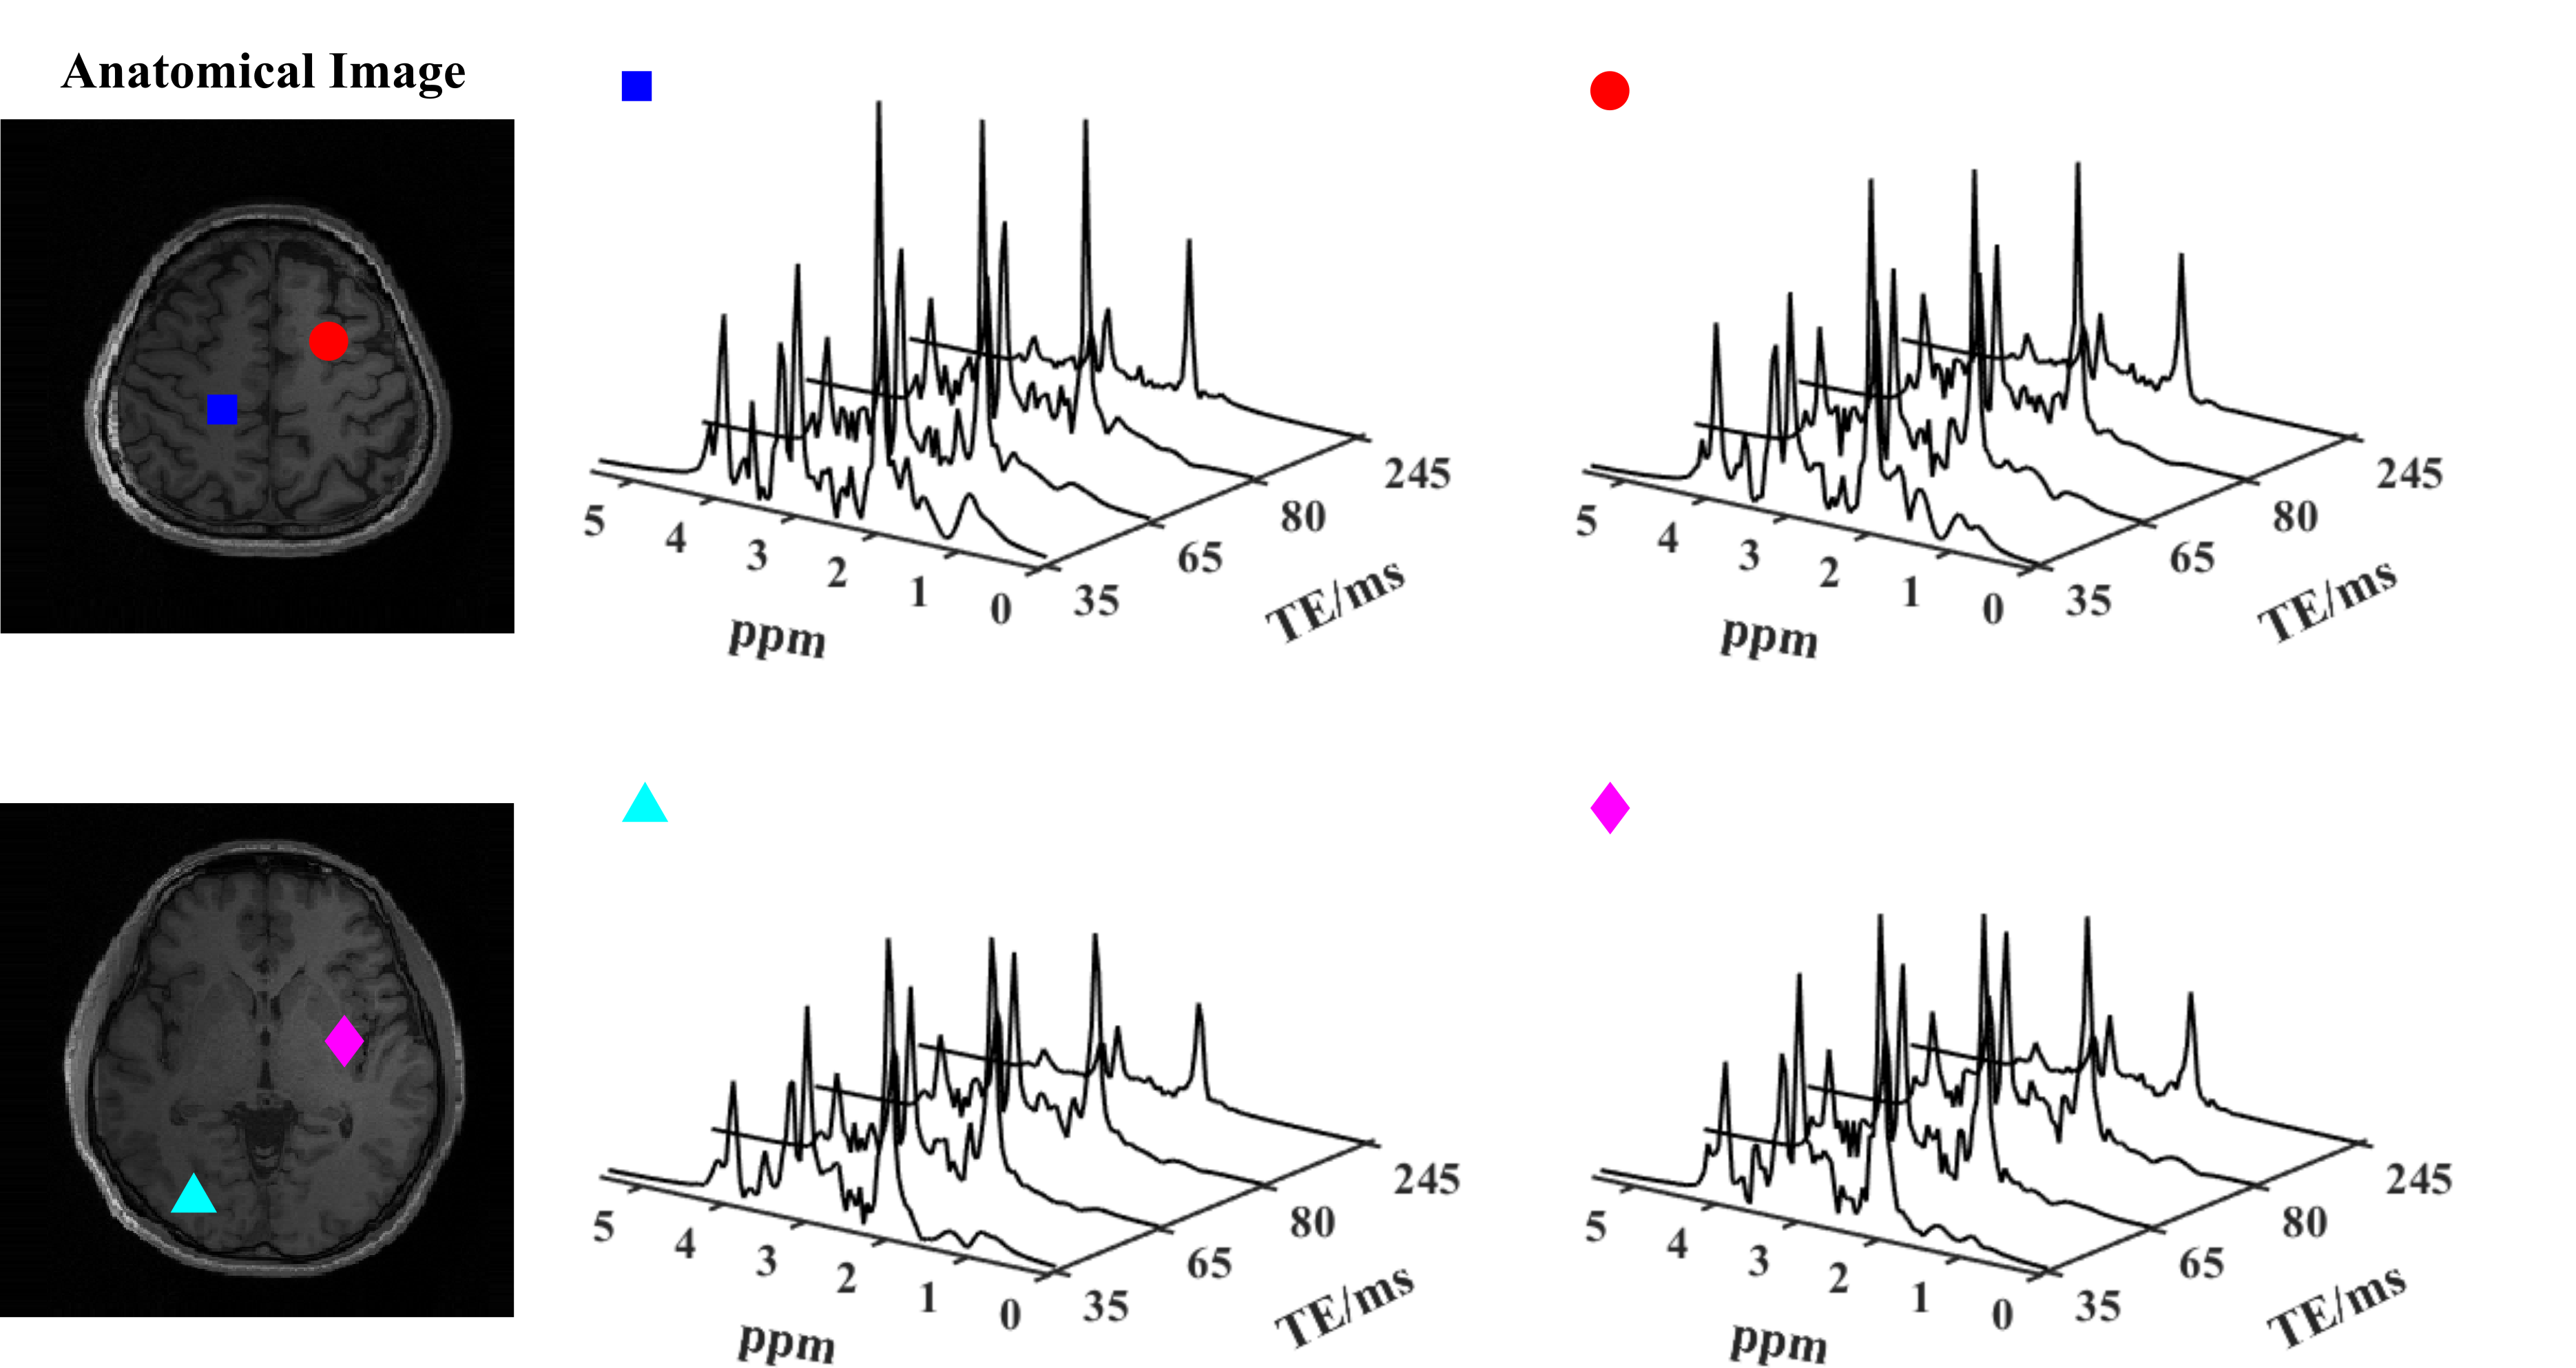
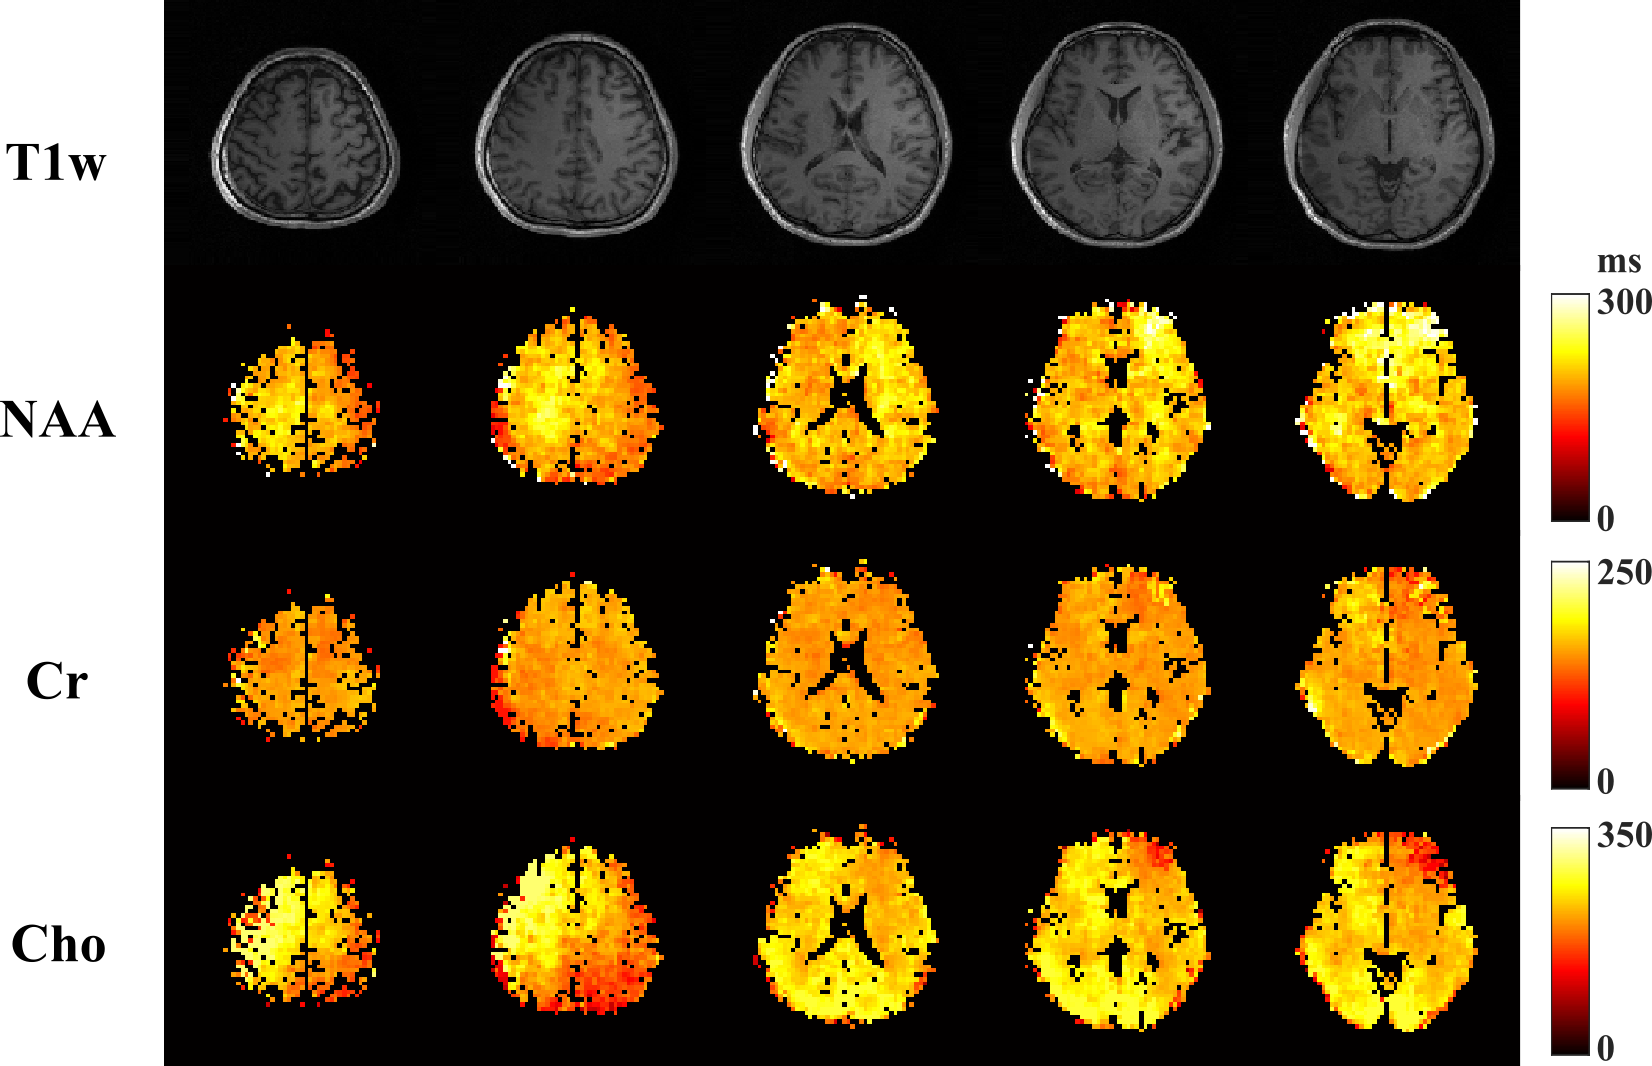
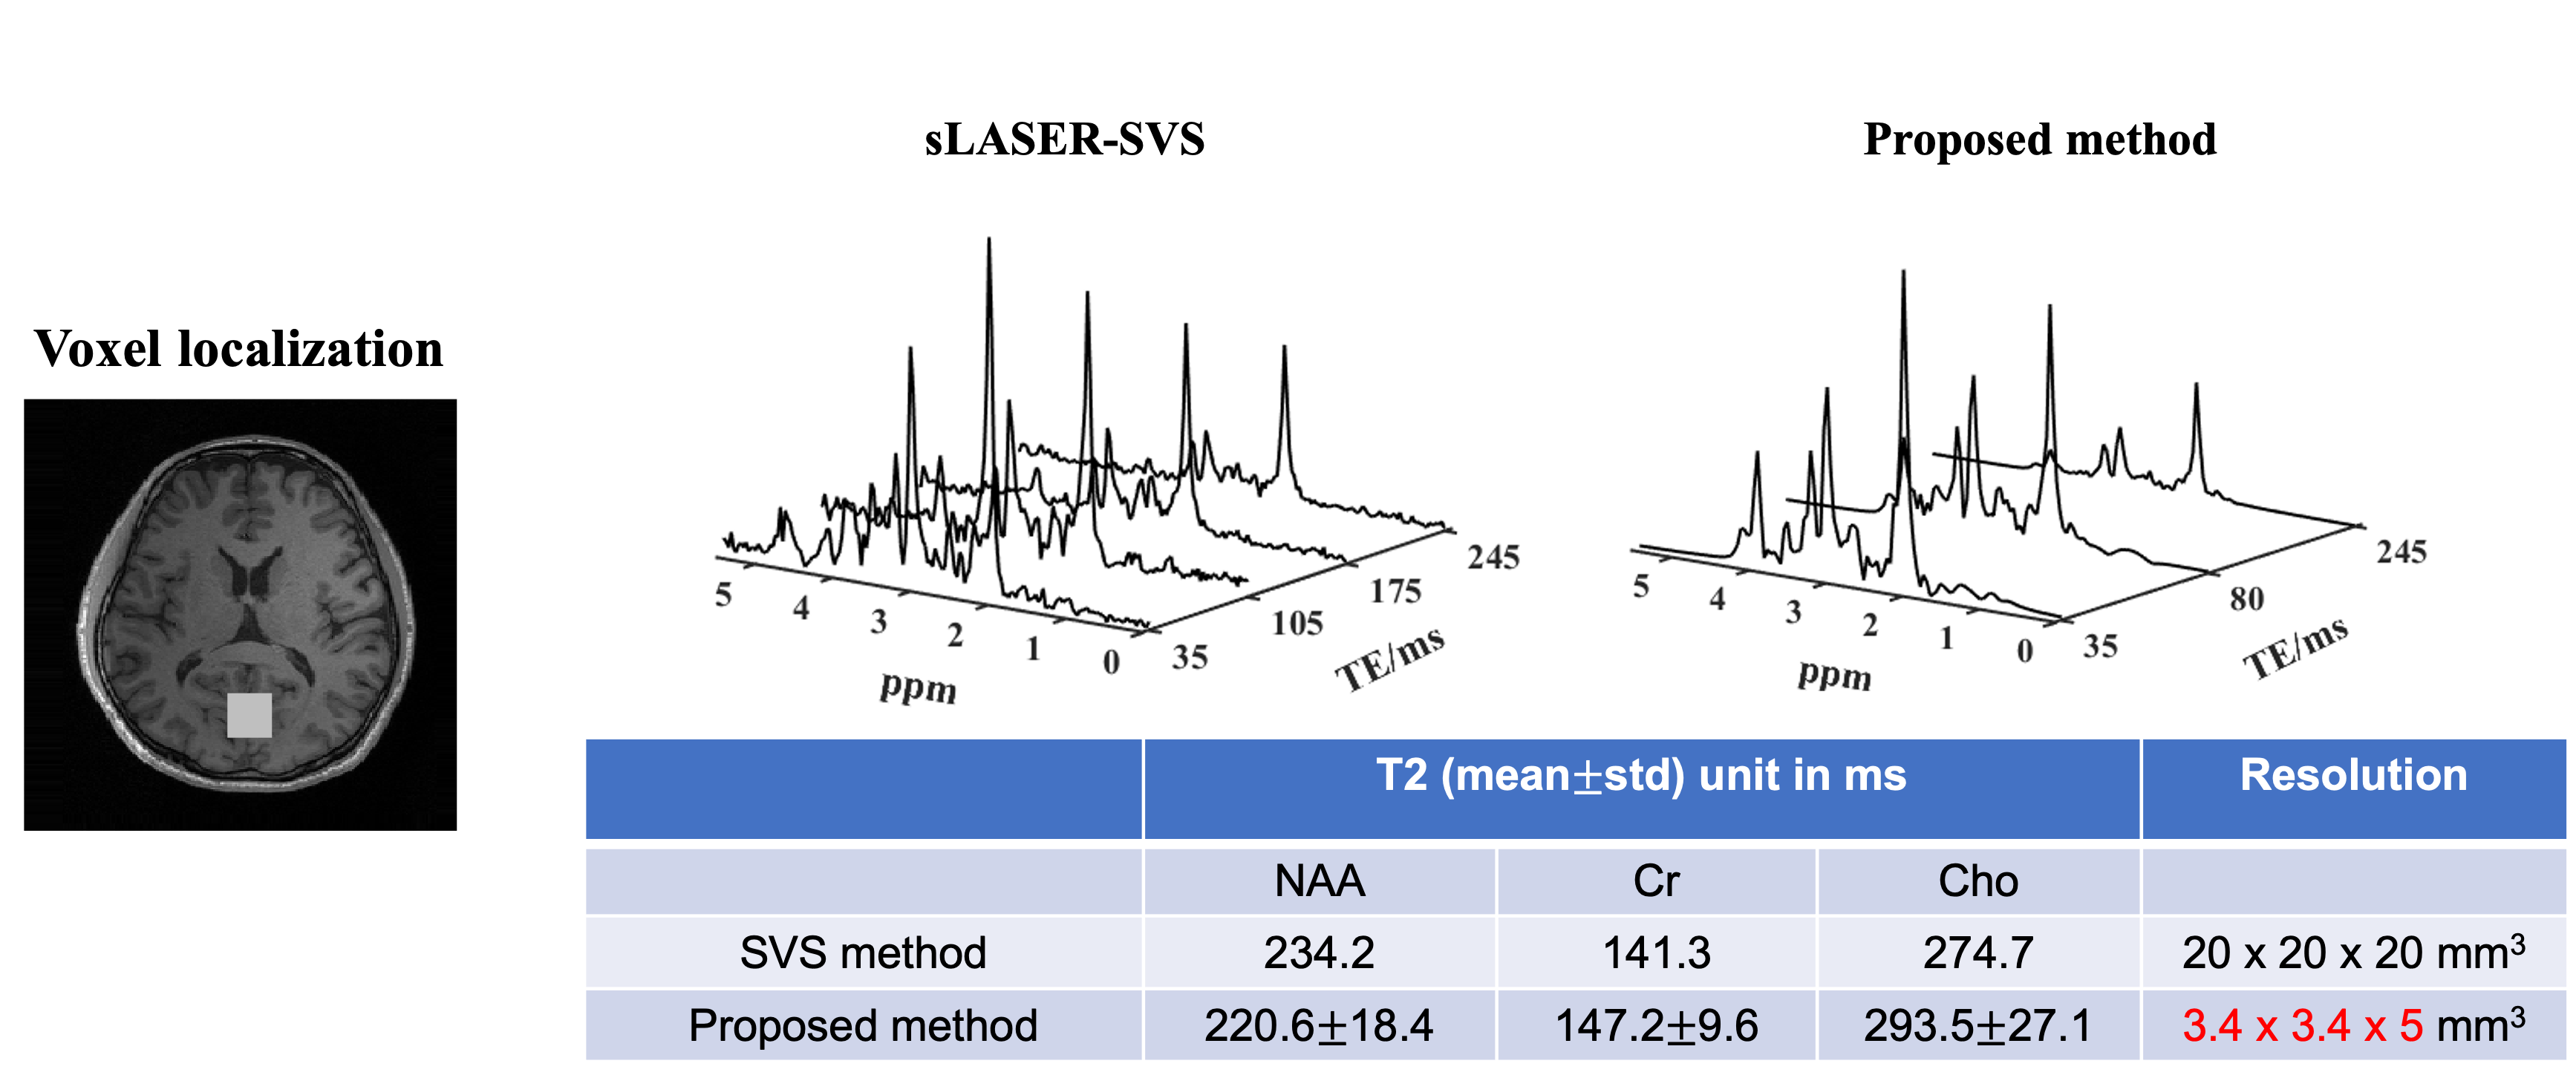
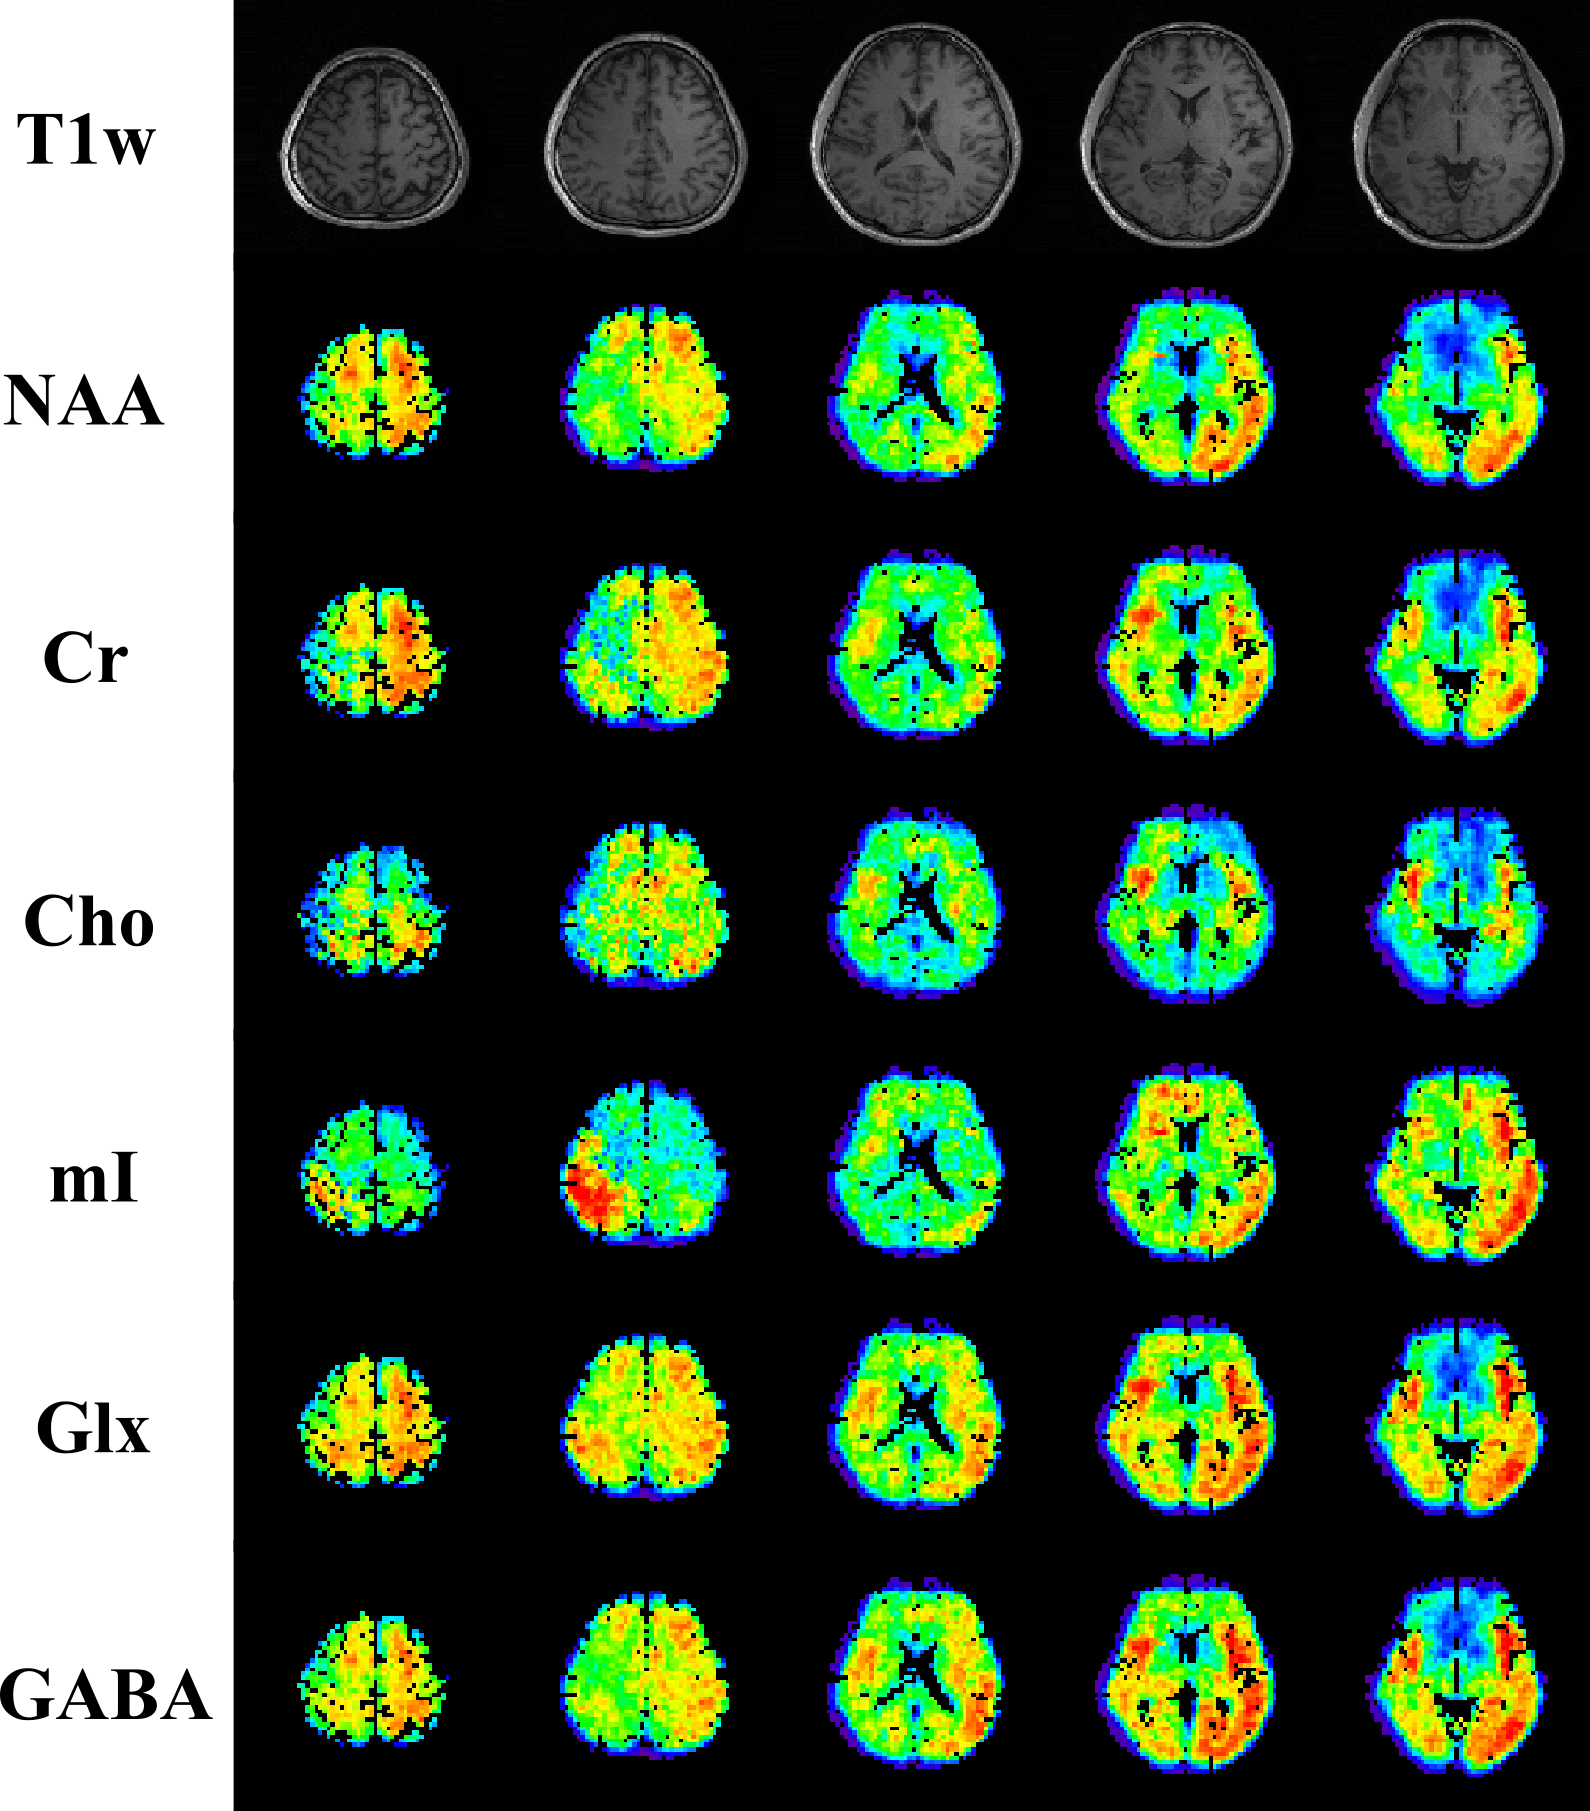
In vivo experiments were conducted on a 3T Prisma scanner using a 20-channel head coil (IRB approved), with 220x220x100 (head-foot direction) mm3 FOV, covering almost the entire brain. Figures 2-4 show some representative results from an experiment with 4 TEs and a nominal resolution of 3.4×3.4×5 mm3 (64x64 in-plane matrix size and 10 z-encodings for each slab). The total acquisition time is ~ 32 mins with 1.4s TR. High-quality spatially resolved multi-TE spectra from both slabs were produced (Fig. 2). High-resolution, high-SNR metabolite T2 maps across a large brain volume are shown in Fig. 3. Validation against a single-voxel multi-TE MRS (TE = [35,105,175,245]ms) showed excellent consistency for regional T2 values from the proposed method, but ~100-fold smaller voxels (Fig. 4). Metabolite and neurotransmitter maps across both slabs were shown in Fig. 5, which further demonstrate the impressive, multiparametric imaging capability enabled.Conclusion
A novel accelerated J-resolved MRSI method was proposed, integrating SNR-efficient multi-slab excitation, optimized TEs selection, novel interleaved water acquisitions and subspace processing for the first time. Our method enabled high-resolution whole-brain metabolite, neurotransmitter and T2 mapping.Acknowledgements
This work was supported in part by NSF-CBET-1944249 and NIH-NIBIB-1R21EB029076AReferences
[1] Isobe T, et al. Quantification of cerebral metabolites in glioma patients with proton MR spectroscopy using T2 relaxation time correction. Magn Reson Imaging, 2002; 20:343-9.
[2] Li Y, et al. Comparison of T1 and T2 metabolite relaxation times in glioma and normal brain at 3T. J Magn Reson Imaging, 2008; 28:342-50.
[3] Kirov II, Tal A. Potential clinical impact of multiparametric quantitative MR spectroscopy in neurological disorders: A review and analysis. Magn Reson Med, 2020; 83:22-44.
[4] Sarma MK, et al. Accelerated echo-planar J-resolved spectroscopic imaging in the human brain using compressed sensing: A pilot validation in obstructive sleep apnea. AJNR, 2014; 35:S81–S89.
[5] Ma C, Lam F, Liu Q, Liang ZP. Accelerated high-resolution multidimensional 1H-MRSI using low-rank tensors. In Proc of ISMRM, 2016, pp. 379.
[6] He J, et al. Accelerated high dimensional MR imaging with sparse sampling using low-rank tensors. IEEE Trans Med Imaging, 2016; 35:2119–2129.
[7] Bolliger CS, Boesch C, Kreis R. On the use of Cramér–Rao minimum variance bounds for the design of magnetic resonance spectroscopy experiments. NeuroImage, 2013; 83:1031-1040.
[8] Tang L, et al. Accelerated J-resolved 1 H-MRSI with limited and sparse sampling of (k,t1,t2) -space. Magn Reson Med, 2021; 85:30-41.
[9] Wang Z, Li Y, Lam F. High-resolution, 3D multi-TE 1H-MRSI using fast spatiospectral encoding and subspace imaging, Magn Reson Med, 2021. DOI:10.1002/mrm.29015
[10] Zhao Y, et al. Spatiospectral reconstruction from Hybrid FID/SE J-resolved MRSI data with limited coverage of (k,t,tJ)-space. In Proc of ISMRM, 2020. pp. 2861.
[11] Ma C, et al. Accelerated spectral-editing MRSI using subspace modeling multi-slab acquisition and 3D CAIPIRINHA undersampling. In Proc of ISMRM, 2019, pp. 954.
[12] Wang Z, Li Y, and Lam F. Optimized subspace-based J-resolved MRSI for simultaneous metabolite and neurotransmitter mapping, In Proc of ISMRM, 2021, pp. 72.
[13] Wang Z, Li Y, and Lam F. High-resolution brain metabolite T2 mapping using optimized multi-TE MRSI. In Proc of ISMRM, 2021. pp. 4998.
[14] Ma C, Lam F, Johnson CL, Liang ZP. Removal of nuisance signals from limited and sparse 1H MRSI data using a union-of-subspaces model. Magn Reson Med, 2016; 75:488‐497.
[15] Lam F, et al. Ultrafast magnetic resonance spectroscopic imaging using SPICE with learned subspaces. Magn Reson Med, 2020; 83:377-390.
[16] Li Y, Lam F, Clifford B, Liang ZP. A subspace approach to spectral quantification for MR spectroscopic imaging. IEEE Trans Biomed Eng, 2017; 64:2486-2489.
[17] Fuchs A, Boesiger P, Schulte RF, Henning A. ProFit revisited. Magn Reson Med, 2014;71(2):458-68.
[18] Tsai SY, et al. Fast mapping of the T2 relaxation time of cerebral metabolites using proton echo‐planar spectroscopic imaging (PEPSI). Magn Reson Med, 2007; 57:859-65.
Figures