3681
High-Resolution J-Edited MRSI Using Multi-Slab Acquisition and Learned Subspaces1Siemens Medical Solutions USA, Inc., Urbana, IL, United States, 2Beckman Institute for Advanced Science and Technology, University of Illinois at Urbana-Champaign, Urbana, IL, United States, 3Department of Electrical and Computer Engineering, University of Illinois at Urbana-Champaign, Urbana, IL, United States, 4National Center for Supercomputing Applications, University of Illinois at Urbana-Champaign, Urbana, IL, United States, 5Gordon Center for Medical Imaging, Department of Radiology, Massachusetts General Hospital, Boston, MA, United States, 6School of Biomedical Engineering, Shanghai Jiao Tong University, Shanghai, China, 7Department of Bioengineering, University of Illinois at Urbana-Champaign, Urbana, IL, United States, 8Carle Illinois College of Medicine, University of Illinois at Urbana-Champaign, Urbana, IL, United States
Synopsis
Keywords: Spectroscopy, Spectroscopy
High-resolution mapping of GABA in the brain has long been desired by the neuroscience community. But it is still challenging due to several long-standing technical obstacles including low SNR, long scan time, and spectral overlapping. This work proposes an MRSI method integrating multi-slab EPSI acquisition, MEGA spectral editing, and subspace modeling to overcome these difficulties, successfully achieving 3D GABA and metabolite mapping (at 3.0×3.0×4.0 mm3 nominal resolution) in a 12-minute scan time.Introduction
As the major inhibitory neurotransmitter, GABA plays a crucial role in regulating brain function. Mapping of GABA distribution in the brain has long been of strong interest by the neuroscience and neuropsychiatric communities.1-3 However, the most commonly used MEGA-PRESS sequence for GABA detection only provides measurements for single voxel,4 and the recently developed MRSI methods are largely limited to low resolution and long scan time.5,6 These techniques can not fulfill the ever-increasing practical needs.3D mapping of GABA in high-resolution is very challenging mainly due to (a) large number of encodings needed, (b) spectral overlapping with other metabolites, and (c) significantly limited SNR. In this work, we propose a new MRSI method to overcome these challenges. The proposed method uses multi-slab EPSI acquisition for high acquisition efficiency, uses J-editing to resolve spectral overlapping of GABA, and uses subspace modeling and learning to overcome the SNR limitation. The preliminary results showed that GABA and metabolite maps at 3.0×3.0×4.0 mm3 nominal resolution were successfully obtained in a 12-minute scan using the proposed method.
Methods
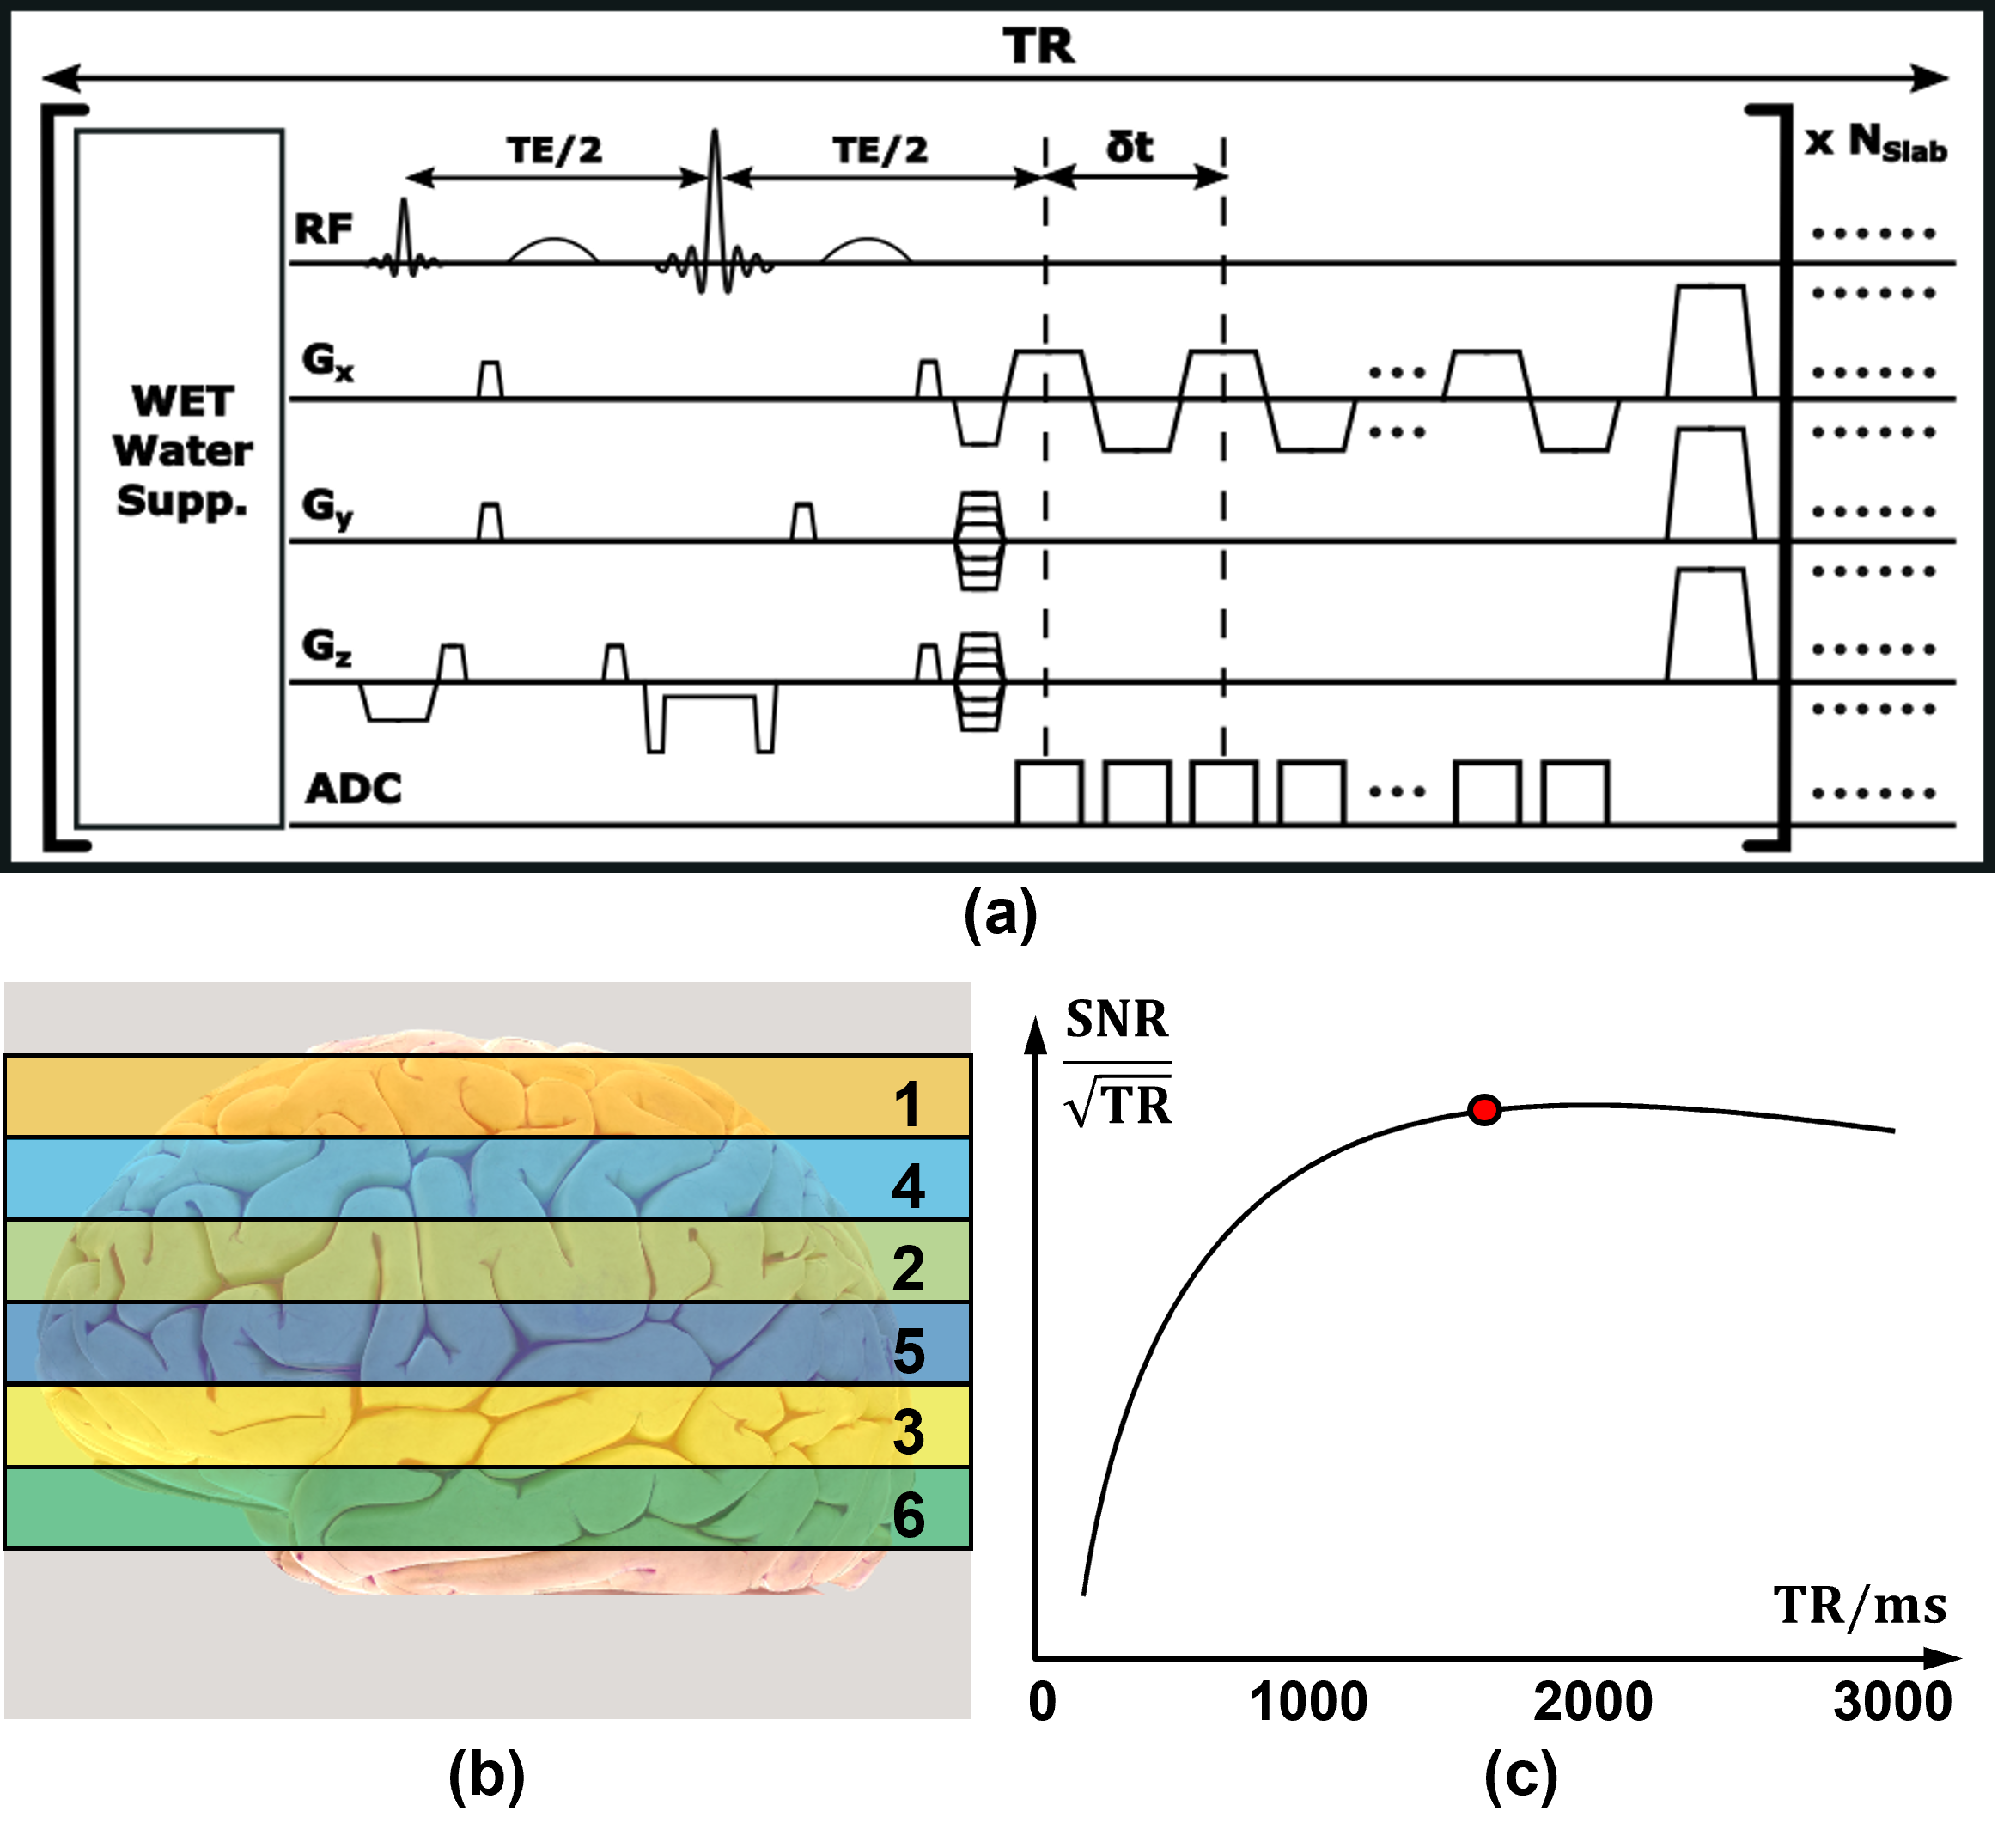
Acquisition sequence:Figure 1 shows the pulse diagram of the proposed acquisition sequence, that features: (a) multi-slab excitation, (b) MEGA-based spectral editing, and (c) fast EPSI-based trajectories. Multi-slab acquisition is used to optimize between the encoding efficiency and SNR efficiency for the spin-echo based sequence. In current implementation, 6 slabs were acquired in an interleaved fashion to reduce the inter-slab interference (Figure 1(b)), and the TR (1600 ms) was selected for a good SNR efficiency for GABA signals (Figure 1(c)). The frequency-selective MEGA pulses were centered at 1.9 ppm and 7.5 ppm in EDIT-ON and EDIT-OFF modes, respectively. The EPSI trajectories provided 80 encodings in one readout, leading to an echo-spacing of 1.4 ms. The other sequence parameters were: FOV = 240×240×72 mm3, Matrix = 80×80×18 (corresponding to 3.0×3.0×4.0 mm3 nominal resolution), TE/TR = 68 ms/1600 ms, WET for water suppression, total scan time = 12.5 minutes. All the experiments were carried out on a 3T system (MAGNETOM Prisma, Siemens Healthcare, Erlangen, Germany).
Subspace modeling and learning:
Based on the partial separability,7 the J-edited MRSI spatiotemporal signals can be represented using a low-rank subspace model, thus reducing the number of degrees-of-freedom:
$$\rho(\textbf{x},t,m)=\sum_{l=1}^{L}c_l(\textbf{x})φ_l(t,m)$$
where $$${φ_l(t,m)},{c_l(x)},L,m$$$ denote the basis functions, spatial coefficients, model order, and editing mode (EDIT-ON or OFF), respectively. It should be noted that the basis functions {$$$φ_l(t,m)$$$} can be formed separately for different editing modes or jointly into one basis set. In the proposed method, this basis function set was constructed jointly for better utilization of the correlation between two editing modes.
A subspace learning strategy was used to pre-determine the basis functions from training data.8-10 More specifically, the spectroscopic signals can be modeled as:
$$s(t)=\sum_n^Nb_nv_n(t)e^{-t/T_{2,n}+i2{\pi}f_nt}$$
where $$$v_n(t),T_{2,n},f_n$$$ represent the resonance structure, T2 relaxation time, and frequency shift of nth molecule, respectively. With $$$v_n(t)$$$ generated by quantum mechanics simulations, the distributions of spectral parameters $$$T_{2,n}$$$ and $$$f_n$$$ were estimated from training data by fitting to this spectral model. With the distributions, a collection of spectral signals were synthesized, from which the basis functions can be genrated. In this work, the basis functions were learned from a set of phantom data acquired using the proposed sequence for phantom scans, and they were learned from the open Big-GABA dataset for in vivo scans.11
With the basis functions pre-determined, the reconstruction was performed by solving:
$$\hat{C}=\arg\min_C{\parallel}d-F(CΦ){\parallel}_2^2+λ{\parallel}WC{\parallel}_2^2$$
where $$$d$$$ is the vector form of (k, t)-space data, $$$F$$$ the Fourier transform, $$$W$$$ the edge-weighted total variation operator, and $$$C,Φ$$$ the matrix forms of {$$$c_l(x)$$$} and {$$$φ_l(t,m)$$$}, respectively. The final reconstruction can be created as $$$\hat{\rho}=\hat{C}Φ$$$.
Results
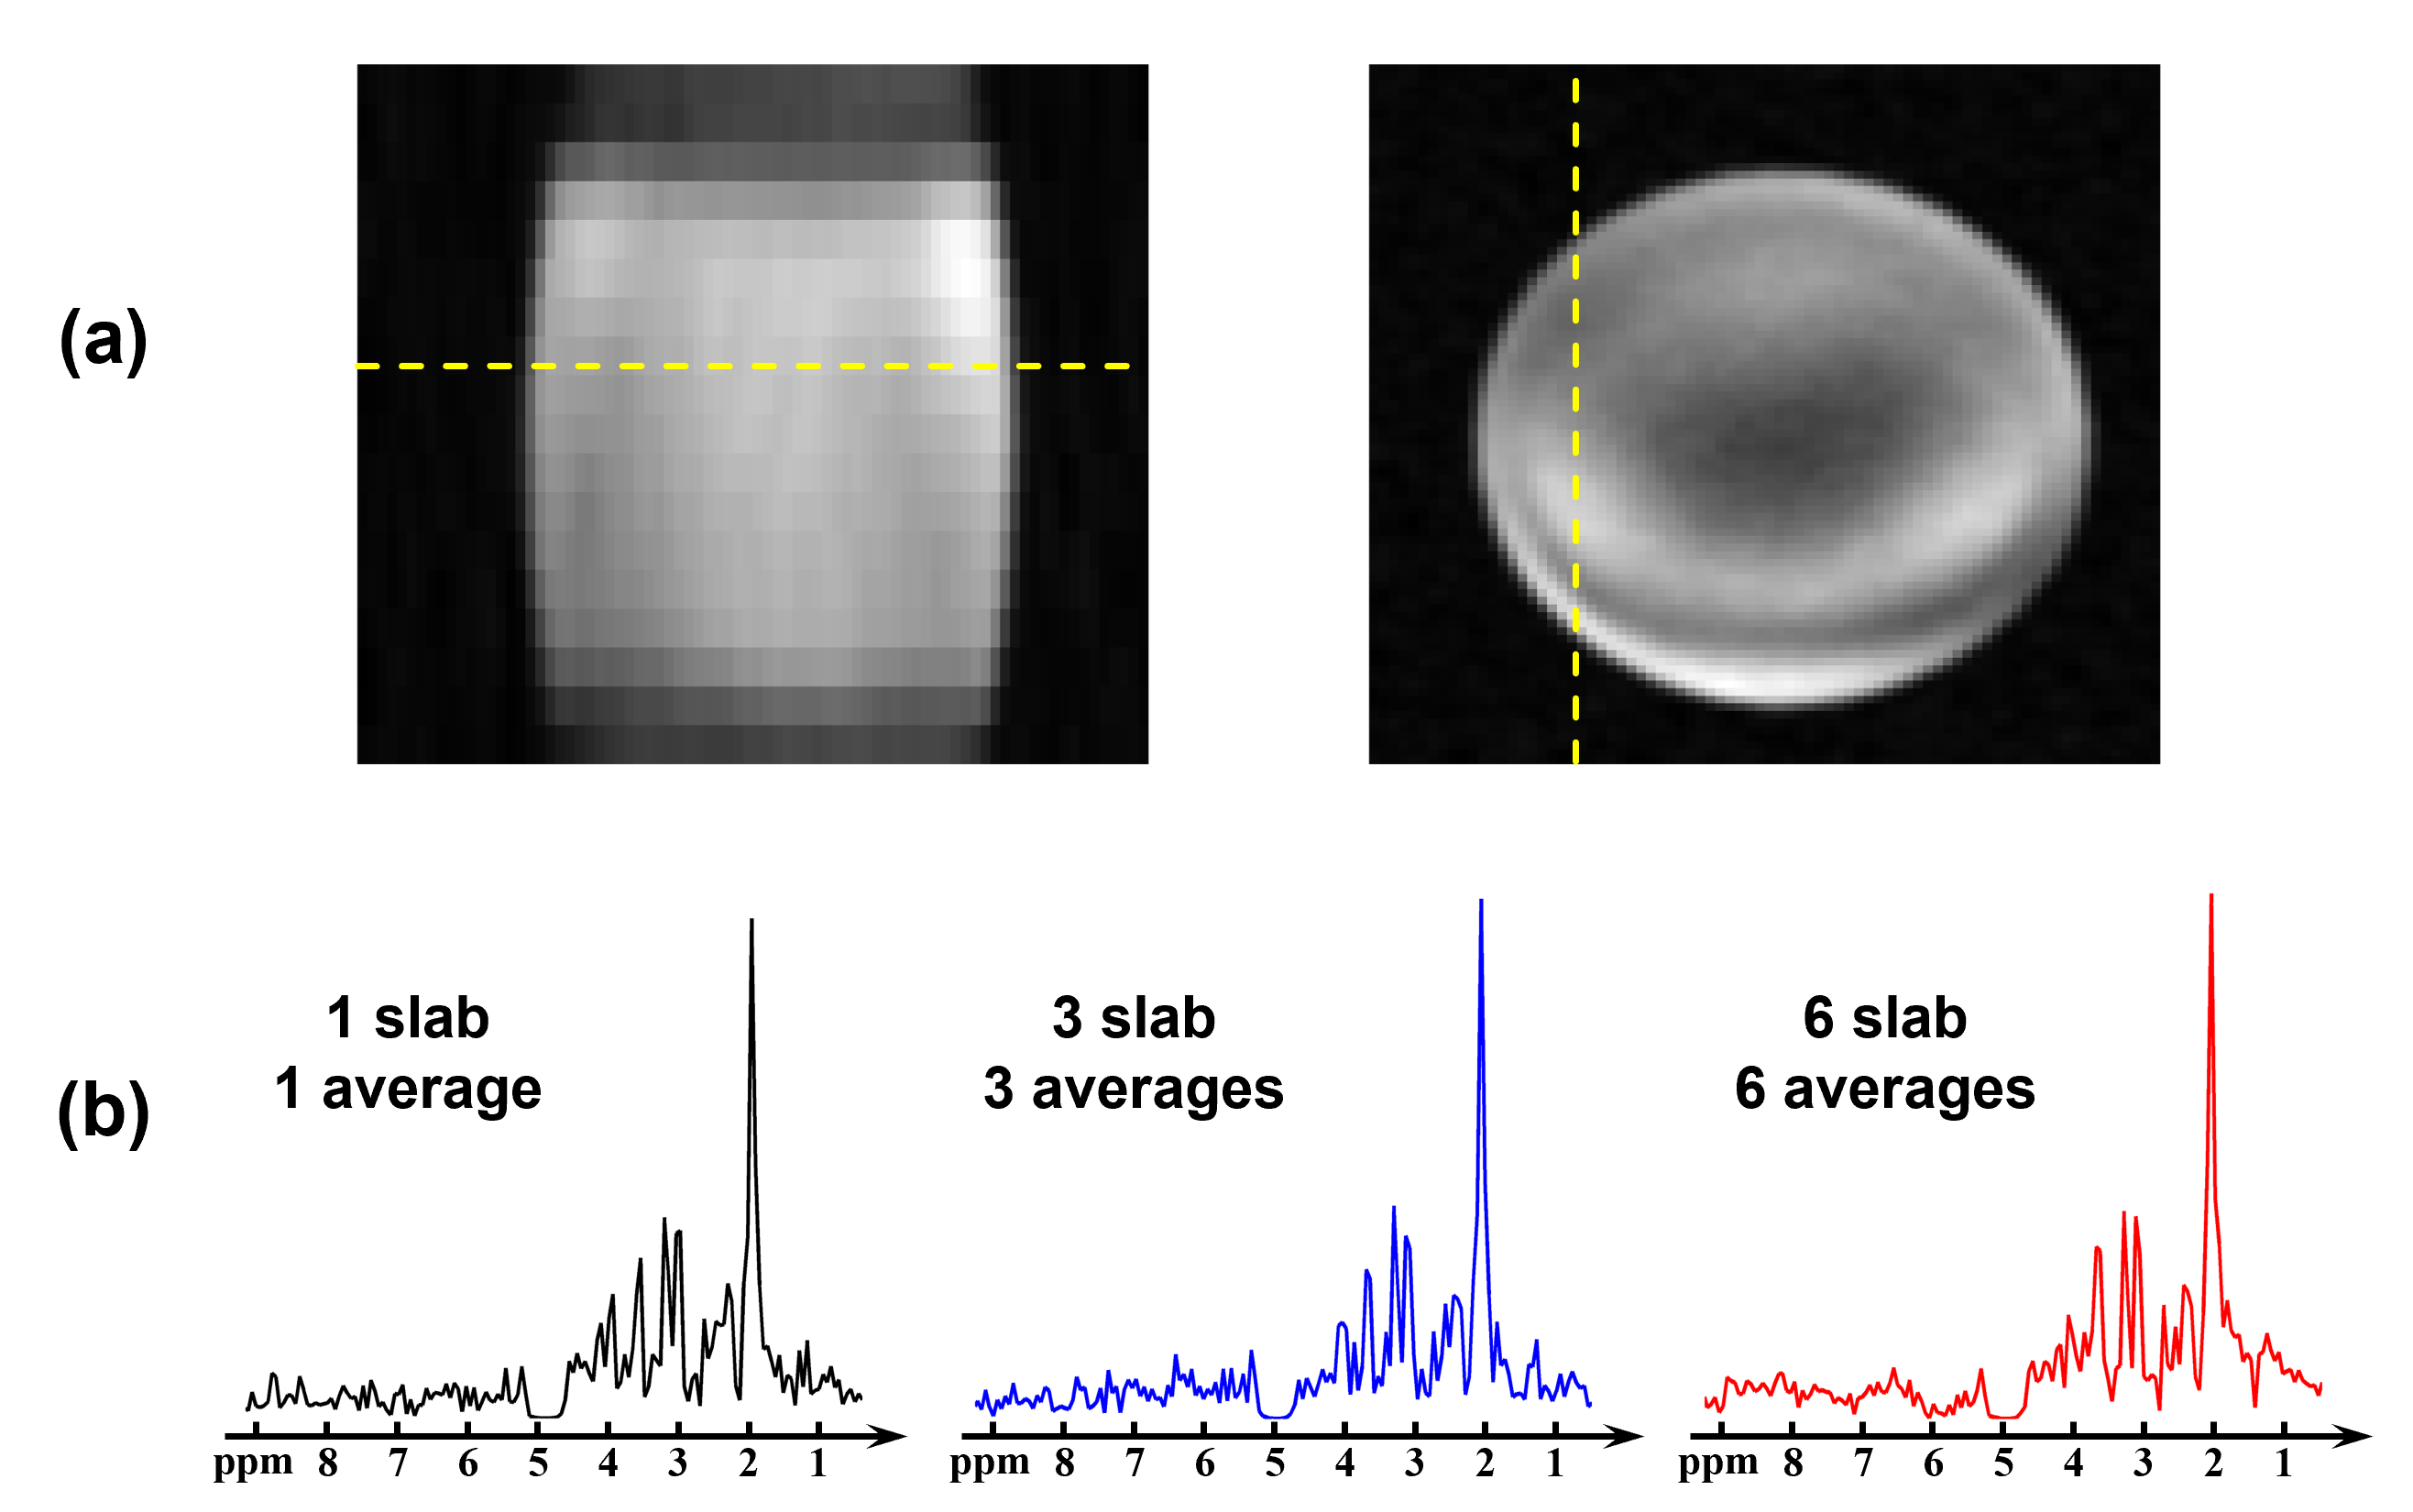
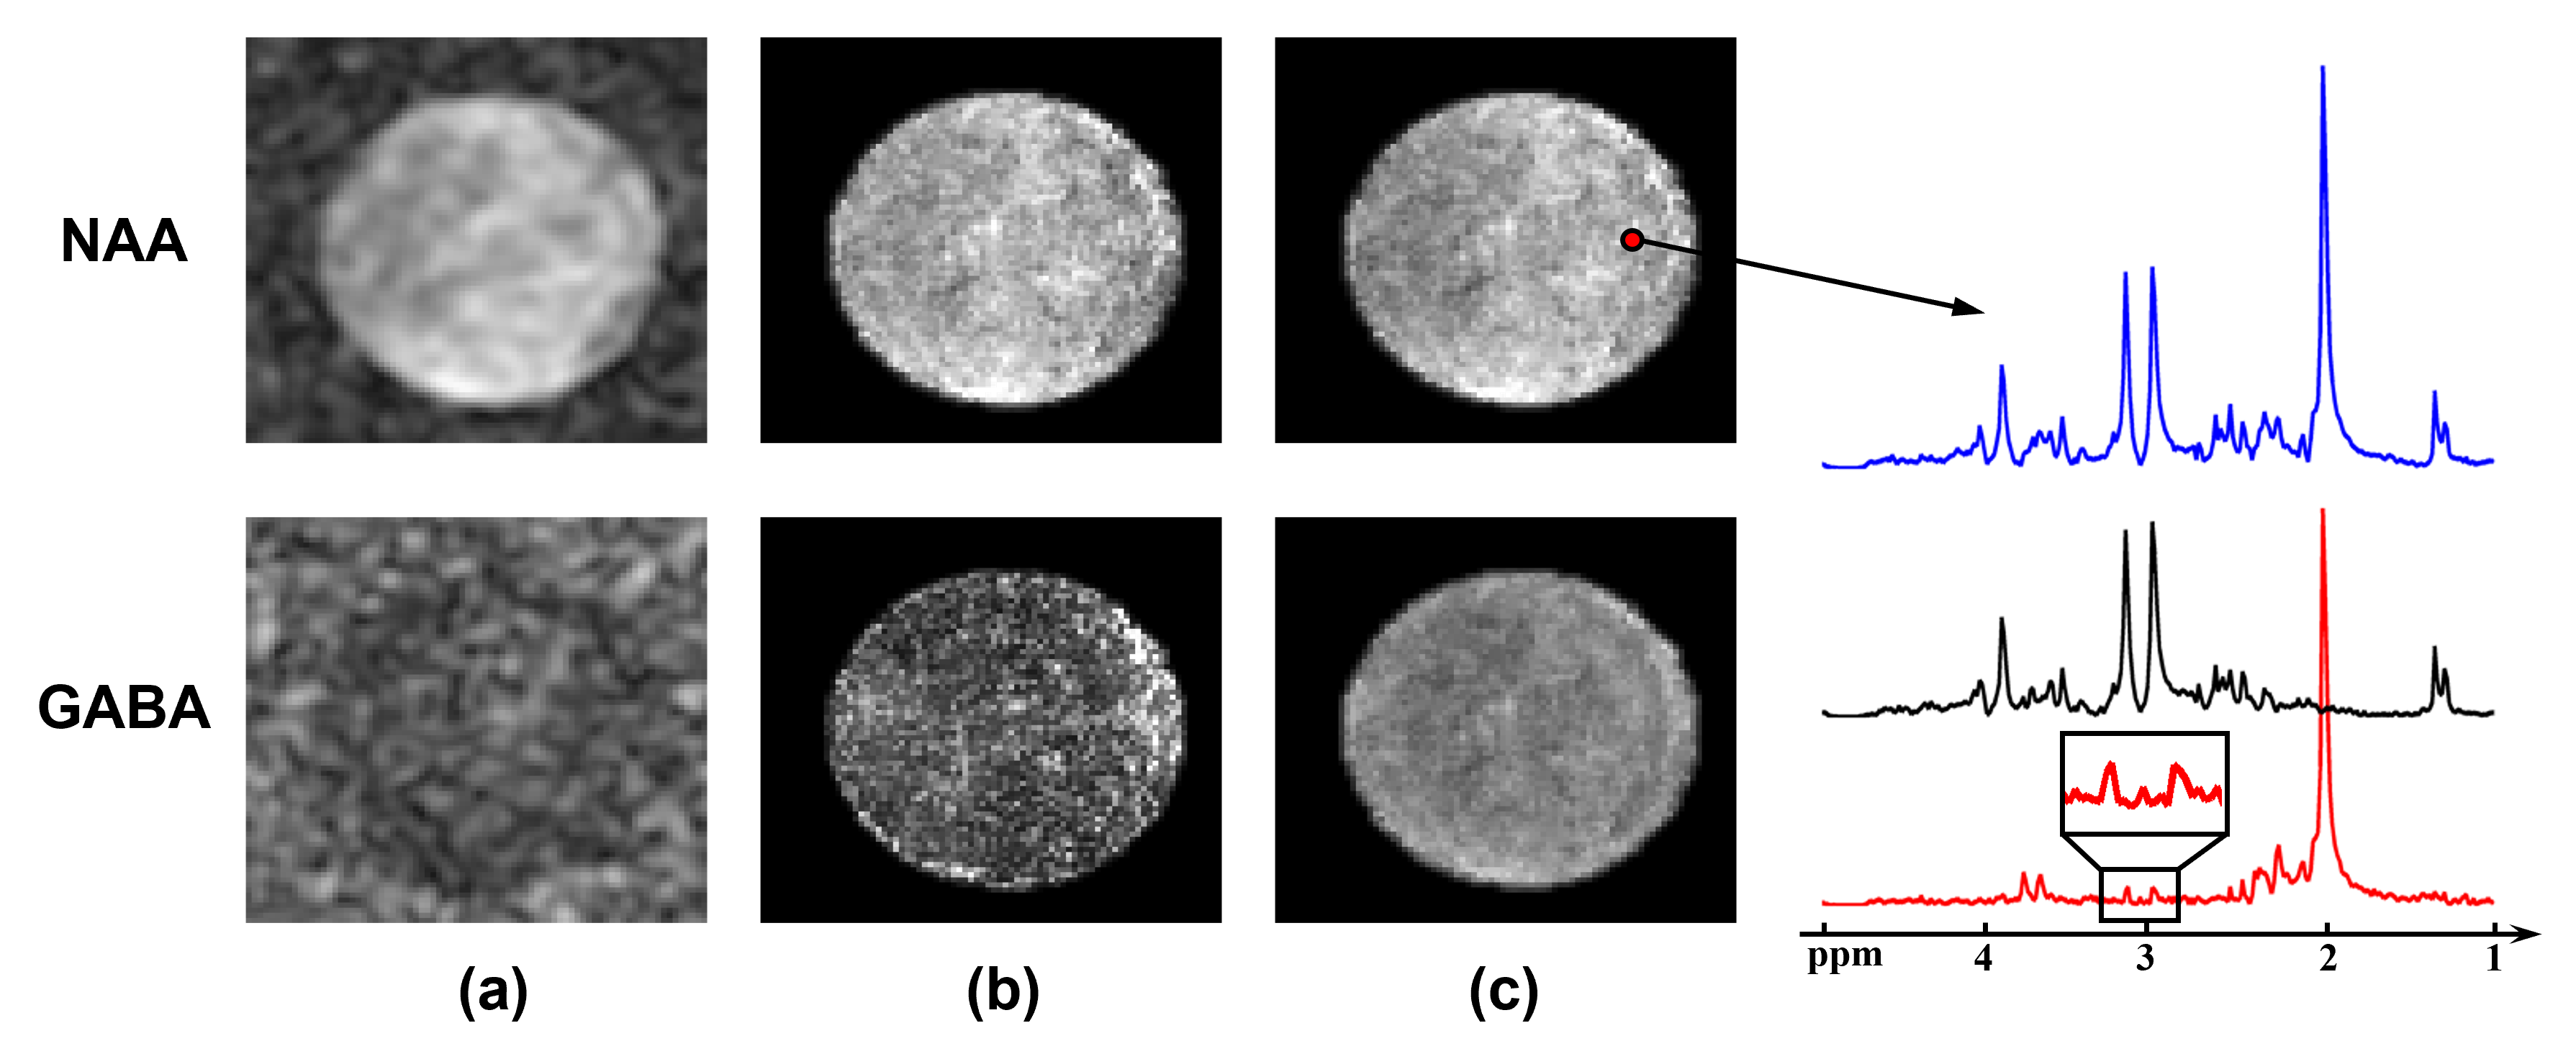
Figure 2(a) shows a water image acquired using the proposed sequence on a phantom. From the slice profile, we can see there is minimal discontinuity between slabs. Figure 2(b) shows a set of raw spectra acquired using the proposed sequence with the same TR and total time but different number of slabs. These spectra had similar levels of SNR, which indicates that the multi-slab acquisition has similar SNR efficiency as typical 3D (single slab) acquisition, but much higher encoding efficiency.The MRSI results from a spectroscopy phantom are displayed in Figure 3, including NAA and GABA maps generated by (a) k-space windowing, (b) reconstruction using separate subspaces and (c) reconstruction using joint subspace. The last method provided the best results. The localized EDIT-ON and EDIT-OFF spectra showed good SNR and the GABA peaks at 3.0 ppm were clear in the difference spectrum.
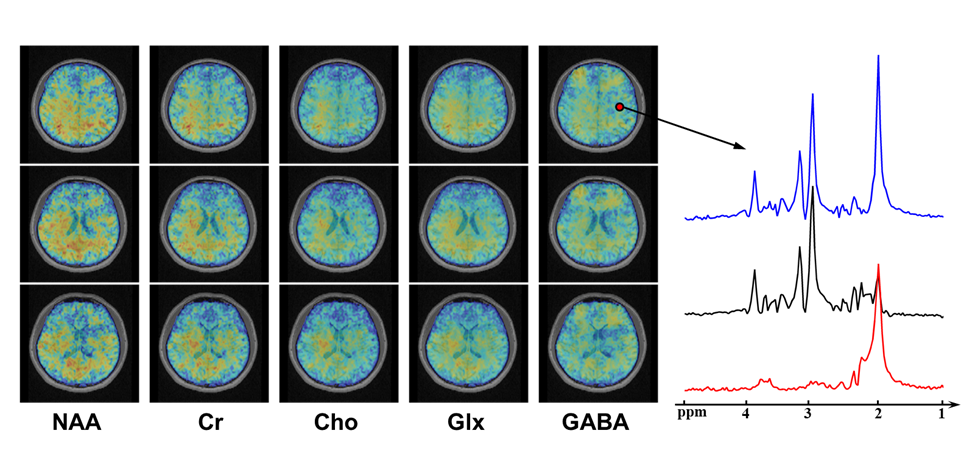
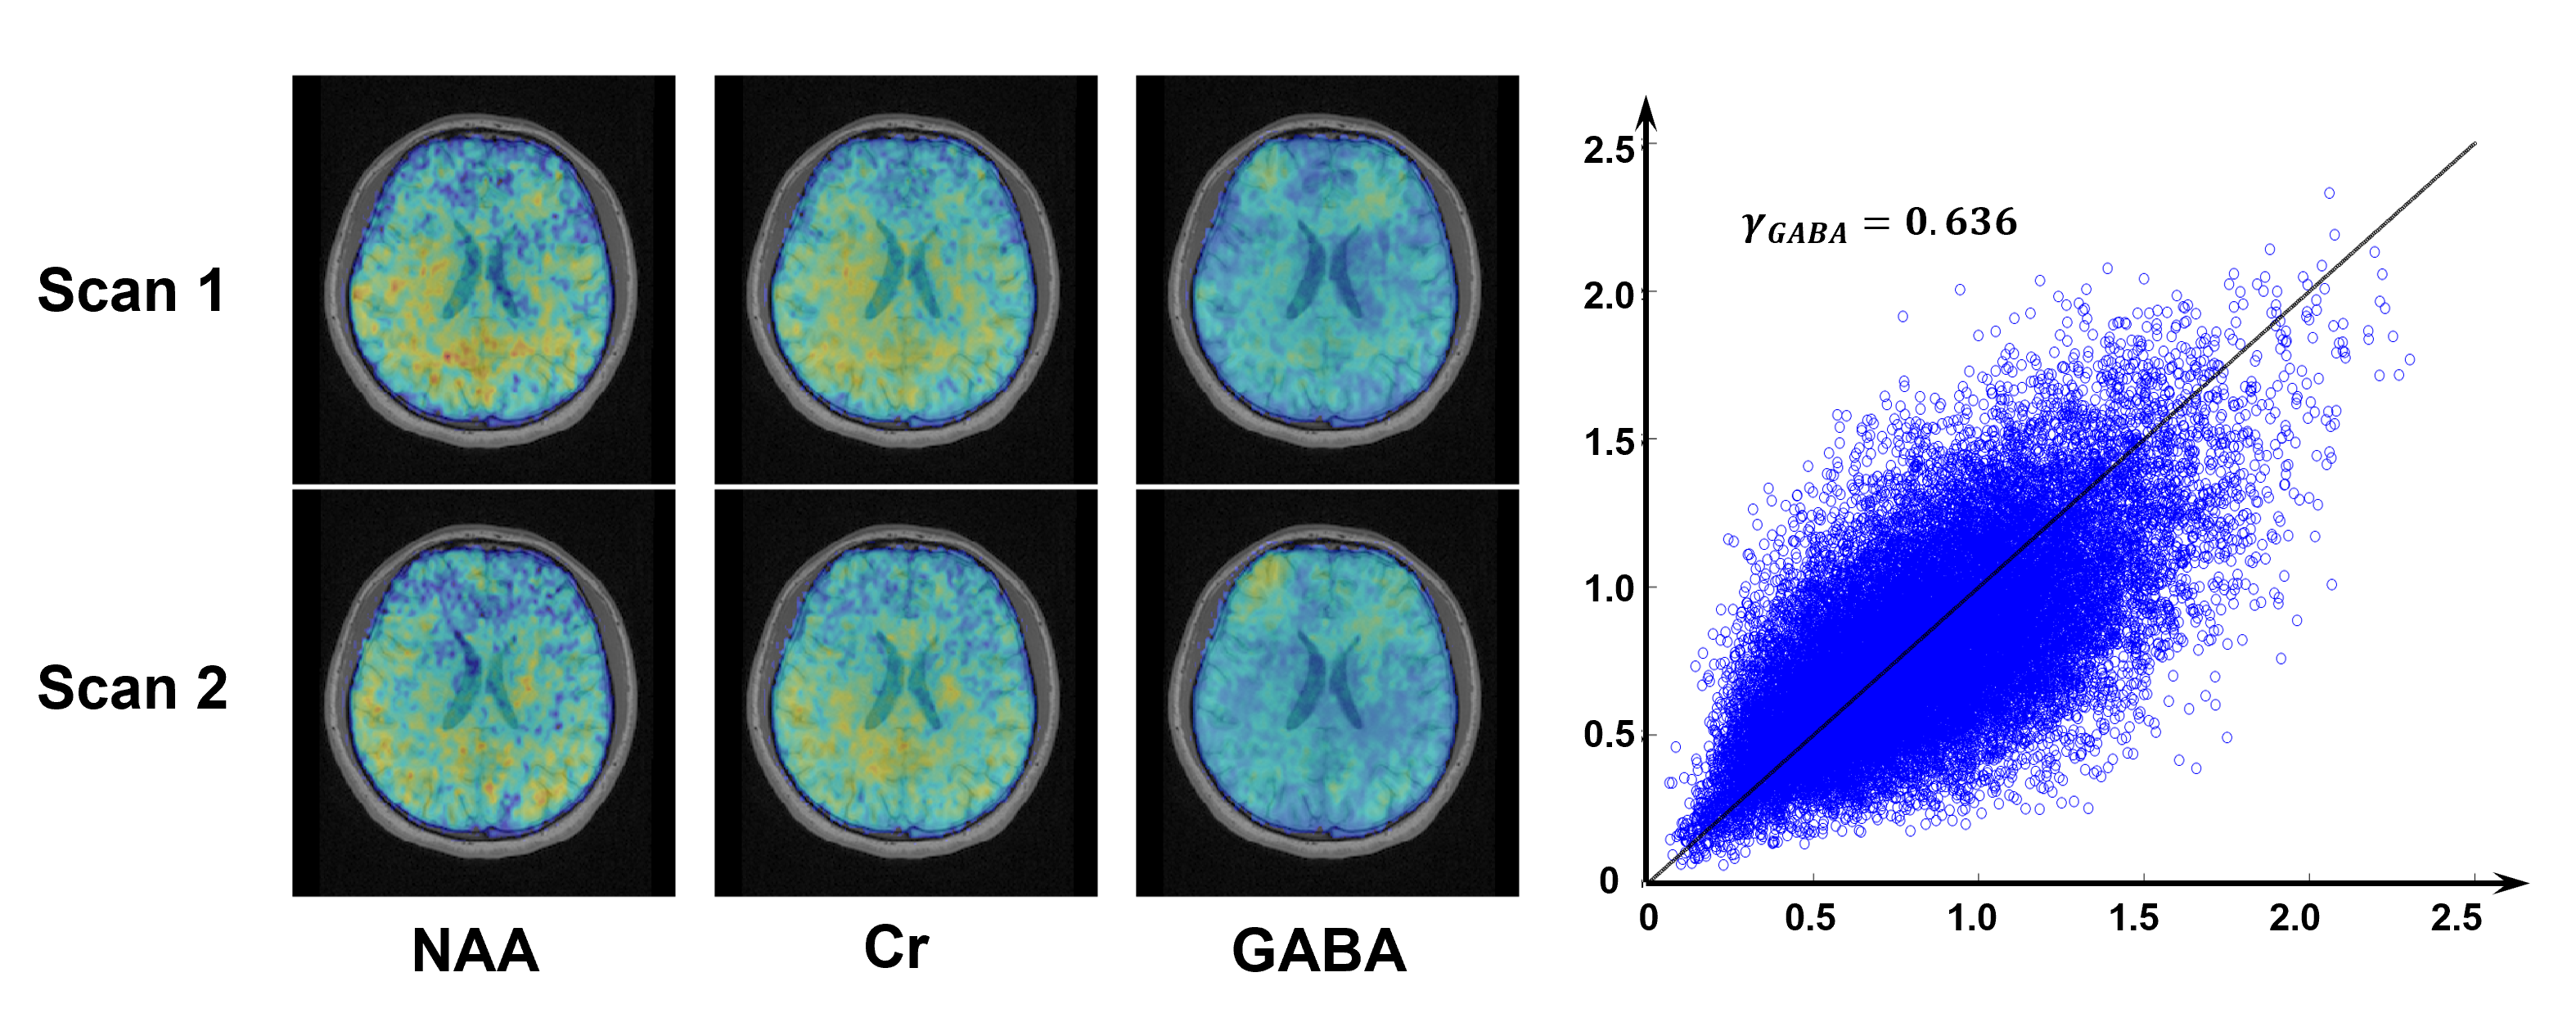
Figure 4 shows the representative maps of GABA, Glx, NAA, Cr, and Cho from a healthy volunteer using the proposed method. The GABA signals (including co-edited macromolecule signals) were noticeable in the representative difference spectrum given the data quality. Preliminary test-retest scans were also performed by acquiring two sequential scans on a volunteer (Figure 5). As we can see, the reproducibility of GABA mapping is reasonable (γ = 0.636).
Conclusion
By integrating multi-slab EPSI acquisition, MEGA spectral editing, and subspace modeling, the proposed method can provide 3D high-resolution GABA and metabolite mapping (3.0×3.0×4.0 mm3 nominal resolution) in a 12-minute scan. With further development, it may provide a powerful GABA mapping tool for many applications.Acknowledgements
No acknowledgement found.References
1. Schür RR, Draisma LWR, Wijnen JP, et al. Brain GABA levels across psychiatric disorders: A systematic literature review and meta-analysis of 1H-MRS studies. Hum Brain Mapp. 2016;37(9):3337-3352.
2. Stagg CJ, Bachtiar V, Johansen-Berg H. The role of GABA in human motor learning. Curr Biol. 2011;21(6):480-484.
3. Duncan NW, Wiebking C, Northoff G. Associations of regional GABA and glutamate with intrinsic and extrinsic neural activity in humans-A review of multimodal imaging studies. Neurosci Biobehav Rev. 2014;47:36-52.
4. Mullins PG, McGonigle DJ, O'Gorman RL, et al. Current practice in the use of MEGA-PRESS spectroscopy for the detection of GABA. Neuroimage. 2014;86:43-52.
5. Zhu H, Edden RAE, Ouwerkerk R, Barker PB. High resolution spectroscopic imaging of GABA at 3 Tesla. Magn Reson Med. 2011;65(3):603-609.
6. Moser P, Hingerl L, Strasser B, et al. Whole-slice mapping of GABA and GABA+ at 7 T via adiabatic MEGA-editing, real-time instability correction, and concentric circle readout. Neuroimage. 2019;184:475-489.
7. Liang ZP. Spatiotemporal imaging with partially separable functions. Proc IEEE Int Symp Biomed Imaging. 2007:988–991.
8. Li Y, Lam F, Cliiford B, et al. A subspace approach to spectral quantification for MR spectroscopic imaging. IEEE Trans Biomed Eng. 2017;64(10):2486-2489.
9. Lam F, Liang ZP. A subspace approach to high‐resolution spectroscopic imaging. Magn Reson Med. 2014;71(4):1349-1357.
10. Lam F, Li Y, Guo R, et al. Ultrafast magnetic resonance spectroscopic imaging using SPICE with learned subspaces. Magn Reson Med. 2020;83(2):377-390.
11. Mikkelsen M, Barker PB, Bhattacharyya PK, et al. Big GABA: Edited MR spectroscopy at 24 research sites. Neuroimage. 2017;159:32-45.
Figures