3679
Multi-echo EPI for improving temporal resolution in task-based fMRI at 7T- a dynamic phantom study
Guy Shlomo Baz1,2, Edna Furman-Haran 2,3, and Rita Shmidt1,2
1Department of brain sciences, Weizmann Institute, Rehovot, Israel, 2The Azrieli National Institute for Human Brain Imaging and Research, Weizmann Institute, Rehovot, Israel, 3Life Sciences Core Facilities, Weizmann Institute, Rehovot, Israel
1Department of brain sciences, Weizmann Institute, Rehovot, Israel, 2The Azrieli National Institute for Human Brain Imaging and Research, Weizmann Institute, Rehovot, Israel, 3Life Sciences Core Facilities, Weizmann Institute, Rehovot, Israel
Synopsis
Keywords: fMRI (task based), High-Field MRI
Ultra-high field MRI provides increased sensitivity, which we aim to utilize for improving the temporal resolution in functional studies. To investigate the achievable resolution at 7T MRI, a dynamic phantom that can generate an fMRI-like time-series was used. A dataset based on block-design with defined time shifts and a range of contrast-to-noise values was used to characterize the effective temporal resolution. Estimated temporal resolution was x1.7 times better for multi-echo compared to single-echo EPI, estimated as 146ms for a scan with TR of 600ms. This study offers a novel approach of optimizing protocols and new insights into fMRI temporal resolution.Introduction
Ultra-high field 7T human MRI offers increased BOLD sensitivity as well as higher temporal signal-to-noise (tSNR) for functional studies1. While many studies use the increased sensitivity to achieve higher spatial resolution, in this study we aim to examine methods to increase temporal resolution. Multi-echo EPI was demonstrated useful for better capturing the BOLD signals, due to its increased tSNR (see Fig. 1) as well as the capability to separate the BOLD and non-BOLD contributions2-4. Improved tSNR is also expected to contribute to an increase in effective temporal resolution (ETR). To characterize the ETR of an experimental protocol, it is required to generate a BOLD-like signal in a controllable manner. This can be achieved using a dynamic phantom that can simulate the BOLD signal changes inside the scanner. In previous studies, such phantom has enabled a better definition of the temporal noise characteristics by mimicking the BOLD time-series of a resting-state experiment5,6. In the current study, the expected signal of a block-design paradigm was generated using a dynamic phantom to characterize the ETR at 7T MRI and optimize it by using multi-echo EPI.Methods
The dynamic phantom’s compartments consist of a controller with 2 valves, delivering around 85psi air pressure to a pneumatic motor attached to a cylindrical head filled with agarose gel and an optical encoder (ALA scientific inc., New York, USA7; Fig. 2A). Each valve rotates the head either clockwise or counterclockwise with controllable rotated angles. The optical encoder supplies indication on the actual movement. By rotating the agarose head, an increase or decrease of the signal at a certain group of voxels can be achieved (Fig. 2B), where two compartments- “Active” (T2* =48.5ms) and “Inactive” (T2*=44.5ms) define the range of signal change. The target tSNR of the phantom experiments (Fig. 3A) was set based on an in-vivo scan (see scan parameters in Fig.1) by adjusting the flip angle. Scan parameters of the multi-echo EPI8,9: TR = 600 ms, TEs = 14.4, 43.6 & 72.9 ms, in-plane resolution 2.13x2.13 mm2, slice thickness 3 mm. The dynamic signal was designed to mimic a BOLD signal in a block-design paradigm and consisted of 6 blocks of 12 seconds “on” followed by an 18 seconds “off” period. It was generated as a convolution of a stimuli vector with the hemodynamic response function (using SPM software package; Fig. 2D). Two-hundred TRs at the beginning of the scan were added to estimate the tSNR without any “task”. During scanning session, 6 repetitions of 3 types of the mentioned signal were performed, each with a different time shift of the stimuli onset: 0 ms, 100 ms & 600 ms. To identify the voxels of interest that represent the dynamic signals, a standard general linear model analysis was performed, and voxels with t-test above 10 were selected (Fig. 3B). For each scan, the time-series was averaged across blocks (Fig. 3C). To estimate the time lag between the different scans, cross-correlation between all scans to one reference scan was computed for each voxel. The ETR, defined as the standard deviation of the estimated time shift across voxels, was computed separately for each echo and for the combined echoes average. The contrast-to-noise (CNR) ratio was defined here as the maximal signal change (see Fig. 3C) divided by the average standard deviation of the signal. Then, all scans’ data were divided into 15 bins according to the signals’ CNR and ETR was computed for each bin.Results
Averaged estimated time shift for the 100ms-shifted signals was 63 ± 133 ms and for the 600 ms-shifted signals 627 ± 143 ms (figure 3D). The best ETR as a function of echo time corresponded to TE=43 ms, which is proximate to the T2* of the phantom (as expected). The estimated ETR of the combined-TEs signal was 146 ms, which is x1.7 smaller compared to the optimal single echo result (Fig. 4A). Lastly, ETR as a function of CNR shows negative correlation (better CNR results in improved ETR; r = -0.9, p<0.01; Fig. 4B).Discussion
In our study we suggest a new way to investigate the effective temporal resolution of the fMRI signal using the standard deviation of the estimated time-shifts of BOLD mimicking signals generated using a dynamic phantom. Employing the method on multi-echo EPI showed that signal of combined echoes provides x1.7 times better ETR compared to single-echo. Important to note that the ETR can be better than the repetition time (TR), since we can use the combined strength of the measured data-points. In the scan parameters that were used here, the ETR of a combined multi-echo dataset was 146 ms, while the TR was 600 ms. Finally, our results demonstrate how both signal change and noise, represented in the CNR, dictate the actual ETR.Conclusion
Our study offers both a novel approach to examine and optimize fMRI protocols and an insight into fMRI temporal effectivity. In the experimental setup examined here, multi-echo EPI at 7T provided temporal resolution of <150 ms. However, further analysis is required, incorporating additional factors that exist in a real experiment and affect the ETR such as the physiological noise and the “resting-state” activity.Acknowledgements
We are grateful to the Weizmann Institute’s MRI technician team - E. Tegareh and N. Oshri - for assistance with the dynamic phantom handling and scanning, to Dr. Amir Seginer for discussions on the data analysis, Ghil Jona for assistance with cartridge preparation and to ALA scientific inc. team for their extensive support. We also acknowledge the receipt of the pulse sequences from the Center for Magnetic Resonance Research (CMRR), University of Minnesota, USA. Dr. E. Furman-Haran holds the Calin and Elaine Rovinescu Research Fellow Chair for Brain Research.References
[1] Viessmann, O., & Polimeni, J. R. (2021). High-resolution fMRI at 7 Tesla: challenges, promises and recent developments for individual-focused fMRI studies. Current Opinion in Behavioral Sciences, 40, 96-104. [2] Gonzalez-Castillo, J., Panwar, P., Buchanan, L. C., Caballero-Gaudes, C., Handwerker, D. A., Jangraw, D. C., ... & Bandettini, P. A. (2016). Evaluation of multi-echo ICA denoising for task based fMRI studies: Block designs, rapid event-related designs, and cardiac-gated fMRI. Neuroimage, 141, 452-468. [3] Kundu, P., Voon, V., Balchandani, P., Lombardo, M. V., Poser, B. A., & Bandettini, P. A. (2017). Multi-echo fMRI: a review of applications in fMRI denoising and analysis of BOLD signals. Neuroimage, 154, 59-80. [4] Bhavsar, S., Zvyagintsev, M., & Mathiak, K. (2014). BOLD sensitivity and SNR characteristics of parallel imaging-accelerated single-shot multi-echo EPI for fMRI. Neuroimage, 84, 65-75. [5] Kumar, R., Tan, L., Kriegstein, A., Lithen, A., Polimeni, J. R., Mujica-Parodi, L. R., & Strey, H. H. (2021). Ground-truth “resting-state” signal provides data-driven estimation and correction for scanner distortion of fMRI time-series dynamics. NeuroImage, 227, 117584. [6] DeDora, D. J., Nedic, S., Katti, P., Arnab, S., Wald, L. L., Takahashi, A., ... & Mujica-Parodi, L. R. (2016). Signal fluctuation sensitivity: An improved metric for optimizing detection of resting-state fMRI networks. Frontiers in Neuroscience, 10, 180. [7] https://alascience.com. [8] Moeller, S., Yacoub, E., Olman, C.A., Auerbach, E., Strupp, J., Harel, N., & Ugurbil, K. (2009). Multiband multislice GE-EPI at 7 Tesla, with 16-fold acceleration using partial parallel imaging with application to high spatial and temporal whole-brain fMRI. Magn. Reson. Med,63,1144.[9] Feinberg, D.A., Moeller, S., Smith, S.M., Auerbach, E., Ramanna, S., Glasser, M.F., Miller, K.L., Ugurbil, K., & Yacoub, E. (2010). Multiplexed echo planar imaging for sub-second whole brain fMRI and fast diffusion imaging. Plos One, 5, e15710Figures
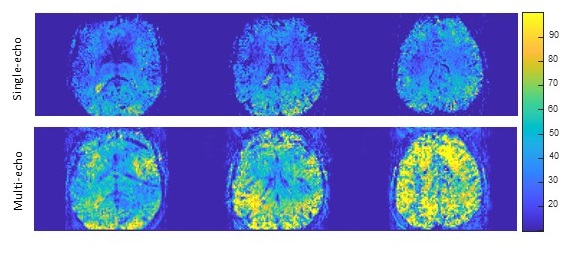
Figure 1: The tSNR for single
& multi-echo EPI at 7T (acquired in a single subject). Scan parameters: TR = 1000 ms, in-plane resolution
2.14x2.14 mm2, slice thickness 2.2 mm, TE (single-echo) = 22 ms; TEs
(multi-echo) = 7.7 ms, 18.9 ms, 30.1 ms, number of repetitions=375. In-plane/slice
accelerations were 2/5 and 3/3 for single- and multi-echo, respectively. Three representative
slices out of 45 are shown.
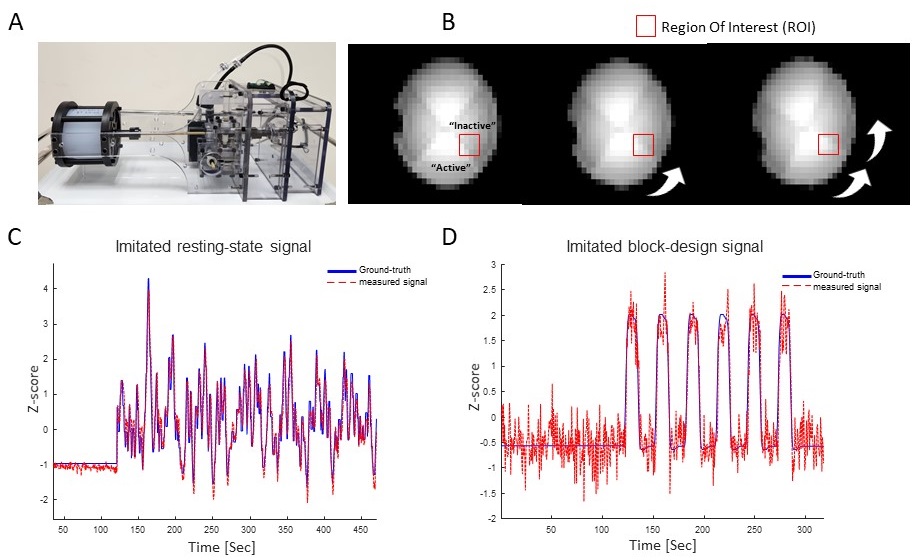
Figure 2: Using a dynamic phantom to
create “fMRI-like” signal. (A) A photo of the dynamic phantom setup. (B) Images
of the rotating phantom part captured at three positions. The agarose-head consists
of four quarters with varying agarose concentration – two representing the
signal in “Inactive” state and two representing the signal in “Active” state. The
red overlay shows the signal change in ROI at three different rotation angles. (C)
and (D) compares the measured and set (“Ground-truth”) signals in a “resting-state”
experiment (C) and in a task-based block-design experiment (D).
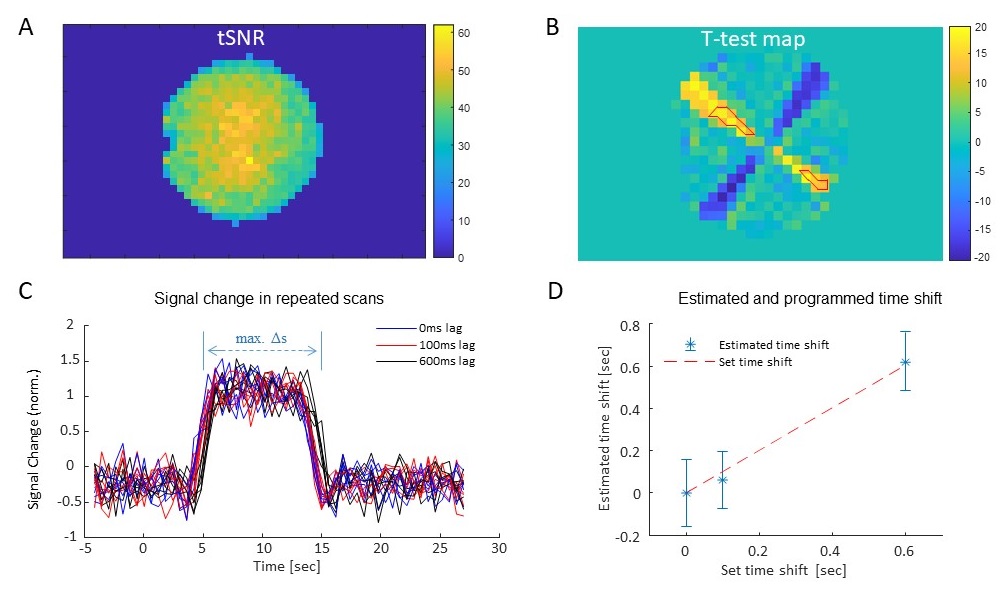
Figure 3: Simulating block-design
signals with different time lags. (A) The
tSNR in a representative scan. (B) A parametric map representing the t-test values
calculated between set and measured signals for a 0 ms-lag scan. Red overlay
shows the voxels with a t-test>10 that were used for the analysis. (C) The normalized
averaged (over blocks) signal change in repeated scans for the 3-time lags (0,
100 & 600 ms) for a representative voxel. (D) The mean and SD of the
estimated time shifts across voxels.
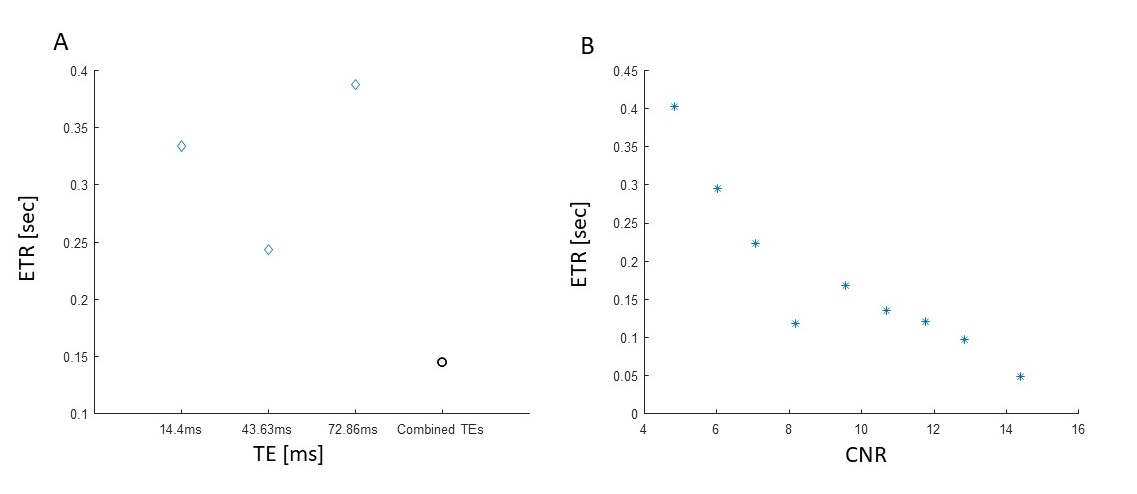
Figure 4: The Effective Temporal
Resolution (ETR) as a function of TEs and CNR. (A) The ETR, computed as the SD of the estimated
time delay over all voxels, as a function of the separate signal at each TE and
a combined one computed as the average signal. (B) ETR as function of the CNR (calculated
as the average signal change amplitude divided by the averaged SD of the
signal).
DOI: https://doi.org/10.58530/2023/3679